BTC Price Prediction and Elliott Wave AnalysisHello friends,
Thank you for joining me in my analysis. Remember to like, subscribe, and stay tuned for more updates. See you soon!
Thanks, Bros
BTCUST trade ideas

BTCUSDTPreferably suitable for scalping and accurate as long as you watch carefully the price action with the drawn areas.
With your likes and comments, you give me enough energy to provide the best analysis on an ongoing basis.
And if you needed any analysis that was not on the page, you can ask me with a comment or a personal message..
Enjoy Trading... ;)

#BTC Potential Bullish Head and Shoulders Structure📊#BTC Potential Bullish Head and Shoulders Structure⚠️
🧠 The rebound has occurred. If you participated in long trading yesterday, the stop loss can be moved up to the long defense point, because a break here means we will go to a lower place.
➡️From a structural perspective, if a bullish head and shoulders structure can be constructed near the buy zone, then we have the potential to reverse the downward trend. Only by successfully breaking through the inflection point of 67280 can we maintain an optimistic attitude.
Let's see 👀
⚠️Don’t forget risk management⚠️
✔️Trade Security✔️
🤜If you like my analysis, please like 💖 and share 💬
💕 Follow me so you don't miss out on any signals and analyze 💯
BINANCE:BTCUSDT.P

BTCUSDT - Probable Inverse Head & Shoulders with BUILD UP?!Hey guys!
Market's been really challenging lately, specially for those into Futures Trading that's why I'm going to repeat again. I strongly recommend you SPOT trade instead. So, as for BTC goes, the liquidity absorption is real and to either side!
Where to buy?
1) One would be the rising green zone I've marked but this would mean a drop to about 56k or 52k which is pretty heavy. Still is my favorite scenario.
2) I suspect BTC is creating a pattern right now, just right after the uptrend which could be an inverse head & shoulders one. This pattern forming after an uptrend is pretty strong and bullish. However, we still need to see a proper breakout of the neckline otherwise this idea gets destroyed. So I'd buy the re-test of the breakout if it ever happens.
TARGETS
1) Let it run and there are several ways to take profits partially but I'd suggest as long as the uptrend doesn't break, just hold it and take partial profits at massive supply zones. Otherwise, don't touch it.
This idea is to spot for the long term. This asset is still in balanced mode, there hasn't been a breakout of the range yet. However, it's worth to note it's still a good moment to analyze what could happen to be prepared and take action accordingly.
Hope you find it useful!
Kina Tip of the Day: Remember BTC is the father of Crypto, the rest are just babies that follow big daddy so, don't marry any coin at all except for BTC. That's it.
Keep it shiny ⭐
Kina, The Girly Trader

BTC plan for the upcoming monthsMax pain is coming for BTC traders IMO, equla highs untaped, many started to be bearish early, the ideal scenario based on people emotions to taped the qual highs and liqudate the early shorts and make people bullish again at the highs then smash the price to 50K make people think the bull market is over, liquidate the shorts again and starting the bull market
BTC 1d - ICTalthough price reached the weekly fvg we didn't get a reaction. there is a possibility that we will reach the daily fvg we have below before we start displacing higher.
im waiting to see the 4h price action

What comes next? Todays Bitcoin OutlookBitcoin still in bearish market structure.
Monthly candle looking bad.
Might see some relief rally short term wise.

Bitcoin long from 61500$Waiting for 61.5k region and then i will start executing long positions.
If SL gets hit , there is another level at 59k.
Watching them carefully.

BTC is okay until...BTC staying in this zone and doing whatever it can is just noise to me.
This zone should not be broken down; otherwise, we might see a new macro low.
That's the invalidation for my bullish bias. I will monitor what BTC does currently and in the next few days after that.

CONGRATS IF YOU TOOK THAT LONG | BITCOIN | QUICK MARKET UPDATE The main levels today are the sweeps from out ranges for model 1 plays and a potential change in MS from a deeper retracement into demand.
Confirmation: change in MS on the 5m - 10m+
Follow for more

BTC BULLISH DIVERGENCEBitcoin was building towards my favorite signal on the 4-hour chart - bullish divergence with RSI coming out of oversold. As you can see, it was confirmed (there were failed bullish divergences in the middle of this, as they often build).
Take a quick look at the recent top around $72,000. What did we have? Bearish divergence with overbought RSI.
The world is seemingly expecting a trip to $60,000 now that $67,000 support is broken, much like we anticipated a move to the range highs at $74,000.
Wouldn’t it be fun to have Bitcoin put in a local bottom here?
The chop continues either way.

BITCOIN READY TO MOVE >>(guess) or comment #bitcoin i will tell Hello traders,
What the next bitcoin move if you guess then you are a good trader>>
if you can't i will tell the next movement if you comment #bitcoin
so follow this page for next update

BTCUSDT: Trend in 2H time framePlease pay special attention to the accurate trends, colored levels, and red level as SL.
Be careful
BEST
MT

#BTC: ARE YOU READY FOR THIS?Hey everyone!
If you're enjoying this analysis, a thumbs up and follow would be greatly appreciated!
BTC is currently forming an ascending triangle pattern on the daily timeframe. The price is testing the lower trendline, which is a key support level.
Here's what we're watching:
Potential breakout: A clean break and close above the upper trendline of the triangle would be a bullish signal, potentially leading to higher prices.
Target: If the breakout is confirmed, some analysts are targeting $100k. However, it's important to remember that price targets are not guarantees.
Breakdown scenario: If the price breaks down and closes below the lower trendline with significant volume, it could indicate a bearish reversal. Potential support levels could be around GETTEX:52K -$60k.
Let me know your thoughts in the comments below!

BTC's next moveIf BTC doesn't reach $66k, then this scenario will most likely play out. However, this isn't a bear trend; it's just complex sideways movement.

Bitcoin (BTC) Analysis: Navigating Key Levels Amid Market News🔍Bitcoin (BTC) is responding to significant market events. Here's a detailed analysis to guide your trading decisions.
📆Coin of the Day: Bitcoin (BTC)
About the Project:
Bitcoin is the first and most widely recognized cryptocurrency, often referred to as digital gold. It operates on a decentralized network without a central authority, using blockchain technology to facilitate secure and transparent transactions.
🧩Technical Analysis
4-Hour Timeframe
This analysis focuses on shorter-term trends, identifying critical levels and potential scenarios.
📉Support and Resistance:
Key Supports:
66,208.06
64,616.89
62,450.00
Key Resistances:
70,108.93
73,305.41 (Major Supply Zone)
📈Bullish Scenario:
Supply Zone Test: BTC is currently within a significant supply zone (70,108.93 to 73,305.41). A break above this zone could indicate strong bullish momentum.
Targets: Key resistance levels to watch are 70,108.93 and 73,305.41. Breaking above 73,305.41 could signal a continuation of the uptrend.
📉Bearish Scenario:
Break Below Key Support: If BTC fails to hold above 66,208.06, it could signal a bearish reversal.
Targets: The next support levels are at 64,616.89 and 62,450.00.
📊Volume and RSI:
Volume Analysis: Recent volume spikes suggest increasing interest, which is critical for sustaining upward momentum.
RSI Analysis:
Current RSI: 41.09, indicating neutral momentum. Key RSI levels to watch are 55.29 for resistance and 41.09 for support.
💡Key Triggers:
For Long Positions:
Entry Trigger: Break and hold above 70,108.93.
Strategy: Open a position on the hold of this level, targeting 73,305.41. Use tight stop-loss orders to manage risk.
For Short Positions:
Entry Trigger: Break and retest below 66,208.06.
Strategy: Open a position if the price confirms a break below this level, targeting 64,616.89 and 62,450.00. Adjust stop-loss orders accordingly.
📉Market News Impact
Upcoming News: The U.S. interest rate and inflation data are expected today. These macroeconomic factors can have a significant impact on Bitcoin's price.
Interest Rate Decision: A higher interest rate might lead to a stronger USD and potential bearish pressure on BTC.
Inflation Data: Higher inflation rates could increase demand for Bitcoin as a hedge, potentially driving the price up.
👨💻Trading Positions
Long Position
Entry Trigger: Hold above 70,108.93 with confirmation from RSI and volume.
Strategy: Open a position on the hold of this level, targeting 73,305.41. Use tight stop-loss orders to manage risk.
Short Position
Entry Trigger: Break and retest below 66,208.06.
Strategy: Open a position if the price confirms a break below this level, targeting 64,616.89 and 62,450.00. Adjust stop-loss orders accordingly.
📝Bitcoin is currently navigating key levels amidst significant macroeconomic news. Traders should closely monitor these levels and the impact of the U.S. interest rate and inflation data. Volume and RSI trends will provide additional insights into momentum shifts.
🧠💼Always remember the inherent risks in futures trading, with the potential for margin calls if risk management is neglected. Stick to strict capital management principles and use stop-loss orders, ensuring an initial target with a risk-to-reward ratio of 2.
🫶If you found this analysis helpful and want to support me, please boost this analysis. Feel free to leave a comment or suggest a coin you'd like me to analyze next.

$BTC crucial levelBitcoin swept some of poor lows and found support
A poor low occurs when the market reaches a low point and lacks excess, resulting in multiple TPOs forming a flat bottom.
The crucial level that Bitcoin has to reclaim is 67.8k (4hema200 & hvn)
Any rejection at this level will take us down to 63k to 62k area (single prints & npoc)

#BTC has a chance to form a bearish wolf wave📊#BTC has a chance to form a bearish wolf wave📉
🧠From a structural point of view, we are currently in the support zone, and the probability of rebound is higher than the probability of decline. Even if there are short expectations, it is not recommended to chase short here. It is reasonable to go short after rebounding to the resistance zone.
➡️From the perspective of wave theory, main wave 4 has been completed, and main wave 5 may be completed through micro pulse waves.
⚙️Because there is such an expectation, we will continue to be patient with the short orders we hold. If the development goes as expected, then we will make more profits.
Let's see 👀
⚠️Don’t forget risk management⚠️
✔️Trade Security✔️
🤜If you like my analysis, please like 💖 and share 💬
💕 Follow me so you don't miss out on any signals and analyze 💯
BINANCE:BTCUSDT.P

btcHello traders hope you are enjoying our Analysis.
Now we are here again with a new trading opportunity ,we will discuss today about BTCUSDT
smart money concept analysis: Don't get caught in whale traps. What do you think of this idea? What is your opinion? Share it in the comments📄🖌 If you like the idea, please give it a like. This is the best "Thank you!" for the author

Is the Bitcoin market in the hands of sellers?📊 Due to the increase in the downward momentum of the price movement, if the range of 66300 units is broken downwards and the price stabilizes below it, the price may fall to the range of 64200 units 🎯 and in the case of the strength of the range of 62300 units🎯🎯.
📊 Otherwise, the possibility of price increase up to the range of 69800 units.

Long on BTCUSDTVery interesting moment with good try to buy with low risk parameter. We a in the global flat channel and forming the up trend channel. Now we are on the down level of this channel and next few days we should: a) go up and brake global flat channel or b) brake up channel and go to the down. I then the "a" should be. Let`s see.

🅱️ Bitcoin Headed To $100,000!!! FOMO! Warning! Must Read!There is no need to panic, cancel any trades nor act fast; there is always time... Did we miss the bullish wave?
It is true that Bitcoin is now showing multiple very strong bullish signals and this is no cause for alarm; Bitcoin being bullish is always good for us and the Cryptocurrency market as a whole. We love Bitcoin/Crypto!
First, the chart:
➖ Bitcoin closed weekly full green and back above EMA10. This means that the bulls are in full control when it comes to the short-term potential. Where the action is headed next.
➖ Next, Bitcoin is trading above $60,000 which is ultra-bullish and this after months of a strong distribution/consolidation phase...
What will happen next?
What happens now?
👉 Yes Bitcoin is bullish and set to move to $100,000 and much, much higher in the long-term but, regardless of the short-term noise, we will see a crash in the coming days.
Bitcoin is likely to produce a lower high, not move higher and retrace to hit new lows before the major bullish wave. This fact doesn't change even though, Bitcoin is bullish!
Thanks a lot for your continued support.
Namaste.

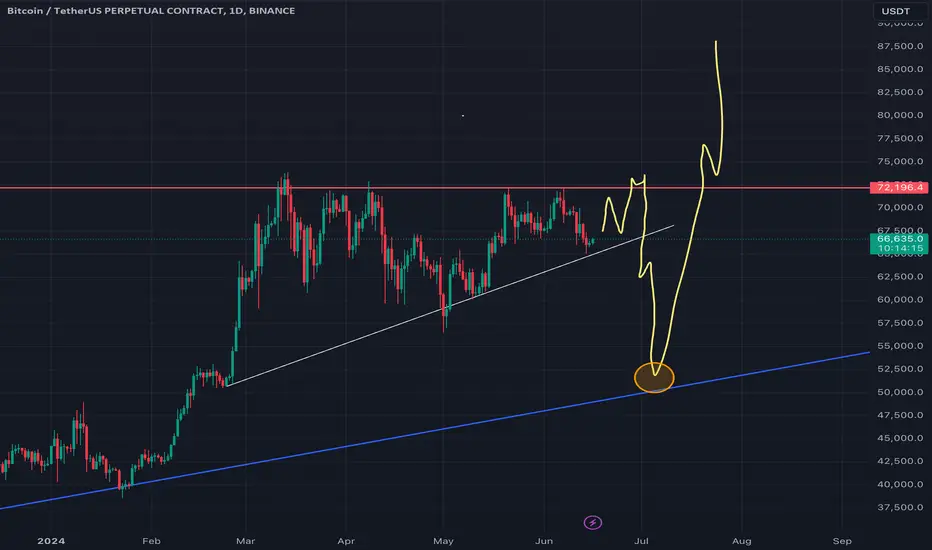
To Infinity and BeyondWell, not exactly. Things are not looking good for Bitcoin in the near-term, but there are still plenty of reasons to be optimistic. I do not trade CRYPTOCAP:BTC but like to keep up with its price and test my strategies with it. I’m making this post to see how accurate my predictions are in a few months, and will use it to influence future trading plans. Since I do not have a dog in this fight, I’m going to try to give the most unbiased analysis possible.
From what I’m seeing, I think the price is ready to make another drop to $51,500 - perhaps even lower.
CRYPTOCAP:BTC is currently in a Primary ④ that started in April, which I think will retrace to at least 0.618 of the previous impulse. Closer up, we can also see that the price is slipping below the RMI trend line. I’m counting this current wave as a (C) wave, so given this context I think we will start to see selling pressure ramp up in the coming days.
There is a huge FVG from $59,000 to $53,000, which could be an area of support. In keeping with Wave Theory guidelines, an alternative prediction is that ④ could terminate closer to (4) of the previous impulse. If this scenario were to play out, 0.618 on the Primary Fib Extension ($41,000) would be another area of possible support and the price would clear a lesser FVG to arrive there as well.
Between the two, I’m leaning towards the first theory because getting to $51,00 by mid-July would make ④ more proportional. Additionally, as we zoom out, we can see that the peak of ① is awfully close to BTC’s current levels. The rules state that a W4 cannot enter W1’s price territory, and so far the closing price has not breached it on the Weekly chart (although it has on the Daily). Currencies behave differently than indexes so this is somewhat excusable, however it is another reason to keep in mind that the price may not drop below the FVG, so it could be a safe buying zone.
Once ④ ends, Bitcoin will most likely reach new ATHs to finish out the year. As ridiculous as it sounds, I think $100,000 in ⑤ is not out of the question! Let me know if you’re arriving at a similar conclusion or if you have any questions about my analysis.
