BTCBTC mitigating Daily timeframe Order block to moving upside. So Bitcoin moving some upside possible.
But $62800 is the best support area of Bitcoin. So maybe Bitcoin moving downside and touch the support to moving upside is high possible.
BTCUST trade ideas

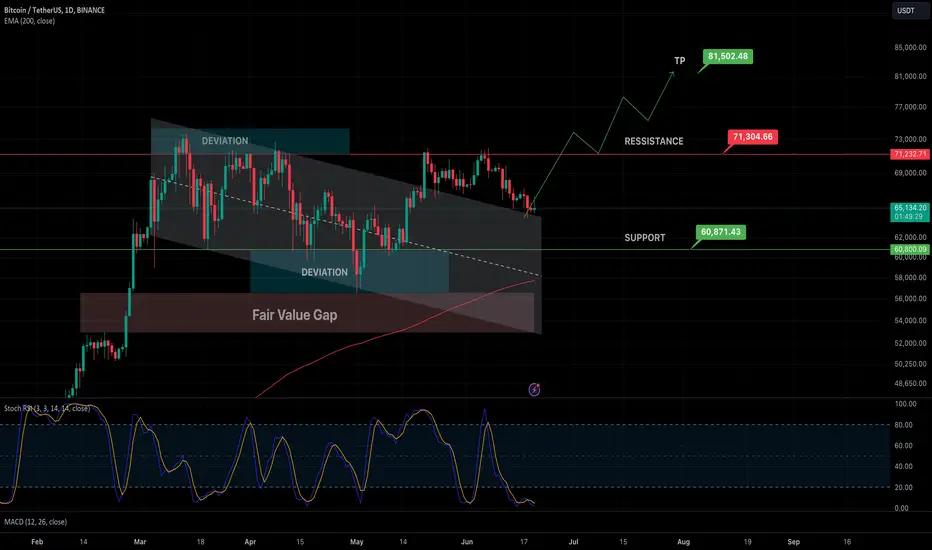
Chart Idea - BTC Swing Long for 6-8 weeksBTC looking bullish for next few weeks. It can certainly go and test $62k to $60k region. However, as per my TA, it's already hit the local bottom and need good bounce from here. Taking a swing long for next few weeks from FWB:65K on the basis of following confirmations.
Confirmations on Daily TF:
- Bull Flag Breakout and Retest
- 0.5 Fib Level Retracement at $64200 region
- Stoch RSI oversold at around 1 region
Trade Setup:
Entry: $65000
TP: $81500
SL: $59999
BTCUSDT is BullishBullish RSI divergence seems to be playing out on hourly time frame. First higher low and higher high are printed which according to Dow theory are classic signs of the beginning of a bullish rally. Targets are mentioned on the chart.

Btc price prediction and Elliott wave analysis Hello Friends,
Thank you for joining me in my analysis. Remember to like, subscribe and stay tuned for more updates, thank you, see you soon.
Thanks Bros

$BTC bullish divergence#bitcoin #btc has been forming a bullish divergence to be played out. A moderate bounce in mid/short time frame may be necessary. Breaking the lower trend line and major support will be the invalidation. Not financial advice.

BTCUSDT RETRACEMENTWhen you look at the charting, you will clearly see where the price retrace will be reversed potentially speaking; BTCUSDT OVERALL IS UPTRENDING
Trade wisely

BTC MovementI think its Ascending Triangle but everyone saying BTC is totally bearish will crash from here. Please share your opinion friends?

BTCUSDT. Trading opportunityDaily Timeframe Analysis:
The price has been in a sideways movement on the daily timeframe since February 2024. The current buyer's vector 10-11 has a potential target of 72797, but the buyer has not yet reached this goal. The seller has formed a selling zone at the end of the unfinished buyer's vector 10-11 (red rectangle on the chart, lower boundary of the seller's zone at 66060.31).
Currently, the price is squeezed between two levels: 64602.77, which represents the buyer's defense of volume accumulation at the lower boundary of the daily range, and 67298.81, which represents the seller's defense of the selling zone.
Hourly Timeframe Analysis:
On the hourly timeframe, the price has formed a sideways movement. The current buyer's vector 9-10 has a potential target of 67298.81 (!). The upper boundary of the range is at 67370.24, and the lower boundary is at 65078.
Buying Strategy:
From the idea of realizing the current buyer's vector 9-10 within the hourly range, with a potential target of 67298.81.
From the idea of realizing the buyer's vector 10-11 within the daily range - when the price breaks above the upper boundary of the hourly range (67370.24) and the buyer defends this breakout. The potential target is 72797.
Selling Strategy:
From the idea of realizing the seller's vector 10-11 within the hourly range from the upper boundary of the range (67298.81, 67370.24). The potential target is currently unknown and will be formed after the realization of the buyer's vector 9-10.
From the idea of buyer weakness on the daily timeframe - when the price breaks below the lower boundary of the hourly range and the level 64060, and the seller defends this breakout. The potential target could be 60200.

BTC DAILYBTC Overview Range
We have got so much room to this range, I believe these are lows that we definitely needed to see for BTC and Crypto in general. How will we drive a car without gas? Therefore, BTC will refuel gas at BRKR level (green highlight) we must fill these imbalance levels in order to start seeking higher. These are the lows that give us opportunity to buy more at our (current) discount areas.
@Metz

Possible downward trendThere is still liquidity downwards so we will have to revisit that.
Those ETF's are gonna wanna buy low and sell their client huge dreams at high prices.

170R BTC LongHigh risk trade.
Expecting a move to $140k within 4 weeks once the all time high is broken.


Bitcoin heading to test the support level again soon, breakout?Take noted the below is not an investment advise, bet at your own risk. I am solely not responsible for any of your loses in money or assets.
The Current Bitcoin price is USDT26221.12 as of 26 September 2023.
The Bitcoin have potential to drop to USDT24292.54 range in the coming 1.5 months before the Fed's FOMC in November 2023.
The price will hover between USDT24292.54 to about USDT29240.33 within this period.
Potential strong tailwind is the pause of US Fed's rate hike this coming November 2023. This will drive and test the resistance level at USDT29240.33. If there is a breakout then the next level of stronger resistance based on the dynamic resistance will be at USDT31334.78. If there is a breakout at USD31K plus then the next power strong 1 week resistance at USDT63665.58
Potential strong headwind will drive the market to around USDT24292.54 because of higher rate for longer by Fed's US. If next 1.5 months down the road if there is other or fews strong headwinds appears then the price might breakout from USDT24292.54 and head lower to a super stronger support of 1 month chart at USDT14576.47. This is highly unlikely to happen withing next few months as the Fed's is data dependent and also depend of the next 6 months' data to say that they will maintain the Fed's funds rate for longer. Still I think is not clear at the moment that the Fed's need higher for longer for 2 years.
USDT14576.47 is a very strong support level based on the 1-month chart of Bitcoin. I would only start buying a little at USDT24292.54 and reassess for 2 to 3 weeks before buying more. If by the time Bitcoin reach USDT24292.54 and the S&P most likely have no reach 3900. The Bitcoin might go lower following the S&P 500 going to 3900.
Based on current market condition it is highly unlikely to get a low that surpasses last year October 2022 bottom. However, the future for a US recession is unclear currently as there is both camp of soft landing and a recession.

BTC weekly time frame I can see Cup pattern in weekly time frame but I still insist that BTC must touch 63K FVG and support if this support fail we must touch 58
I am bullish about Bitcoin but we need some time also USDT dominance pumping

Market overviewBitcoin (BTC): $66,194.13 (-0.05%)
Bitcoin Dominance: 55.4%
Fear and greed index: 71 (greed)
WHAT HAPPENED?
Since last week, bitcoin has lost about 6% in price. The largest volumes, which were priced at ~$69,000, were sent for sell, which led to the continuation of the downward movement to the border of the local sideways.
WHAT WILL HAPPEN: OR NOT?
We expect the downward movement to continue at least until the next sell zone. Fixing above the $70,000 price may contribute to changing the scenario.
Buy zones: $64,500-$62,700 (pushing volumes), $61,200-$60,400 (volume zone), $58,500-$57,000 (volume anomalies).
Sell zones: ~$67,000 level (delta anomalies), $68,900-$69,800 (volume anomalies), $70,800-$71,400 (accumulated volume).
IMPORTANT DATES
We have been following macroeconomic events since Tuesday:
• Tuesday, June 18, 9:00 (UTC) — publication of the consumer price index for May in the eurozone;
• Tuesday, June 18, 12:30 (UTC) — publication of the base index and retail sales volume for May in the United States;
• Wednesday, June 19, 6:00 (UTC) — publication of the consumer price index for May in the UK;
• Thursday, June 20, 22:45 (UTC) — publication of GDP data for the 1st quarter in New Zealand;
• Thursday, June 20, 7:30 (UTC) — Swiss interest rate decision;
• Thursday, June 20, 11:00 (UTC) — UK interest rate decision;
• Thursday, June 20, 12:30 (UTC) — publication of data on initial unemployment claims and the index of manufacturing activity in the United States;
• Friday, June 21, 13:45 (UTC) — publication of the index of business activity in the manufacturing and services sectors of the United States;
• Friday, June 21, 14:00 (UTC)— report on home sales in the US secondary market;
• Friday, June 21, 18:00 15:00 (UTC) — The US Federal Reserve's monetary policy report.
*This post is not financial recommendation. Make decisions based on your own experience.

Bitcoin (BTCUSDT) Technical Analysis on BinanceBitcoin (BTCUSDT) Technical Analysis on Binance
General Context
The BTCUSDT chart on Binance shows a long-term ascending channel. The current price is within this channel, indicating a continuous upward trajectory with future projections based on key resistance and support levels.
Indicators Used
Exponential Moving Averages (EMA):
Indicators of short, medium, and long-term trends.
Fibonacci Levels:
Used to identify key support and resistance points over time.
Identified Patterns
Ascending Channel: Indicates a long-term upward trend.
Future Price Projections:
240,000 USD: Projected price level within the channel.
1,410,000 USD: Projected price level as a very long-term target.
Support and Resistance Analysis
Supports:
90,000 USD: Main support based on the ascending channel.
40,000 USD: Additional support in the middle of the channel.
Resistances:
240,000 USD: Future resistance within the channel.
1,410,000 USD: Extreme projected resistance.
Possible Long Entries and Targets
Main Entry:
Entry Point: 100,000 USD (near the support of the ascending channel)
Targets:
Target 1: 240,000 USD (key resistance of the channel)
Target 2: 400,000 USD (potential extension)
Stop-Loss: 90,000 USD (below critical support)
Justification: Entry based on the expectation of the continuation of the long-term upward trend.
Additional Analysis
Long-Term Strategy: The ascending channel suggests a long-term strategy with significant targets, considering future projections.
Risk Management: It's crucial to adjust stop-losses as the price approaches the projected targets to protect the invested capital.
Conclusion
The BTCUSDT chart on Binance suggests a strong long-term upward trend. The proposed entry and exit strategies are based on key technical levels within the ascending channel, providing a high potential return investment approach.
Strategy Recommendations
Continuous Monitoring: Continue monitoring the price behavior within the ascending channel for necessary adjustments in strategies.
Risk Management: Maintain proper risk management with well-defined stop-losses to protect capital in case of unexpected reversals.
This analysis provides a clear and detailed view of long-term opportunities in the BTCUSDT pair, enabling informed and strategic investment decisions.


BTCUSDTSym triangle and its target.I had to show What I saw and I want to share my point of view with you all.Taking my analysis as a conformation or using to as a direct guide for trade.it's up to you.I hope this will be invalided.Otherwise alts will be crushed!!!

BTC's next move?#Bitcoin 💸 is going to do something significant on June 22nd
June 22nd is a Gann date, but according to me, it's a time when nothing significant happens immediately. However, days or weeks after it, the price tends to gain some real direction. The 22nd of June itself is not the reason for this movement; there are multiple other factors on the chart indicating the next significant direction.
This 22nd-24th of June looks bullish. It will pump this time, and I will show the reasons...

Last Call - A mega Pump will happen upto $100kas you see the recent hours chart try to short but no way! and all the candles reversed strongly because at this limit in btc history there is many support limits, we are sure it will pump tonight or tomorrow. for crypto buyers it will be one of never happen time for making huge profits.

Bitcoin LiquidationBitcoin Liquidation
there is Short & Long Liquidation price on binance
I look about the liquidity prices there is a huge liquidity
Long Liquidation red line's
64200
62650
Short Liquidation long line's
71750
67700

83k , i see you soonfibonacci retracement is a good analyzer
buy and hold in 60k - 63k, if you are not pro trader
HODL is a crypto slang term meaning to buy-and-hold indefinitely. It implies not selling when markets go down or become volatile. Sometimes, it is said to mean "hold on for dear life." HODL originated from a typo of "holding" as "hodling" in a 2013 online post.
