BTCUST trade ideas

Trade Signal for BTCUSDT: Sell**Direction:** Sell
**Enter Price:** 67540.01
**Take Profit:** 66458.64
**Stop Loss:** 68832.74
**Justification for the Forecast:**
This trade signal is generated based on a comprehensive analysis using the EASY Quantum Ai strategy. Several key factors have contributed to this prediction that BTCUSDT will move in a downward direction:
1. **Technical Analysis:** Recent price movements indicate that BTCUSDT is facing strong resistance near the entry price. Historical data from the EASY Quantum Ai strategy shows a significant number of rejections at this level, suggesting a high probability of a downward move.
2. **Volume Analysis:** An analysis of trading volumes indicates that selling pressure has been increasing, with sell orders significantly outweighing buy orders. This imbalance often precedes a price decline.
3. **Market Sentiment:** Sentiment analysis derived from social media trends and news headlines related to Bitcoin has shown an increase in negative sentiment. This is often a precursor to selling pressure as traders react to bearish news.
4. **Macro-economic Factors:** Recent reports indicate potential regulatory changes and economic factors that are less favorable for Bitcoin. These macro-economic elements contribute to a bearish outlook for BTCUSDT.
5. **Indicator Analysis:** The EASY Quantum Ai strategy utilizes a suite of technical indicators like moving averages, RSI, and MACD. Current readings show bearish crossovers and overbought conditions, further supporting a sell signal.
**Risk Management:**
- The **Stop Loss** is set at 68832.74 to limit potential losses, taking into account recent volatility and technical levels.
- The **Take Profit** target is placed at 66458.64, considering support zones and previous lows identified by the EASY Quantum Ai strategy.
This signal aims to capitalize on a short-term bearish trend while employing prudent risk management practices.
**Disclaimer:** Trading cryptocurrencies involves substantial risk, and it is essential to perform your own analysis before making any trading decisions. Always consider your risk tolerance and consult with a financial advisor if necessary.

Bitcoin is going to shoot up to $112k+ in June / JulyAll details are drawn on the chart.
Basically BTC is in a huge bull market with a clear imbalance of demand and supply. There was 3-month long reaccumulation period at all time high of $69500 with all outstanding supply bought up. Price is gonna shoot up to $112k at minimum very swiftly.

Bank Time BoiNew Update: I knew there were two bounces, I just didn't realize the first one would make an all-time-high only to meet its old bottom at 20ish k. Here's the crazy part -- it won't close below 50k. Good luck ya'll. CYA at the bank

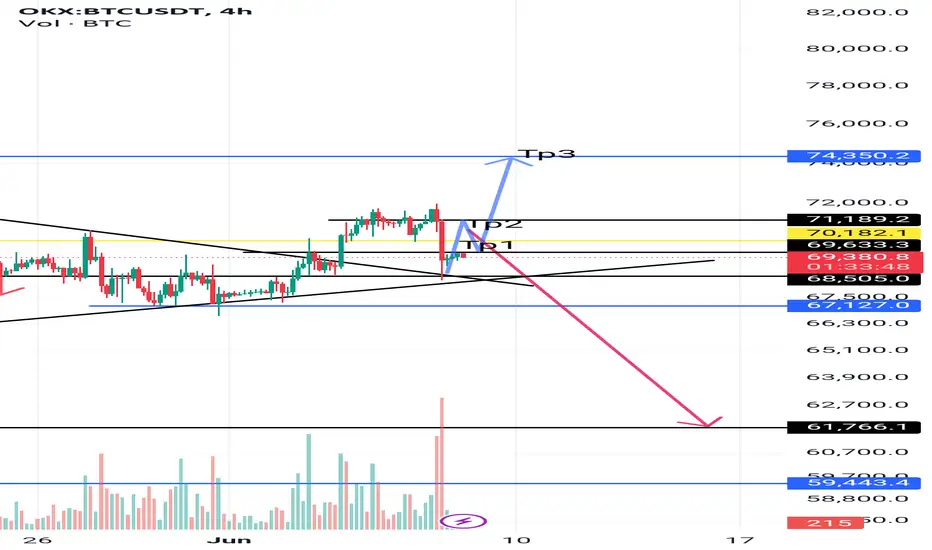
Btc4hBitcoin can climb from the current point to targets 1 and 2, and from there it must decide whether to break the ceiling or go down to 61,000.

Bitcoin: Will Low Volume Push Price to $61,000?Bitcoin (BTC) has lost momentum over the past two days, raising concerns among analysts, and traders. The leading cryptocurrency is currently trading sideways, lacking the strong volume needed to break through key resistance levels.
Low trading volume often precedes price dips, and if we don't see a surge in buying pressure soon, we could see Bitcoin revisit the $61,000 area.
The $63,000 price point has proven to be a significant hurdle for Bitcoin in recent weeks. Without a significant increase in trading volume, I believe a price correction towards the $61,000 support level is a strong possibility.

Manage your risk! My next trade🚨In todays video we talk about:
the importance of risk management as a fundamental pillar in trading
the global outlook on bitcoin
the local outlook on bitcoin
potential setups: sweeps of the internal range highs
Follow for more

Bitcoin/TetherUSHello and respect to the honorable traders,
today we are examining the continuation of Bitcoin analysis. Previously, we mentioned that Bitcoin will experience an upward movement and then a pullback. According to Smart Money Concept analysis, this scenario is likely to be valid, and we are currently continuing the analysis. Bitcoin is likely to have a short pullback to the specified range and with the start of its downward trend, it will reach the $50,000 range.

Chart Pattern Analysis Of Bitcoin
K3 break up and close upon K2 under low supply pressure,
It seems that the following candles will price up to test the resistance.
I don’t think this is the start of another bull run,
It is just a Wave(B) of a larger scale consolidation process.
But during this process,
Some other crypto tokens will do better.

BITCOIN BIG SHORT IS COMING SOON ( 90 % down from 71000 $ )Bitcoin has completed first leg and second leg and now third leg plays in to close the bullrun cycle and drop till 9000 $ or 6666 $ to complete its cycle .

#BTC reaches the buying zone📊#BTC reaches the buying zone✔️
👀 We pulled back sharply after being rejected at the resistance zone as expected and have now stopped falling near the buy zone.
🧠From a structural point of view, the bullish cup-and-handle structure has not been destroyed, so the expectation of rising prices still exists, and it is impossible to chase the decline in the buying zone.
➡️From the perspective of wave theory, before wave 4 is broken, the upward trend is intact, and wave 5 is still worth looking forward to.
⚠️Note, if we continue to fall after rebounding, we need to be wary of entering the complex consolidation stage at the weekly level again.
☕️In addition, after experiencing a sharp decline, it is also a weekend, so the trading volume should not be too large, and the situation reflected in the chart should not change much. So have a good rest over the weekend. ☕️
⚠️Don’t forget risk management💯
✔️Trade safe✔️
🤜If you like my analysis, please like 💖and share it
👋follow me. Learn about further structural evolution💕
BINANCE:BTCUSDT.P

bitcoin monthly chart without log trying to give progress of bitcoin using monthly chart without using log as done in previous idea

BTC:POTENTIAL INVERSE HEAD AND SHOULDER FORMATION!!Hey everyone!
If you're enjoying this analysis, a thumbs up and follow would be greatly appreciated!
Bitcoin (BTC) Update:
BTC is forming a bullish inverse head and shoulders pattern on the daily timeframe. The price is currently attempting to break above the neckline, which could signal a significant price increase.
Here's what we're watching:
Confirmed breakout: A clean break and close above the neckline is key for this pattern's validity.
Price target: If the breakout is confirmed, we could see a rally of 20-25%, potentially reaching $85k-$90k.
Let me know your thoughts in the comments below!

BITCOIN - Price can continue move up to resistance levelHi guys, this is my overview for BTCUSDT, feel free to check it and write your feedback in comments👊
Recently price little declined and then bounced up to resistance level, which coincided with resistance area.
But then it started to decline inside pennant, where it fell to support line, breaking $67500 level.
After this BTC turned around and made strong upward impulse to $70300 points, exiting from pennant.
Then price continued to grow in wedge, where it broke $70700 level, but a not long time ago made downward impulse.
Bitcoin broke $70700 level and exited from wedge also, falling to $68300 points, after which it started to grow.
At the moment, I think BTC can little decline again and then continue to grow to $70700 resistance level.
If this post is useful to you, you can support me with like/boost and advice in comments❤️

Monitoring a New Hash Ribbons SignalNine months ago, we observed a remarkable signal that led to a 14% decline followed by a 190% increase. Today, we have another signal pending confirmation.
The Hash Ribbons is a technical indicator developed specifically for Bitcoin by Charles Edwards. It uses the network's hash rate and its moving average to generate potential buy signals. This indicator is widely regarded as a representation of the fundamental health of the Bitcoin network and has been adopted by many traders and investors to identify potential buying opportunities.
How Does the Hash Ribbons Work?
The Hash Ribbons combine two moving averages of Bitcoin's network hash rate: a short-term moving average and a long-term moving average. When the short-term average crosses above the long-term average, a buy signal is generated. This signal is often represented by a blue arrow or dot on the chart.
Historical Analysis of the Blue Signal:
Examining historical data, there is a compelling trend associated with this particular signal.
- On the Weekly Chart : The blue signal appeared on August 7, 2023. Historically, out of the last 14 occurrences of this signal on a weekly chart, Bitcoin's price increased 13 times.
- On the Daily Chart : The blue signal was observed on August 12, 2023. Overall, this signal has shown up 19 times on the daily chart. Intriguingly, out of these 19 occurrences, Bitcoin's price decreased only once following the signal's emergence.
Conclusion:
If historical trends are any indication, the Hash Ribbons signal offers a high probability of bullish movement for Bitcoin. Of course, as with any technical indicator, it is crucial to use the Hash Ribbons in conjunction with other tools and analyses to make informed decisions.
It is also essential to remember that past performance is not indicative of future results. However, the historical data associated with the Hash Ribbons clearly shows it is an indicator worth closely monitoring for potential Bitcoin buying opportunities.
I will continue to keep a close watch on this indicator, which has proven to be highly profitable in the past.

Lets go NEW ATH BTC soon !!!Super bullish on BTC! Expecting price to push to all time high from daily braker block.

ATR supportBTC is in a period of extremely low volatility, often succeeded by periods of high volatility.
Looking at the average true range indicator, the last two times btc was at that ATR support level, it went 30~% + in 10~ days.
If the rest of the markets are not falling ( snp ), btc should hit 90k$~ by 21st (in 10 days~ )
We are post halving, at the start of the next bubble. Extremely bullish!

BTC Bitcoin Technical Analysis and Trade Idea - Where To Next?In thist video, we present a concise analysis of BTC Bitcoin. After recent bullish momentum, the asset has become overextended trading into resistance, and we are now seeing a significant retrace into support. Our primary objective is to pinpoint an appropriate buy entry point within this critical support zone, assuming that price action aligns with our analysis from the video.
As always, the video offers valuable insights into trade entry points, trend analysis, market structure, and price action. It’s important to note that this content serves an educational purpose and should not be interpreted as financial advice. 📈🚀📊

Bitcoin daily time updateIt seems that Bitcoin is not able to continue the trend towards higher goals and it is necessary for the price to return to the area of 49-51 thousand.

BTC: Bitcoin in a complex scenarioBTC: Bitcoin in a complex scenario
Bitcoin is near a strong resistance zone.
If you are looking for sales opportunities, you should know that BTC has a more complex scenario than it seems.
📺You may watch the video for further details📺
Thank you and Good Luck!
❤️PS: Please support with a like or comment if you find this analysis useful for your trading day❤️

BTC/USDT weekly analysis on 9th/Jun/2024Hi, crypto traders.
#Last week's results and review
Last week, the price rose as predicted, and it seemed like it might break upwards following the employment statistics. However, instead, it peaked at 72,000 USD and gradually declined. Currently, the candlestick has fallen below 5MA.
# Current order of the candlesticks and MA lines
5MA (red) > the candle = 20MA (blue) > 100MA (black) > 60MA (green)
#Technical Positive Points
- If the candlestick crosses above 5MA again, there is a possibility of breaking 72,000 USD level.
- 60MA is flat, and 100MA continues to slope upward, indicating a long-term upward trend.
- If the candlestick continues to rise, a bullish upward trend with 5MA > 20MA > 60MA > 100MA is likely to form.
#Technical Negative Points
- The recent candlestick failed to break 72,000 USD level, indicating a potential short-term price decline.
- If it doesn't attempt to reach the all-time high of 73,800 USD soon, the price may have peaked and could start to fall.
- With the slopes of 5MA and 20MA turning negative, the likelihood of a short-term price decline increases.
- 60MA and 100MA were crossed, and both seem to be turning negative.
- As the candlesticks are densely packed, there is a possibility of a sudden price movement.
#Trend forecast of this week : Short 50%
From a technical perspective, negative factors are increasingly apparent. If there is no attempt to reach 72,000 USD in the near future, the price is likely to continue declining. However, if the candlestick crosses above 5MA again, it might be worth trying a BUY position.
#Target points
If the price of Bitcoin increases
1st target: 72,000USD (The highest price on 7th/Jun/2024)
2nd target: 73,800USD (The highest price on 14th/Mar/2024)
3rd target: 80,000USD (A nice round price)
If the price of Bitcoin decreases
1st target: 65,500-66,500USD (Cross-point with 60MA & 100MA)
2nd target: 60,000USD (A nice round price, the lowest price on 10th/May/2024)
3rd target: 56,500USD (The lowest price on 1st/May/2024)
Let's enjoy trading this week too!

Long your longs dont listen to bearsAscending triangle + 1d rsi reset, there is a high chance this was one of the best opportunities you could get
