Bitcoin price trading a Value Area Low Bitcoin opened the week with a bearish move toward $83,000 before catching a lower-time-frame bounce back into the prior consolidation zone.
This region has historically acted as a magnet for price, often leading to chop and uncertainty.
Price is now retesting the value area low while approaching a single-print zone that could trigger either a sharp rejection or an impulsive bullish breakout.
Key Points:
- Retest of value area low
- Bounce lacks strong bullish volume
- Single-print zone could create sharp volatility
What to Expect:
Watch for volatility around this zone. Weak reactions may lead to lower prices, while strong bullish volume could fuel a rebound.
Trade ideas

big fall or not?actually all of this falls is related to japan 10y papers
i think this is the start of market falling maybe a little go up but 68000 is mostly possible
this is not a good time to invest in crypto and i think there is no ALT SEASON yet
its just idea and not for trade in anything do your strategy

BTC Bear Market AnalysisBitcoin confirms bear market with monthly MACD turning red, echoing past downturns. Price slid to ~$86K, down 4.55%, mirroring 2022 trajectory post-FTX with 16-17% November losses.
Key Bearish Signals
Bear flag breakdown targets $66.8K; immediate supports at $85.5K-$82K.
Lower highs/lows, EMAs sloping down, bearish engulfing on daily.
Whales distributing, weak ETF demand fuel deeper retests
#BearMarket #Bitcoin #TradingSetup

BTC Weekly Update📊 BTC Weekly Update
Right now, BTC is testing an important support zone in blue 🔵.
If this support breaks down,
the next major support zone is around $65,000.
However, BTC could first stabilize near $71,000 before moving lower.
At the moment, BTC is more bearish than bullish —
there are no strong bullish signs on the higher timeframes.
As you already know:
when BTC drops, many altcoins dump even harder,
so if you're only holding, be careful.
But remember —
you can still make money in a shorting market.
As long as BTC does not break above $97,000,
I remain more bearish for now.

BTC Update — Head & Shoulders Wipeout Loading🌊📉🏄♂️
BTC pushed all the way into that 90K resistance wall last week, cracked above it for a split second, but the bulls just couldn’t keep the board steady up there. The breakout had zero follow-through. As soon as the new week opened, sellers smacked price right back below 90K 💥 — pure rejection energy.
And then comes the spicy part:
BTC printed a clean head & shoulders reversal pattern right on top of that level. You don’t see them that perfect at macro resistance too often 🤙⚠️. It’s basically the market throwing up a big glowing sign saying “momentum’s fading, brace yourself.”
Since that rejection, price has been sliding with almost no fight — smooth downside flow, weak bounces, and candles drifting like they’re just following gravity. Right now BTC is cruising toward the 80K support zone, but let’s keep it real: that zone is not the strongest reef on the map 🪨😅. It’s more like a soft sandbar than a rock-solid base.
If bears keep their rhythm and push with conviction, the next meaningful level where price could actually stabilize is the 75K region — a spot with deeper memory, stronger liquidity, and way more structure behind it.
The vibe here?
The chart is moving clean, respecting levels, and flowing exactly the way the pattern suggests. No need to panic, no need to guess — just ride the structure and let the waves tell the story 🌊📊🔥.
Could BTC still bounce inside this move? Totally. But until we see stronger reactions from buyers, the downside waves are the ones with real shape and momentum.
This is one of those conditions where patience, awareness, and discipline pay more than prediction.
💬 What do you think about this scenario? Only share your idea if you’ve got another opinion — otherwise just hit that button 👍
#BTC #Bitcoin #Crypto #Trading #TechnicalAnalysis

price reductionWe can predict a price decline to the support floor in the inverted triangle pattern.

Bitcoin's massive fall to $50,000. OMGA massive bankruptcy for a strategy company with Bitcoin falling to $50,000, and this event will be the driving force behind the price explosion to $500,000 over the next 10 years, making it the biggest investment opportunity of the century. So, follow the market direction without bias and know that huge companies have gone bankrupt before with the fall of even gold, but gold has always recovered and remained a store of value, and this time it is Bitcoin's turn to test.
Patterns, fundamentals, technicals, and all indicators and oscillators confirm this scenario, so let's remain unbiased.

Analytics: market outlook and forecasts
WHAT HAPPENED?
Last week, we continued the upward movement to the next selling zone. After reaching it, the market moved sideways, forming a pivot point at $ 90,000. We expected a reaction and continued purchases to the next zone, but a less likely and more negative scenario worked out.
Today, at the opening of trading, an active seller increased the pressure, which led to a breakdown of the lower consolidation boundary. The context abruptly changed to a top-down one. The decline stopped in the local buying zone of $88,000-$86,000. At the same time, all volumes from below are absorbed by limit orders, and the reaction of buyers doesn't give grounds to expect a rapid recovery in growth.
WHAT WILL HAPPEN: OR NOT?
The base scenario is a correction to the zone of volume anomalies of $84,000-$82,000. Increased protection can be expected from this area. However, if the selling pressure persists, resistance may already appear at the levels of $86,000-$88,000.
If protection doesn't appear, the week will turn out to be bearish again, and the decline will continue at least to the level of $ 74,500.
Buy Zones
$84,000–$82,000 (volume anomalies)
Sell Zones
$89,800–$90,800 (cluster anomalies, mirror zone)
$94,000–$97,500 (volume zone)
$101,000–$104,000 (accumulated volumes)
$105,800–$106,600 (local resistance)
IMPORTANT DATES
We're following these macroeconomic developments:
• Monday, December 1, 14:45 (UTC) — the publication of the index of business activity in the US manufacturing sector for November;
• Monday, December 1, 15:00 (UTC) — publication of the US manufacturing price index for November;
• Tuesday, December 2, 1:00 a.m. (UTC) — speech by Fed Chairman Jerome Powell;
• Tuesday, December 2, 10:00 a.m. (UTC) — publication of the European Consumer Price Index for November;
• Tuesday, December 2, 15:00 (UTC) — publication of the number of open vacancies in the labor market (JOLTS) USA for September;
• Wednesday, December 3, 13:15 (UTC) — publication of changes in the number of people employed in the US non-agricultural sector in November;
• Wednesday, December 3, 14:45 (UTC) — publication of the index of business activity in the US services sector for November;
• Wednesday, December 3, 15:00 (UTC) — publication of the index of business activity and the index of prices in the non-manufacturing sector of the USA for November;
• Thursday, December 4, 13:30 (UTC) — publication of the number of initial applications for US unemployment benefits for the week;
Friday, December 5, 15:00 (UTC) — publication of the basic price index of US personal consumption expenditures for September.
*This post is not financial recommendation. Make decisions based on your own experience.
#analytics


Bitcoin prediction 2022,End of Feb we expect market reversal The end of February we expect reversal of down trend market movement(Head and shoulder reversal pattern expected) after series of down fall from $69K ATH(All time high). Follow the chart clearly to learn what i saw before market reversal.

Bitcoin to hit $32K($32000) level Feb 2022Bitcoin is expected to reach $32,000 level to finishing Head and shoulder pattern .

Bitcoin prediction 2022, BTC Temporary pullback to $36,000 Bitcoin temporary pullback to $36,000 level or beyond if sellers dominate.


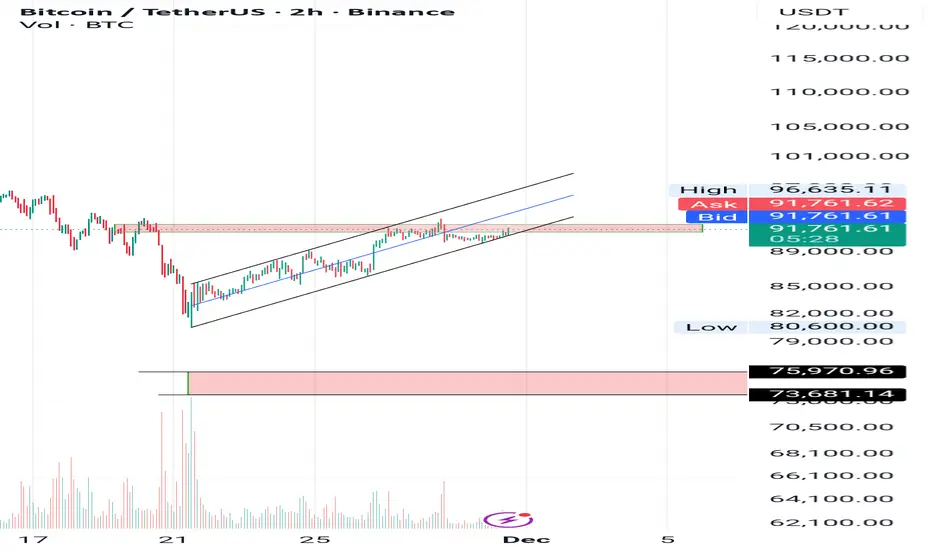
BTCUSD Prediction November 2025I,m on buy position on BTCUSD since it hit support,opened a day with bullish bias ,Volume tool support it too .

Bearish on BTCBTC next target 75k-73k
Today is the close of November and its Red so the DEC will be Also Red with target maybe till 69k previous TOP
BTC USDT continuationThis is a new setup and possibility in conjunction with the previous one that might be of help to some, please leave comments and ideas!!!! Best of luck to all

BTC Quick Outlook 2026As long as Bitcoin trades below 100K, downside pressure dominates. There’s roughly a 55% chance of dropping to 78–76K and about a 30% chance of a deeper fall to 70–66K. If these drops occur, the typical rebound target is 92–100K, and only a solid daily close above 100K opens the path toward 108–112K and potentially 116–124K. If price climbs without a deeper correction, the realistic ceiling remains 108–112K, with a stronger scenario reaching 116–124K.

BTCBTC is in an important resistance area if the resistance area at 94 is broken but I would prefer it to go past 97 to be safer and I think it will go up to test the area 109...110 for the moment. After that we have an important resistance area at 117.....119 .// if it breaks this area I think we will have a historical maximum

Bitcoin prediction 2025-NovBitcoin price has a motive to buy and it's now retraced to a bullish order block as way of correcting price with same Bullish bias from earlier trade call.

BTC: Continue Going LongThe strategy of continuing to go long on BTC is generating consistent profits. Levels below 90K present the optimal buying opportunity. Next week, BTC is expected to reach 100K—let’s wait and see, and get ready to lock in profits.
I will send out accurate trading signals as soon as the market opens next week. Don’t miss out.

BTC: Continue to Go LongBTC has now broken through the $90K resistance level, and it is only a matter of time before it surges past $100K. Continuing to go long remains the only correct choice.
I send out accurate signals every day after the market opens, so don’t miss out.

Forex Market Analysis1. Understanding Forex Market Dynamics
Before diving into analysis techniques, it’s essential to understand what drives currency movements. In forex, currencies trade in pairs, such as EUR/USD, USD/JPY, or GBP/INR, meaning the value of one currency is always measured against another. Their movement is influenced by:
Economic performance of countries
Interest rate differentials
Geopolitical developments
Trade balances & capital flows
Market sentiment and risk appetite
Forex is inherently complex because it reflects global financial health, investor preferences, and government policies. Hence, sound analysis helps simplify that complexity.
2. Fundamental Analysis in Forex
Fundamental analysis examines the economic, political, and social forces that impact currency values. It focuses on macroeconomic indicators and central bank policies to gauge whether a currency is undervalued or overvalued.
a. Economic Indicators
Traders closely monitor key data releases:
1. GDP (Gross Domestic Product)
A growing economy strengthens its currency because foreign investors move capital into that country.
2. Inflation (CPI & PPI)
Moderate inflation is healthy, but high inflation typically weakens a currency. However, higher inflation may force central banks to raise interest rates, supporting the currency.
3. Employment Data
The U.S. Non-Farm Payrolls (NFP) is the most watched employment report globally. Strong job growth boosts currency strength.
4. Retail Sales & Consumer Confidence
Consumer-driven economies like the U.S. and Eurozone react significantly to spending data.
5. Trade Balance
A country with higher exports than imports (trade surplus) usually sees its currency appreciate as foreign buyers demand that currency.
b. Central Bank Policies
Central banks like the Federal Reserve (Fed), the European Central Bank (ECB), and the Reserve Bank of India (RBI) have enormous influence on forex markets.
Interest Rates
Higher interest rates attract foreign capital, increasing demand for the currency.
Monetary Policy Statements
Statements about inflation, economic growth, or recession potential can cause major volatility, even without actual rate changes.
Quantitative Easing (QE) or Tightening
QE usually weakens a currency; tightening strengthens it.
For example:
Fed Rate Hikes → USD strengthens
ECB dovish signals → EUR weakens
c. Geopolitical Events
Political uncertainty can cause currency depreciation:
Elections
Trade wars
International conflicts
Government instability
Investors often move to safe-haven currencies like USD, CHF, and JPY during uncertain times.
3. Technical Analysis in Forex
Technical analysis studies price charts, historical data, and market patterns to forecast future currency movements. Unlike stock markets, forex markets are highly liquid and more technical in nature, making chart analysis extremely effective.
a. Price Charts
Common chart types:
Candlestick charts (most popular)
Line charts
Bar charts
Candlesticks offer information about market psychology through patterns like:
Bullish engulfing
Doji
Hammer
Shooting star
These patterns help traders identify reversals and continuations.
b. Trend Analysis
Identifying market direction is central to technical analysis:
Uptrend: Higher highs, higher lows
Downtrend: Lower highs, lower lows
Sideways trend: Ranging market
Trendlines, channels, and moving averages help determine momentum and potential breakout points.
c. Technical Indicators
Key indicators used in forex trading include:
1. Moving Averages (MA & EMA)
Used for trend direction and dynamic support/resistance.
50-day and 200-day EMA crosses often signal major trend shifts.
2. RSI (Relative Strength Index)
Measures overbought (>70) and oversold (<30) conditions.
3. MACD (Moving Average Convergence Divergence)
Tracks momentum and helps identify trend reversals.
4. Bollinger Bands
Indicate price volatility; when bands contract, breakouts usually follow.
5. Fibonacci Retracement
Used to identify pullback levels and continuation zones during trends.
d. Chart Patterns
Forex traders heavily rely on chart structures:
Reversal Patterns
Head and shoulders
Double top and bottom
Inverse head and shoulders
Continuation Patterns
Triangles (ascending, descending, symmetrical)
Flags and pennants
Rectangles
Chart patterns help predict price breakout direction and potential targets.
4. Sentiment Analysis
Sentiment analysis captures how traders feel about a currency pair. It reflects crowd psychology and risk appetite.
a. Risk-On vs Risk-Off Behavior
Risk-On: Investors buy higher-yield or riskier currencies (AUD, NZD, emerging markets).
Risk-Off: Investors move to safe-haven currencies (USD, JPY, CHF).
b. Commitment of Traders (COT Report)
Published weekly by the CFTC in the U.S., it shows how institutional traders are positioned—long or short—on major currencies.
c. Market News & Headlines
Breaking news immediately shifts sentiment:
Natural disasters
Political announcements
Sudden policy changes
Sentiment often triggers short-term volatility, even if fundamentals remain stable.
5. Intermarket Analysis in Forex
Currencies are deeply connected to other asset classes:
a. Bonds and Interest Rates
Bond yields strongly influence currencies.
Higher yields → stronger currency.
b. Commodities
Some currencies move with commodities:
CAD with crude oil
AUD with gold and minerals
c. Stock Markets
Strong equity markets attract foreign investment, supporting the domestic currency.
6. Developing a Forex Analysis Strategy
Successful forex traders integrate all three analysis types:
1. Fundamental View
Understand the economic backdrop and long-term direction.
2. Technical Setup
Find entry and exit points using charts, patterns, and indicators.
3. Sentiment Confirmation
Assess whether market mood supports the trade idea.
Example:
If fundamentals signal strong USD,
Technical charts show bullish breakout on USD/INR,
Sentiment moves “Risk-Off”,
→ A long position is valid.
7. Practical Tools for Forex Analysis
1. Economic Calendars
Track upcoming news releases.
2. TradingView & MetaTrader Charts
For chart analysis and indicators.
3. Forex News Platforms
Bloomberg, Reuters, and central bank websites.
4. Volatility Indicators
ATR and VIX (indirectly) help assess risk levels.
8. Importance of Risk Management in Analysis
Even perfect analysis fails without risk control. Forex is highly leveraged; thus:
Always use stop-loss
Avoid over-leveraging
Diversify trades
Respect market volatility
Keep emotions in check
Risk management ensures long-term survival despite inevitable losses.
Conclusion
Forex market analysis is a powerful framework that combines economic understanding, technical expertise, and sentiment reading to interpret currency movements. As the world’s most liquid market, forex responds instantly to global developments, requiring traders to be informed, agile, and analytical. The best results come from blending fundamental views with technical setups and sentiment signals, along with disciplined risk management. With consistent practice and a structured approach, traders can navigate forex markets more confidently and effectively.