Bitcoin at Extreme Discount , Hidden Bull Signal AppearsBTC has now reached a major extreme discount zone, completing a deep retracement into one of the strongest demand regions on the chart. This level aligns perfectly with key Fibonacci supports, making it a high-value area from a technical perspective.
Price has tapped the 0.618 – 0.786 Fibonacci cluster, which historically provides strong reactions during corrective phases. Combined with a clearly defined demand block, this forms a confluence that often marks the end of a corrective leg rather than the beginning of a deeper breakdown.
At the same time, the RSI is showing a hidden bullish divergence, where price makes a higher low while RSI makes a lower low. This pattern typically appears during continuation setups and suggests that underlying bullish strength may be returning despite the aggressive downside move.
These elements together create a scenario where the market is positioned in a high-probability reaction zone. As long as BTC holds above the key demand structure, the technicals support the idea of an upward continuation forming from here.
Key Technical Highlights:
• Strong confluence between the 0.618 – 0.786 Fibs
• Price is inside a major discount demand zone
• RSI showing hidden bullish divergence (continuation signal)
• Structure still supportive of an upside bounce as long as demand holds
• Market conditions resemble previous early-reversal zones
In simple terms: BTC is sitting inside a major discount area, touching the strongest Fibonacci supports, and RSI is flashing a hidden bullish signal. If this zone holds, it may mark the beginning of a recovery phase.
Trade ideas
BTC – Inside Monday’s Range During a Holiday WeekWe are currently trading inside the Monday range, and given the holiday conditions, price action is likely to stay contained.
🎯 Base case:
Trading the range until it breaks makes the most sense.
With the bullish opening of the day and 0.5 retracement of the range holding, the most probable scenario is a sweep of Monday’s high.
However, once Monday high is taken, we also have resistance there. If we get a bearish daily open afterward, I would look for shorts.
These remain the highest-probability plays for me.
If we get a strong bullish close after taking Monday high AND hold above TWO, then something may be shifting. Until then, I’m keeping decisions strictly based on the scenarios above.

SELL NOW BTCUSD!!BTCUSDT completed +2,000pips from my sell limit order on recent post on btc today we have trend continuation zone looking at price to made a sharp rejections off this poi to 80k......

Bitcoin – Approaching Key Resistance at 90,000Since the recent drop, Bitcoin has been forming higher highs (HH) and higher lows (HL), showing a solid 8–10% recovery. This structure suggests buyers are regaining control, but now price is approaching a major test.
The next key level is the 90,000 resistance zone:
Bullish Scenario:
If BTC breaks above 90,000, momentum could accelerate as more traders add longs. This would open the door for a clean move back toward the 95,000 level.
Bearish Scenario:
If price fails to break 90,000, a rejection would likely send BTC back to the 85,000 support zone.
If 85,000 does not hold, the next liquidity levels lie at 83,000–81,000.
Overall, Bitcoin is recovering well, but the 90,000 level will determine whether the rally continues or a deeper correction begins.
BINANCE:BTCUSDT

BTC Bullish with Compression RiskBTC/USD – Intraday Institutional Analysis (Athena Protocol v7.3)
Exchange: Binance
Current Price: ~87,602
Current Time: 01:42 UTC-5
Timeframe Provided: 90m
1. Market Bias: Mild Bullish (with compression risk)
Basis for Bias
Goldbach Levels
– Price is hovering above the 6561 PO3 midline cluster.
– Algo-1 and Algo-2 at the nearest PO3 levels show BR → FV and OB → RB, suggesting bullish rotation but not explosive.
– The 27 & 81 PO3 rows in particular show bullish recovery patterns (-RB, FV, -OB).
Volume Profile
– Visible Range POC at ~86.9K has acted as a magnet but is now acting as soft support.
– Large high-volume node at 87.3K–87.6K indicates acceptance.
– Low volume inefficiency above 88.1K → potential bullish magnet if reclaimed.
Session Volume Profile
– Multiple sessions printing higher value area lows.
– Current sessions building value slightly higher, showing slow accumulation.
CVD
– CVD is rising subtly while price is flat → hidden absorption from buyers.
– No aggressive delta imbalance but enough to indicate demand.
COT Data
Week-on-week:
– Longs +364, Shorts –292 → net +452 (bullish shift).
– Shorts remain dominant, but decreasing for two weeks straight.
– This implies shorts are covering, enabling upside expansions.
Macro Catalyst Snapshot
– FOMC members remain cautious but no new aggressively hawkish pressures.
– Trump’s recent energy-dominant policy talk lifted risk appetite.
– Crypto sentiment neutral-positive after ETF inflows resumed.
________________________________________
2. Strategic Interpretation
BTC is in a compression box between 87.0K and 88.3K.
This is classic ICT accumulation before a displacement move.
– CVD supports bullish continuation.
– COT supports longer-term bullish shift.
– Volume profile shows inefficiencies ABOVE.
– Goldbach models show bullish rotation signals.
Bias: BUY only.
(Shorting here is asking to get executed like a liquidity piñata.)
________________________________________
3. Smart Money Trade Levels
A. Aggressive Buy Limit
Entry: 87,180 – 87,260
SL: 86,720
TP1: 87,950
TP2: 88,430
TP3: 89,200
Rationale:
– This sits on the upper boundary of the prior session POC.
– CVD support forming beneath this.
– Micro liquidity resting just below — offers a perfect “tap and go” level.
Win Probability: ~63%
High RR but exposed to fakeouts.
________________________________________
B. Conservative Buy Limit
Entry: 86,880 – 87,000
SL: 86,450
TP1: 87,600
TP2: 88,300
TP3: 89,600
Rationale:
– This is exactly at the major visible range POC.
– The strongest structural support on your chart.
– Aligns with Goldbach PO3 cluster (6561 row).
– Offers best protection vs liquidity raids.
Win Probability: ~71%
This is your safest actionable play for today.
C. Very Safe Buy Limit
Entry: 86,150 – 86,300
SL: 85,650
TP1: 87,200
TP2: 88,000
TP3: 89,300
Rationale:
– Deep liquidity pool + LVN pocket.
– Would clear out all stop clusters under current structure.
– Perfect institutional “grab then go”.
– Best RR but may not fill if BTC squeezes early.
Win Probability: ~78%
Highest probability if filled, lowest chance of getting filled.
4. Why These Playbooks Work
Technical Confluence
– CVD hidden divergence suggests absorption, not distribution.
– COT shows large players reducing shorts.
– Visible range profile showing thick demand under price.
– Session profiles creeping upward = accumulation.
– Goldbach Algos show bullish rotation at multiple PO3 zones.
Macro Confluence
– No major bearish catalyst on deck.
– ETF flows return → structurally bullish.
– Market building risk appetite post-FOMC stability.
5. Optimal Execution Window
– London Open → NY AM Session (8:30–11:00 EST).
– Avoid late NY and Asia except for limit-fill traps.
BTC right now is like a bodybuilder doing a slow inhale before the deadlift—everything is coiled, tense, and seconds away from a directional explosion.
Just don’t be the guy shorting the deadlift bar. They always get flattened.
This report is educational, not financial advice.

BTC ShortNice short opportunity in BTC. Targets on the charts. As there is no volume, we hope this can happen. DYOR

BTC: Buyer Zone Holds the PressureDaily buyer zone shows a successful test; 2H chart points to active buyer initiative with a target at 88,519.
This analysis is based on the Initiative Analysis (IA) method.
Hello, traders and investors!
On the daily timeframe, a buyer zone has formed at the end of the seller initiative. Yesterday, this buyer zone was tested by a seller bar on declining volume, which looks more like a test rather than active selling.
On the 2-hour timeframe, we have a sideways range with an active buyer initiative, and the nearest target is 88,519.
Yesterday, the seller attempted to push the price lower on increased volume, but the move stalled within the key volume area (87,000–86,000) of the daily buyer candle — the candle that formed the buyer zone on the daily chart.
Wishing you profitable trades!

BTCUSDT.P - November 26, 2025Bitcoin is consolidating in a choppy range after early gains, with price repeatedly testing support at 86,547 and resistance around 88,200. A breakout above the upper boundary signals momentum toward the next major resistance at 91,882, while failure to hold current support risks a push to the stop level near 83,866. The current price action reflects indecision, as neither bulls nor bears control trend structure. Technicals suggest trend confirmation will depend on a decisive move away from the 86,547–88,200 range.

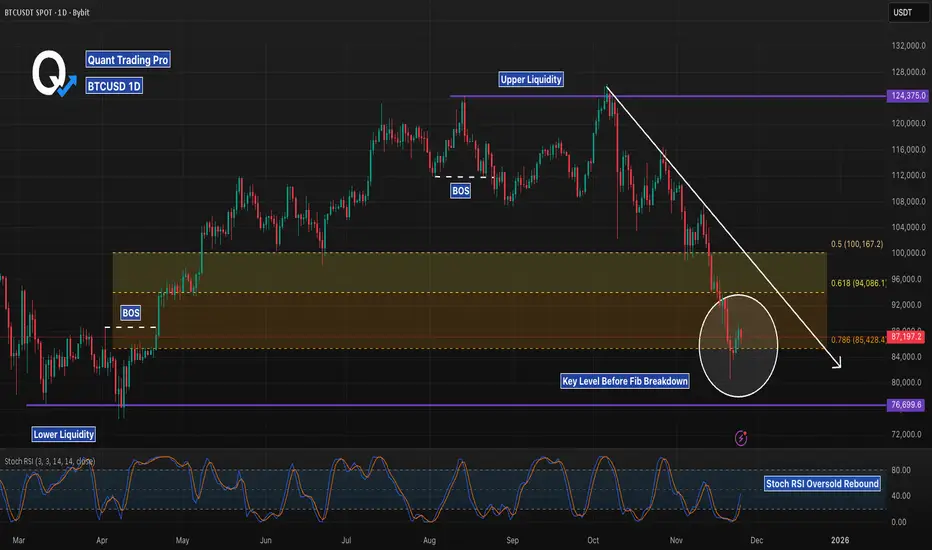
BTCUSD 1D – Testing 0.786 Support, But Is This a Real Reversal?Bitcoin has returned to a major higher-timeframe decision point: the 0.786 Fibonacci retracement, sitting inside a broad demand block that has already produced one sharp wick rejection. This zone combines three powerful confluences — a deep pullback level, prior accumulation structure, and proximity to sweeping lower liquidity from earlier this year.
Price broke structure twice on the way down, showing clear bearish momentum, but the current candle cluster suggests sellers are slowing as demand attempts to step in. A reclaim of the 0.618–0.65 range would signal strength and open the door for a revisit toward the mid-range around 100K. Failure to hold the 0.786, however, exposes the untested liquidity zone near 76.7K — a level that aligns with previous liquidity sweeps.
Stoch RSI is attempting a rebound from oversold territory, hinting at a possible short-term bounce, but trend context remains bearish until a confirmed BOS to the upside forms.
This is a pivotal zone for BTC — the next few daily candles will determine whether this is a macro higher-low or the beginning of a deeper breakdown.

Long btcAfter recording a new low, Bitcoin can now follow wave B after making its corrective wave C to the specified Fibo ranges.

Bitcoin’s Overshoot Zone: Panic, Patience or Both?Bitcoin didn’t crash.It unwound.
Not with one dramatic candle — but through weeks of slow bleed, where every bounce gave hope and every rejection drained it further.And now price sits in a place most people don’t know how to act in:
The Overshoot Zone.
.......................................................................................................
This isn’t a buy zone. It’s a psychology zone.
Price has travelled from mid structure all the way down into the extreme −125% to −150% Projection Range.
This zone isn’t about calling bottoms.It’s about watching behavior.
Historically, this area attracts two types of players:
Those leaving out of exhaustion
Those entering with patience
The problem is — you can’t tell which side is winning until the structure changes.And that’s where most traders lose emotional control.
............................................................................................................
What the channel is telling us -
This wasn’t random selling.Price followed a clean descending channel for weeks.
Every recovery stalled at the channel top.Every bounce turned into distribution.
But now there’s a shift:
Momentum is slowing.
The slope is flattening.
Candles are compressing.
This isn’t strength yet — but it is a change of energy.And energy always changes before structure does.
...............................................................................................
Why this zone matters psychologically? Most retail psychology moves like this:
Hope
Confusion
Frustration
Capitulation
Numbness
The Overshoot Zone usually lives between stage 4 and 5.
Where:
Fear gets quieter
Volume spikes or dries
Everyone starts waiting instead of reacting
Not because price reversed but because most participants are simply exhausted.
.....................................................................
What to observe instead of predict
• If price stabilizes in this band → it’s not bullish, it’s absorption.
• If price expands below it → it’s not weakness, it’s unfinished fear.
Either way, this zone isn’t for excitement. It’s for observation.
..............................................................................................
Chart structure presented using Projection Levels + NeuroPolynomial Channel.
These are structural frameworks, not prediction tools.
..............................................................................................
#BTC #Bitcoin #BTCUSDT #MarketPsychology #PriceAction #CryptoTrading

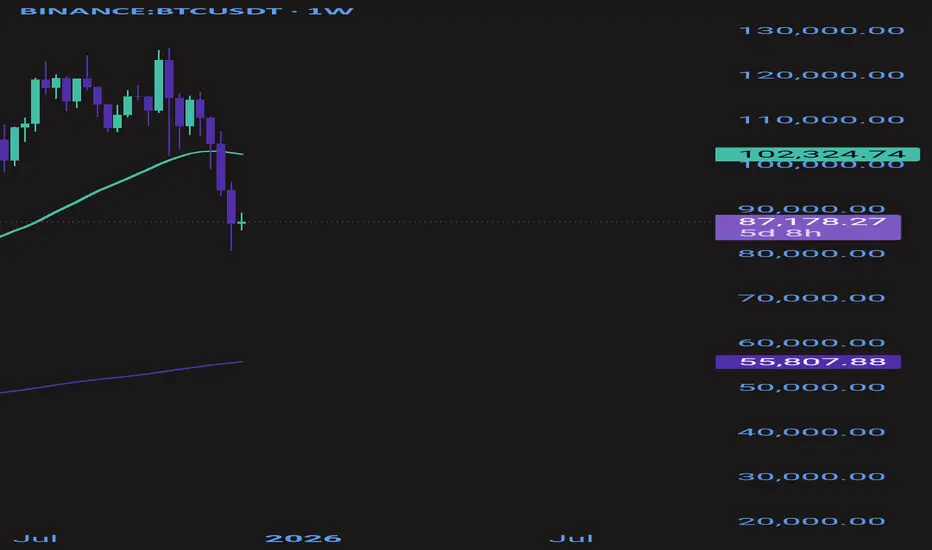
BTC update
If BTC breaks the red line, it would fall to the second one. Lets see how BTC reacts at the 50% level if it can get there. Worse case I think it may be down to around the purple line level.

$BTC Range Bound Market UpdateAfter the great sell-off this month, CRYPTOCAP:BTC entered a rangebound environment - Range high (88,400) and Range Low (80600).
It is expected that the market will remain rangebound unless a solid break occurs from either RH or RL.
LTF Trade plans:
1) Sweep of Q2 VAL, Monday's low, and previous week VAL @ 84600 isa long scalp opportunity.
2) Break below previous week VAL @84600, Scalp short towards 82,300
3) Sweep of RL (80600) Coinciding with pyVAH is a trigger for swing long.

BTC: Target 120KBTC is still consolidating, but there have been clear signs of a bottoming-out. Any level below 90K is a good buying opportunity – let’s wait for the first target of 120K!
I’ll send the signal right away as soon as the market opens every day, don’t miss out!

BTC: About to rally!The downtrend for BTC is officially over – it’s gonna keep surging next! Right now’s the absolute best buying opportunity in the market.
I’m calling 83000 as the bottom of this pullback. I’ll keep firing off accurate signals, so don’t miss out on cashing in!

Bitcoin Mining vs. GPU Mining: What Powers AI and What Doesn’tIn crypto mining, Bitcoin mining power relies on specialized ASICs that can't be repurposed for AI tasks. However, GPU-based mining rigs used mostly for altcoins like Ravencoin, Ethereum Classic, Flux, Monero, and Vertcoin can be converted to AI compute power due to GPUs’ versatility in parallel processing.
This distinction is key: Bitcoin mining isn’t done with GPUs, so its computing power doesn’t transfer to AI workloads. Meanwhile, many GPU mining farms are pivoting to AI data centers, leveraging their hardware more flexibly for high-demand AI processing.
“BTC Pressure Point – Rising Channel Losing Steam ”🌊 BTC Channel Watch – Trendline Under Pressure 🏄♂️📉
BTC’s flow is pretty straightforward right now. Price has been climbing inside that small ascending channel, but today it’s leaning hard against the lower trendline — and the candles look tired. No strength, no conviction, just soft taps drifting downward 🌬️.
Above us, the 90K block is still the major supply zone. Every time price even peeks at that area, sellers show up instantly. It’s a ceiling that hasn’t cracked once, and BTC isn’t even close to giving it another test yet 🧱🚫.
If this rising channel breaks down — and honestly, structure already looks weak — we could see a clean continuation lower. There’s no strong demand pocket sitting in between, just open space for price to glide down smoothly 📉🌊.
So right now I’m focused on how BTC behaves around this trendline:
👉 If bulls defend it with real momentum, we may get another push inside the channel.
👉 If not, the next wave looks aimed lower — the red curve on the chart basically shows the flow 🔻.
Not predicting, not trying to force the market. Just reading structure, staying patient, and letting the waves speak for themselves 🏄♂️🌬️.
💬 What do you think about this scenario? Only share your idea if you’ve got another opinion — otherwise just hit that button 👍
#BTC #Bitcoin #Crypto #Trading #TechnicalAnalysis

BITCOIN:LIVE TRADEHello friends
considering the decline we had, the sellers made a bottom and the buyers came in. The sellers again broke the previous bottom with strength and made a bottom, and the buyers came in and raised the price and succeeded in hitting a higher ceiling.
And in the pullback, the open price is supported and here we can enter a buy transaction considering the support of buyers and hitting a higher ceiling, of course with risk and capital management and be careful not to make emotional decisions.
*Trade safely with us*

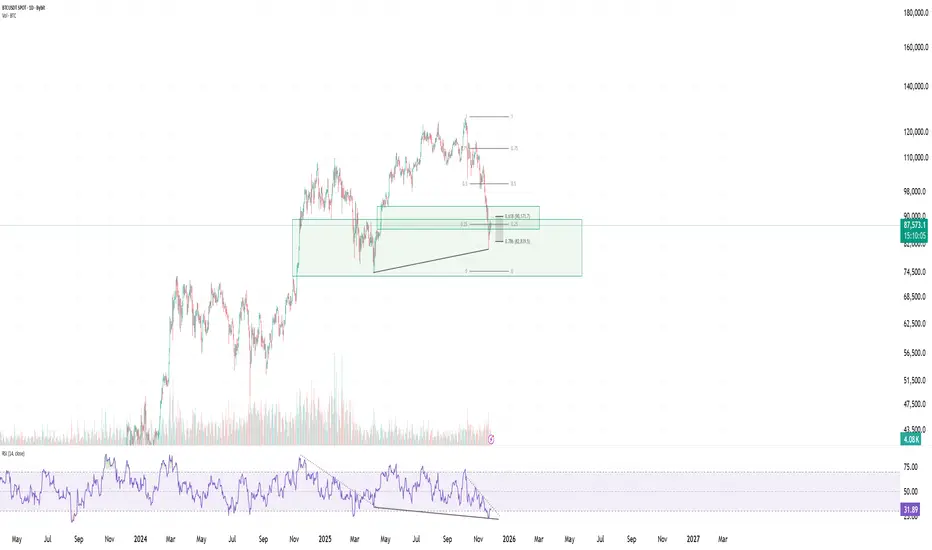
BTC 2025 Roadmap + BTC/Gold Ratio OutlookBTC Chart Idea (until end of 2025)
The setup shown with the blue arrow remains my base scenario through year-end.
I expect a move down to the 72k zone this year. Before that drop, price can either push first to ~99k (this year’s equilibrium) or head straight to 72k. Once we tag 72k – which is last year’s equilibrium level – I see that as the major low, from where the next impulsive leg toward 140k should begin.
BTCUSD/XAUUSD ratio
Current ratio is sitting around 21. I’m looking for a pullback toward 16. It can go 25 first and then 16, or drop directly to 16. I don’t expect 16 to hold as a long-term low; the reaction from there should target 25 again as the most probable level, with room for even higher readings beyond that.

My BTC BiasBitcoin is still in a heavy downtrend.
The small uptrend was just do it can reach premium of the created range.
Take profit is annotated in video and is likely to occur based on what I have observed.
Not financial advice. Just an opinion.

BTC/USDT Analysis. Moving Within the Expected Scenario
Hello everyone! CryptoRobotics trader-analyst here, and this is your daily market update.
Yesterday, Bitcoin continued its local uptrend. The movement remains mostly momentum-driven, but despite the lack of strong buying pressure, the price can still reach the first resistance zone we highlighted, as long as it consolidates above $88,000. During the last local pullback, we recorded a clear absorption of selling — this pattern is likely to play out if buyers become slightly more active.
From a mid-term perspective, the scenario remains the same: after testing the nearest resistance zones, we expect another wave of selling. A reaction from support would provide a more reliable setup for long positions with potential targets at $95,000–$100,000.
Buying Zones:
• $84,000–$82,000 (volume anomalies)
Selling Zones:
• $90,000–$92,300 (high-volume zone)
• $94,000–$97,500 (high-volume zone)
• $101,000–$104,000 (accumulated volume)
• $105,800–$106,600 (local resistance)
This publication is not financial advice.

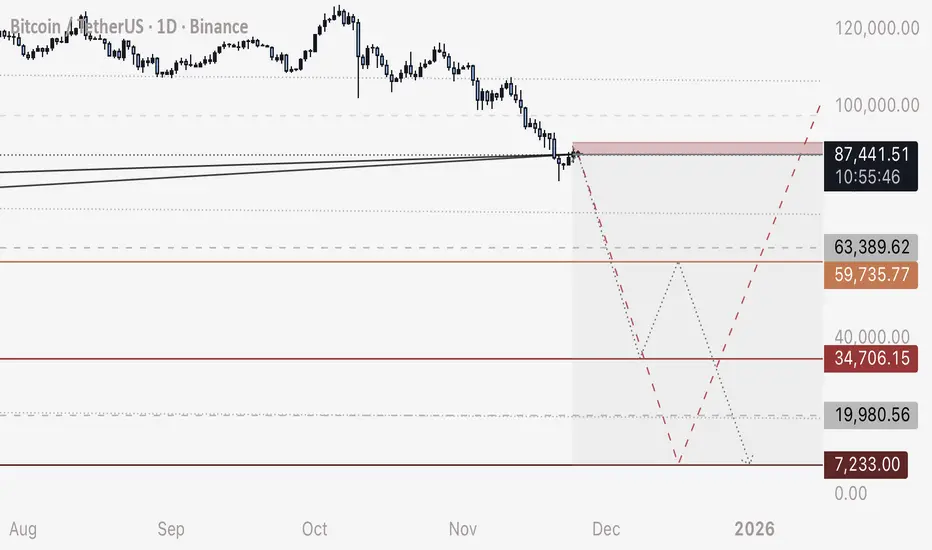
BTC - Short Update - Next Three MovesAs an update to my BITCOIN short plan, here are my next three expected moves / trades:
1. SHORT
Entry - 87,500-87,800
Stop Loss - 89,700
Target - 38,000 (exact wick bottom expected 34,700)
2. LONG
Entry - 34,800 to 35,500
Stop Loss - 33,000
Target - 55,000
3. SHORT
Entry - 58,500 to 59,500
Stop Loss - 64,000
Target - 10,000
Happy Trading
- DD