BTC/USD) Ready for drop Read The captionSMC Trading point update
Technical analysis of Bitcoin (BTC/USDT) on the 4H timeframe.
---
Technical Breakdown – Bitcoin (4H)
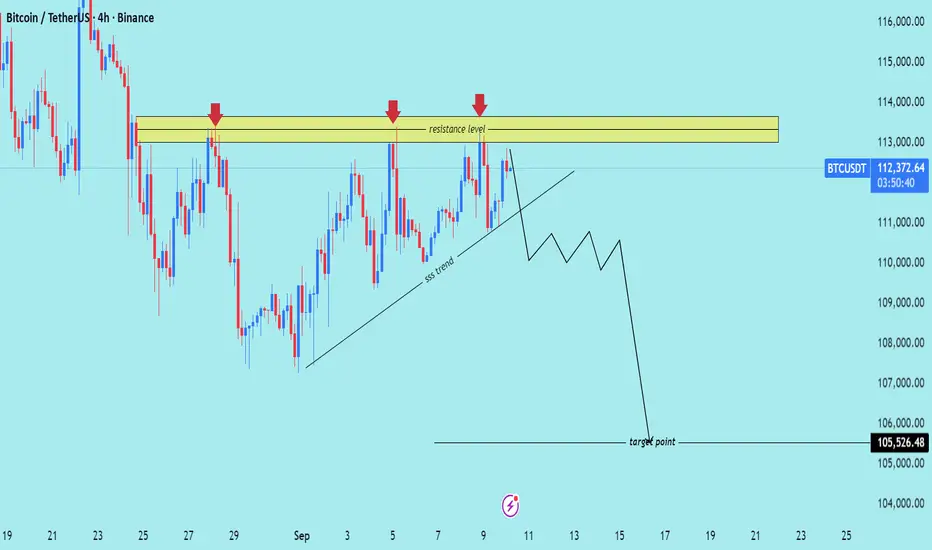
1. Resistance Zone
Strong resistance level between $113,000 – $114,000 (highlighted yellow).
Price has tested this zone three times (red arrows), showing clear seller strength and liquidity rejection.
2. Structure Trendline
Market is following a short-term ascending support trendline.
Current projection suggests this trendline may break, which would signal a shift in momentum to bearish.
3. Bearish Outlook
If resistance continues to hold, a trendline breakdown could trigger strong downside momentum.
Target Point: $105,526.48 – a major demand zone where liquidity sits.
4. Trading Plan Idea
Entry: On rejection at $113K–$114K zone or confirmation of trendline break.
Stop Loss: Above $114,500 (to protect from false breakouts).
Take Profit: $105,526.48
---
Summary
Bias: Bearish
Reason: Multiple resistance rejections + trendline vulnerability.
Setup: Look for shorts from resistance or after trendline break → Target $105.5K zone.
Mr SMC Trading point
---
This setup is a classic SMC bearish scenario: liquidity trapped at resistance → trendline break → expansion down to collect liquidity at lower demand.
Please support boost 🚀 this analysis
BTCUST trade ideas
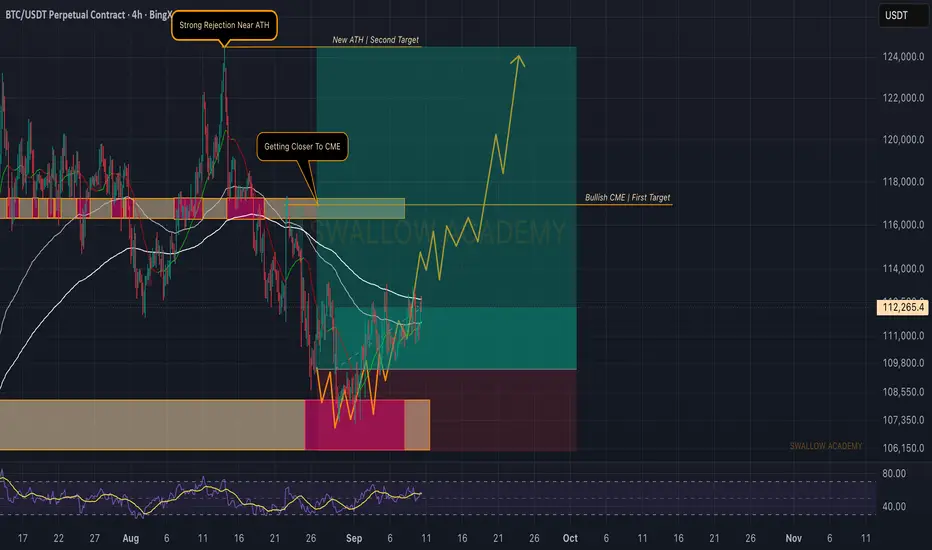
Bitcoin (BTC): Waiting For That Breakout of 200EMABTC still remains below the 200EMA, where we’ve now seen the third touch of that zone. Buyers continue to keep the pressure.
We keep waiting for the breakout — major target stays the same at the bullish CME gap near $116K–117K.
Swallow Academy
BTC fails to hold $110,000 - down!
Lightning bolt pattern! ⚡️⚡️⚡️
Bitcoin's break below $110,000 on heavy volume could pull the price back to the $107,270 support level.
Failure to hold above $110,000, especially on increased volume, and an hourly close below $110,300 would signal a drop towards $109,000 and a potential retest of the $107,270 support level. Oscillator signals are mixed, and continued resistance at the medium-term moving averages exacerbates the bearish risk.

TradeCityPro | Bitcoin Daily Analysis #172👋 Welcome to TradersCity Pro!
Let’s move on to Bitcoin analysis. Yesterday, one of the triggers we had for a long position was activated. Let’s see which direction the market moves today and what other triggers we have.
⌛️ 1-hour timeframe
The trigger we had yesterday at the 111654 zone was activated, and good buying volume entered the market. The price is now moving toward the 113233 level.
✔️ If you opened a position with yesterday’s trigger, you can secure your profits when the price reaches 113233. A breakout of 113233 itself can also be the next trigger for another long position.
📊 If the volume does not decrease and continues to rise, the likelihood of this upward move continuing is much higher, and a new leg in higher cycles could form.
✨ However, if this upward move turns out to be fake and the price stabilizes below 111654, the probability of short triggers being activated and the start of a bearish wave increases significantly.
🎲 In that case, with a break of the 110473 zone, we can open a short position. These setups are among the trades that are better to open with a small stop-loss and low risk, so they can reach the target more quickly, and if stopped out, we won’t face a big loss.
❌ Disclaimer ❌
Trading futures is highly risky and dangerous. If you're not an expert, these triggers may not be suitable for you. You should first learn risk and capital management. You can also use the educational content from this channel.
Finally, these triggers reflect my personal opinions on price action, and the market may move completely against this analysis. So, do your own research before opening any position.

BTC Accumulates and Recovers, Rate Cut Near💎 BTC PLAN UPDATE – Early Week (09/08 )
BTC Analysis (D1 timeframe)
Main trend:
BTC is in a recovery phase after breaking out of the downtrend channel (blue).
Currently, the price is hovering around 112K–113K, approaching a key resistance zone.
Key levels:
• Near resistance: 113,590 – 114,124 (confluence of Fib 0.382 and EMA 34).
• Stronger resistance: 116,150 – 117,600.
• Near support: 111,200 (Fib 0.5) and the rising trendline.
• Deeper support: 108,400 – 104,800 (previous lows + Fib 0.618–0.786).
Possible scenarios:
• Scenario 1 (preferred): Price tests resistance at 113,590 → pulls back to 111K–110K → then bounces upward again.
• Scenario 2: If strong buying pushes through 113,590 and holds above 114K, the next target will be 116K–117K.
Overall outlook:
The short-term trend is leaning towards recovery.
However, the 113K–114K resistance zone will determine whether BTC continues higher toward 116K–117K, or drops back to retest supports below 111K.
👉 In summary: BTC is recovering, but 113K–114K is the key zone. A successful breakout could open the way to 116K–117K. A rejection could bring price back to test 111K or even deeper at 108K.

Bitcoin - Bloodbath in September is here! Bitcoin below 100k?September is starting, and we know that statistically September is the most devastating month, not only for Bitcoin but also for the stock market. You probably don't want to be in a long position during this period of time if you don't like adrenaline. Re-buy in the middle of October, but let's see what is happening in the short term on Bitcoin's chart.
The price has been moving within this blue descending channel, and there is really no sign of strength from the bulls. Basically what we see on the chart is a pretty strong bear market, at least on the 4h chart. As long as this channel holds, I am bearish. There are 3 options for how to trade this channel. You can try to buy the bottom of the trendline of the channel, or the 1:1 Fib extension, or wait for a breakout of the channel. Different traders trade different opportunities. Let me know what your plan is in this situation?
The Fibonacci extension 1:1 support is at 104.583 USDT, so we could see a small bounce from this level. Now the most important question is, will Bitcoin fall below 100k in September or not? Follow me so you don't miss updates because I will predict this move if the technical analysis is bearish!
Write a comment with your altcoin and hit the like button, and I will make an analysis for you in response. Trading is not hard if you have a good coach! This is not a trade setup, as there is no stop-loss or profit target. I share my trades privately. Thank you, and I wish you successful trades!

BTCUSDT – 3 Black Crows Signal Reversal at Resistance?BTC is hovering around 110.9k after failing to break through the 111.3k–111.6k resistance zone.
The rejection was followed by a Three Black Crows pattern, which often appears near market tops or at key supply zones.
On the 45-minute chart, price is testing an ascending trendline that has been supporting the recent recovery. The EMA at 110.8k is sitting right on this same area, creating a confluence that makes this level very important in the short term.
The first area to watch on the downside is 110.1k and a break beneath that could extend the move toward 109.1k, ,
On the flip side, if bulls defend the trendline successfully, price could rebound for another test of 111.3k–111.6k, but only a breakout above that zone would flip the short-term outlook back to bullish.

Potential Head & Shoulder for BTCUSDTBTC formed a reverse head & shoulder pattern at the demand zone, price breakout of descending trendline, quite bullish here.
Long here around 113k and stoploss under the right shoulder. Target 117k - 123k and above

BTC 1H Analysis - Key Triggers Ahead | Day 39😃 Hey , how's it going ? Come over here — Satoshi got something for you!
⏰ We’re analyzing BTC on the 1-Hour timeframe.
👀 On the 1H timeframe for Bitcoin, we can see that BTC has been ranging since yesterday’s news. A breakout and confirmation above the range high or below the range low will give us a trading setup. The key levels are $114,407 on the upside and $113,528 on the downside.
Today’s hot topic is the US CPI inflation data, which is a high-impact event at the very top tier of importance.
⚙️ On the RSI, Bitcoin is moving between the 50–70 zone. A breakout beyond these values, in alignment with a price breakout, could generate strong trade entries.
🕯 Candle structure shows that green candles are getting larger with more volume, while red candles are more frequent but smaller each time—so much that the market is starting to ignore them. The range high is very critical; it could break with a whale candle or even an indecision candle right before the move. Order type matters here—whether you use a trigger order or market entry on candle open will impact the trade.
📊 On the 1H Tether dominance, we’re also seeing a range—opposite in behavior to Bitcoin—with a range high at 4.37% and low at 4.32%. With BTC’s underlying trend on the 1H still bearish, there’s a decent probability of a downside break in USDT dominance while BTC breaks the upside of its range.
📊 On the 1H BTC.D , after a strong leg down, BTC.D has dropped below the 0.618 retracement level of its previous range and failed to hold support. We might see a small bounce/retest of that area, but unless today’s CPI causes major volatility, the broader expectation remains further downside in dominance.
🔔 The CPI report could bring serious volatility today. Yesterday’s news triggered nearly $750M worth of Bitcoin buys, sparking a strong rally with only minimal compression-style pullbacks. If today’s inflation data triggers a breakout above $114,407, and we see dominance dropping at the same time, large-cap projects are likely to pump even harder than Bitcoin itself.
❤️ Disclaimer : This analysis is purely based on my personal opinion and I only trade if the stated triggers are activated .

I wonder how it's going to go |BTCUSDTthis analysis reflects only my personal views and is not financial advice. Any profit or loss from actions taken based on this content is solely your own responsibility.

Short and long play for BTCSome short term scalps to kick off the week. We seem to be ranging quite nicely in this zone, making range deviation plays appealing. Watch video for fu

Zoom out and BTC is in a downtrendIt's easy to get lost on mixed news and the YoY increase (although diminishing returns) and baby jumps over the last day or two. The big picture hasn't changed much! The trend and profit taking has weakened and the move to the bottom is very real. The S&P is held together by a few big tech companies - AI bubble - holding about 30% of the basket. This level of concentration is unprecedented. Noting that some are praying that cutting interest rates will fix the problem. The issue is way bigger! The US cannot keep this level of debt for much longer and all the cracks are showing. Historically, bad things happen in September and using PE / CAPE ratios among many other metrics, things are not looking good. BTC may go up, but not in a straight line. It still doesn't solve any real problems, increasing at a decreasing rate, and high transaction fees. Proceed with caution and this time it's not different, the only thing different is that it will drop harder! Best of luck and always do your own due diligence....

Bitcoin Correction or Trap? What’s Next for BTCBitcoin Correction or Trap? What’s Next for BTC
📊 Bitcoin Market Analysis (BTC/USDT)
🔹 Fundamental Outlook
Macro Environment
Global liquidity conditions remain a key driver for Bitcoin. With central banks signaling slower tightening and some economies leaning toward easing, risk assets like crypto gain renewed interest. This keeps institutional flows active, even amid volatility.
Investor Sentiment
Market confidence has been mixed—recent ETF inflows show strong long-term positioning, while short-term traders are exiting positions due to price uncertainty. This dual behavior creates volatility but underscores Bitcoin’s sustained appeal as a hedge against inflation and monetary instability.
Adoption & Regulation
Ongoing regulatory clarity in major regions (U.S., EU, Asia) adds both challenges and opportunities. While restrictions dampen speculative activity in some markets, clearer frameworks are encouraging institutional adoption.
🔹 Technical Outlook
Trend Observation
The chart shows a prior bullish impulse followed by a sustained corrective phase. Momentum has clearly shifted from strong upward pressure to a controlled decline, suggesting a cycle rotation is in play.
Market Structure
Recent price action highlights break-of-structure events on the downside, reflecting that sellers temporarily dominate. However, consolidation phases are appearing, often precursors to volatility expansion.
Momentum & Volume
Declining volume on the latest drops suggests that selling pressure may be losing strength. This opens the probability for accumulation at lower price zones before the next directional move.
Possible Scenarios
Short-term weakness: Further decline is possible as the market continues to seek liquidity.
Medium-term recovery: If macro tailwinds (liquidity injections, ETF demand, weaker USD) persist, Bitcoin may reattempt a bullish cycle once accumulation is complete.

#BTCUSDTBitcoin Technical Analysis:
The next target for Bitcoin is expected to be around $147,000 (the next channel ceiling).
Dynamic resistances and supports are drawn.
Static support is around $97,000.

BTCUSDTPreferably suitable for scalping and accurate as long as you watch carefully the price action with the drawn areas.
With your likes and comments, you give me enough energy to provide the best analysis on an ongoing basis.
And if you needed any analysis that was not on the page, you can ask me with a comment or a personal message.
Enjoy Trading ;)

Oh! BTC MARKET UPDATESome short term scalps to kick off the week. We seem to be ranging quite nicely in this zone, making range deviation plays appealing. Watch video for full breakdown .


BTC/USDT – Short-Term Bearish, Medium-Term Recovery PotentialThe market is under pressure as Bitcoin lost the key $110K level, raising concerns of further selling. However, with major institutions continuing to hold over 1 million BTC, long-term confidence remains intact.
On the 12H chart:
Current price: 111,265 USDT
Near resistance: 112,300 USDT (aligned with EMA34 – 111,794 and EMA89 – 113,283)
Key support: 108,000 USDT, a level likely to provide buying interest
Main scenario:
In the short term, BTC may continue to face selling pressure, testing the 108,000 USDT support before stabilizing.
In the medium term, if this level holds, the price could rebound back toward 112,300 USDT, and potentially break out of the descending channel to the upside.
👉 Overall outlook: Short-term bearish → Neutral → Slightly bullish in the future.

Btcusd bull run Just take the trade you will see the analysis later on ...
Big bull run coming...to take out the high.
Watch it

BTC – Inverse Head & Shoulders Forming | 4H Chart#Bitcoin is currently consolidating sideways on the 4-hour timeframe, and an Inverse Head & Shoulders pattern is clearly developing. This is often considered a bullish reversal setup, especially when supported by the absence of any major bearish signals.
Key Levels to Watch:
Neckline (Major Resistance): The breakout point for bullish confirmation.
Support Zone: The shoulders are holding well, showing strong buyer interest.
Trading Plan:
Wait for a decisive breakout above the neckline with strong volume.
On the retest of the neckline, look for confirmation candles to enter a long position.
Always apply proper risk management to protect capital.
If this breakout plays out, #BTC could begin a new bullish trend, offering strong upside potential.
What do you think — will #BTC break the neckline soon, or continue ranging sideways?
Drop a like if this analysis helps you.
Share your thoughts in the comments.
Follow me for more #BTC and crypto trade ideas.
#BTC #Bitcoin #Crypto #CryptoTrading #PriceAction #TechnicalAnalysis #BTCUSD #Bullish #InverseHeadAndShoulders #TradingStrategy #SwingTrading #Breakout #4HChart #LongTrade #RiskManagement #CryptoCommunity

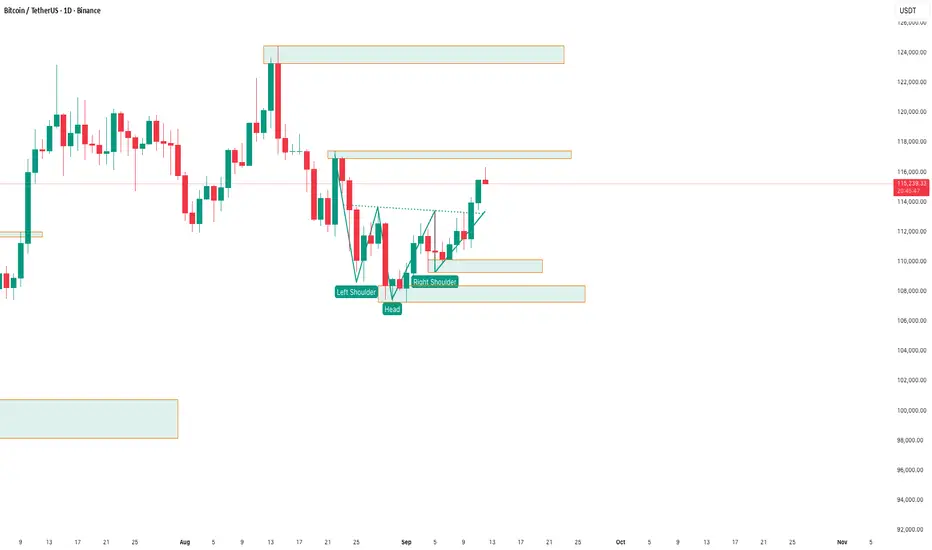
Bitcoin Daily- Inverse Head & Shoulders In Play ?BTC just formed a potential Inverse Head & Shoulders (H&S) on the daily chart 👀.
The neckline has been tested and bulls are trying to push above 🚀.
If this breakout holds, we could see momentum toward the $116K–118K zone 🔑. But if sellers step back in, it might turn into a fakeout ⚠️.
For now, price action looks like buyers are gaining confidence again 💪.
👉 Not financial advice, just sharing my view. What’s your take — breakout or fakeout? 🤔

Fib Projection Theory - BTC TOP $169,000I’ve been testing a Fibonacci projection method that I believe uncovers hidden tops before they form. The premise is simple: if Fibonacci retracement levels don’t align with price action, the move isn’t finished. By adjusting the fib “top” until levels align with historical support and resistance, we can project where the true macro top should be.
On Bitcoin’s monthly chart, this method points to an approximate top near $169,000.
⸻
The Theory: “Fib Alignment”
• Normally, Fibonacci retracements are drawn from swing low → swing high.
• But if the chosen top is not the true top, the retracement levels won’t “respect” historical pivots — price slices through or ignores them.
• By dragging the fib higher until the levels snap into alignment with prior cycle resistances and supports, the eventual swing high is revealed.
This isn’t classical fib usage. It behaves more like a hybrid between linear retracements and logarithmic fib extensions.
⸻
Bitcoin’s Current Setup
1. Fib from 2022 bottom → 124k (current high):
• 0.236, 0.382, and 0.618 do not align with key monthly levels.
• Market structure feels “off.”
2. Fib from 2022 bottom → 169k projected top:
• 0.236 (~120k) matches current resistance zone.
• 0.382 (~85k–90k) aligns with prior rejection/support.
• 0.618 (~55k–57k) = dead-on with the 2021 cycle top.
• 0.786 (~39k) = historically critical demand zone.
When extended to ~$169k, the fib levels align perfectly across the monthly structure — retroactively validating the projection.
⸻
Confluence With Log Extensions
Interestingly, this “alignment top” also corresponds with the 0.618 extension target on log-scale fibs, which many traders use as long-term take-profit levels.
In other words:
• My method (drag until aligned)
• Classical log fib extensions
…both converge around $169,000 BTC.
⸻
Implications
• If this framework holds, BTC’s current move is not complete.
• A macro cycle top around $169k is the level where Fibonacci alignment finally “snaps into place.”
• After such a top, retracements to 0.382, 0.5, and 0.618 would define the next bear market structure.
⸻
Conclusion
This “Fib Alignment Theory” is experimental, but backtesting shows creepy accuracy on multiple assets and timeframes. Bitcoin’s monthly chart strongly suggests the true macro top lies around $169,000.
If price respects this projection, the market will have validated a powerful new way to use Fibonacci — one that looks forward, not backward.
