BTC bullish harmonicsHere we have 2 bullish harmonics for BTC (doesn't look bullish does it) but these are bullish. B area is always an area to watch for signs of a pulse, just keep in mind that MMs can just pump this anytime they want, if there's a crowded trade then we know how it goes.
NFA, do your own TA and stay safe
Trade ideas

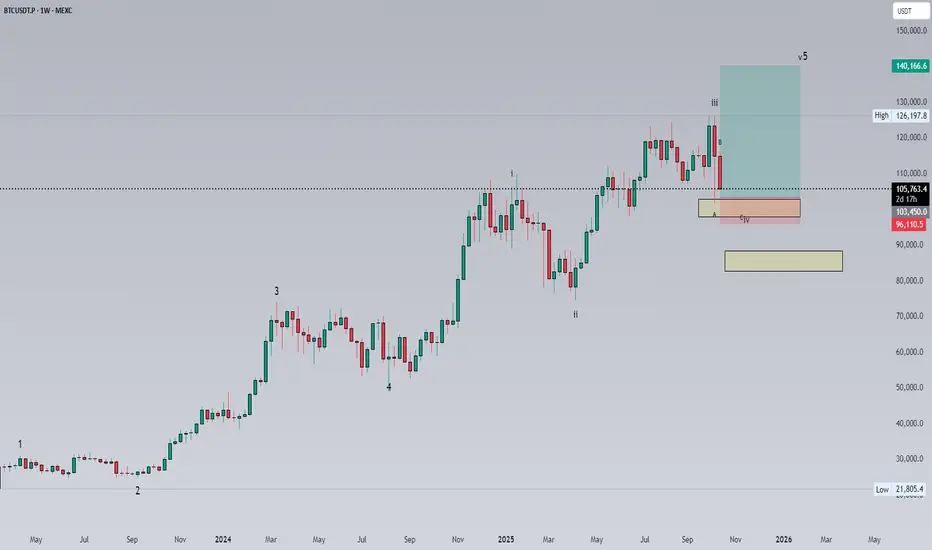
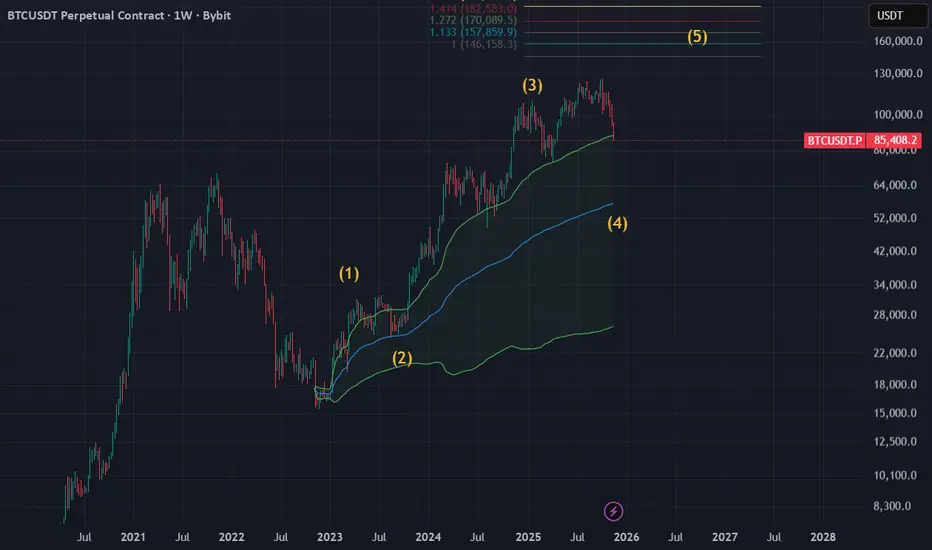
BTC/USDT – WEEKLY ANALYSIS (W1)🔵 BTC/USDT – WEEKLY ANALYSIS (W1)
Structure: Elliott Wave 5 (current wave = (4) correction)
This updated version of your chart adds Fibonacci extension targets for Wave (5), giving a much clearer projection.
1️⃣ Wave (4) Is Near Completion
Price has:
✔ Dropped sharply into the BIG Liquidity Zone (80k – 83k)
✔ Swept long-term trendline liquidity
✔ Tagged the 0.9 retrace marker (typical deep wave-4 behavior)
✔ Formed a weekly BOS during the drop
✔ Entered a historically strong demand zone
This fits perfectly with a complex corrective Wave (4).
2️⃣ Expectation: Reversal Soon
Wave (4) typically ends:
At big liquidity
At the trendline
Before violating Wave (1) territory
After a weekly BOS + wick
Your chart shows all these ingredients → a bottom is likely forming inside 80k–83k.
A bullish engulfing weekly candle here = wave (5) confirmation.
3️⃣ Wave (5) Target Zones (Fibonacci Extensions)
Your chart shows 4 major upside levels:
🎯 Target 1 — 100,757
First reaction level.
This is the 1.0 extension zone — often the first major resistance.
🎯 Target 2 — 109,998
Strong historical resistance + 1.272 extension.
Wave 5 usually passes this easily if momentum is strong.
🎯 Target 3 — 124,069
Major mid-range target.
This is where Wave 5 often pauses or makes a micro-correction.
🎯 Target 4 — 140,241 (−0.272 Fib)
This matches perfectly with standard Wave-5 overextensions.
Final upside zone before a large cycle top.
This is also the level shown at the top of your chart — very good placement.
4️⃣ Summary: BTC Weekly Outlook
✔ Wave (4) in progress but almost complete
✔ Liquidity grab is textbook
✔ Next move = impulsive Wave (5)
✔ Upside targets: 100.7k → 110k → 124k → 140k
✔ Macro trend remains strongly bullish
BTC is following nearly perfect Elliott Wave symmetry from your W1 structure.

BTC bullish shark harmonicAfter yesterdays $20 billion worth of liquidations it was time to zoom out a little.
Here I'm posting this bullish shark harmonic, yes, it doesn't look bullish considering what we witnessed yesterday and for me there was a lot of manipulation involved, directly after the CME closed we saw a massive liquidation event that not even your SL could save.
President Trump posted something on Truth Social about China holding countries to ransom for their rare earth minerals, now, we all know that Trump won't take that lying down and will obviously set tarrifs against China (at time of posting, this hasn't happened yet) once it does then we could see a further drop.
This shark harmonic is showing the way and a possible drop into the CME gap between $97k-$96k, at time of posting btc is currently at $111,770 which if given there's still a possible $15k drop to come, yesterdays liquidations saw btc dump around the same levels.....
This is only my thoughts and not financial advice
Stay safe......

BTC 74715.11 — The Capital Sector. Price Slice. 21.11.2025BTC: Two Prices the Market Hasn’t Reached — But Already Remembers.
77664.50 & 74715.11 — The Capital Sector.
77664.50 — as of publication, the price has not been reached.
74715.11 — as of publication, the price has not been reached.
Every price has its time of execution.
Do not rush.
Study my work.
Everything has only just begun.
What is the right question to ask?
Are you coming to the market for the price…
…or for the noise of indicators?
What is the correct question?
Will the market reverse — or not — at the moment of publication?
Or, even if it reverses, will the price return to it?
On which timeframe?
Something else matters.
For capital — the price exists.
It will exist.
And it is agreed upon.
This is not merely a price. It is a point of decision.
This is not a signal. It is a fingerprint.
This is not a forecast. It is the market’s memory.
My respect — to the international community.
— The Architect
P.S. English is not my native language — I offer no apologies for stylistic imperfections. What you see here is not a post. It is a demonstration of another level of preparation: the symbiosis of human intuition and algorithmic precision. Mathematics and aggressive market analysis — against the machine of liquidations.

BTC UPDATEIn the previous technical update, when everyone was talking about a rally, I had warned that a drop to 82,000 was likely not out of reach. But if I'm honest, I didn't expect such a drop without a correction.
All support areas are on the verge of being lost one after another.
Absolute fear has gripped the market.
What I expect is for the market to find support from these areas and find itself, otherwise it is not far from reaching lower numbers.

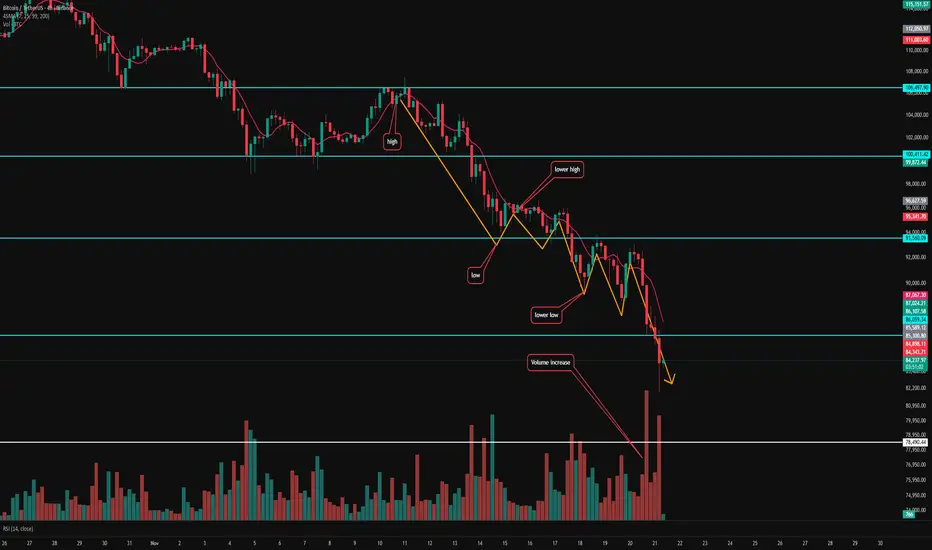
BTC 1DMy view on Bitcoin trends and structure based on Elliott Waves
Pay attention to the volume. Every time we had a drop, the volume increased.
Maybe wrong... Maybe right

Bitcoin dropped as planned. Wait for a new range to take SHORTBitcoin dropped as planned. Wait for a new range to take SHORT
global trnedi si still down
at this moment big liqudation had happend that's why price could create a range before new down move

Bitcoin at 83K: Hold the Line or Freefall to 75K?Bitcoin Analysis – Testing Key Support With Bearish Momentum Increasing
Bitcoin continues to break supports aggressively, raising the possibility of revisiting the 75,000 zone. Price is currently sitting on a major support at 83,000, a level that has held multiple times in previous corrections. This area will determine whether BTC stabilizes or continues its decline.
From a technical perspective, BTC is showing:
Clear lower highs and lower lows, confirming a bearish structure.
Strong bearish candles breaking through intermediate supports with conviction.
A lack of liquidity zones between 83,000 and 75,000, meaning that if 83K fails, price can drop quickly.
Oversold signals starting to appear on lower timeframes, increasing the probability of short-term consolidation.
On the fundamental side, several key elements are weighing on BTC:
Risk-off sentiment in global markets as equities correct and the U.S. dollar strengthens.
ETF outflows over the past days, showing reduced institutional demand.
Miners increasing selling, likely due to profitability pressure post-halving.
Lower liquidity in crypto markets heading into the weekend, making sharp moves more likely.
If Bitcoin holds 83,000, we may see a sideways consolidation before attempting a rebound. But if this level breaks, the path toward 75,000 is wide open, with no major support blocking the move.

Short-Term Sell Into Wave 4, Then Massive Long-Term BuyBTCUSD on the weekly timeframe is completing a major Elliott Wave 3 top, with price now correcting downward toward the projected Wave 4 demand zone around $58,000 – $62,000.
This aligns with the long-term ascending channel that has guided Bitcoin’s structure since the 2020 lows.
The chart shows a clean 5-wave structure forming, with Wave 4 expected to be the final deep correction before the next major bullish cycle.
SHORT-TERM TRADE IDEA: Sell Into Wave 4 Correction
Bias: Short
Reason: Breakdown from Wave 3 high + correction toward Wave 4 demand
Entry Zone:
$84,000 – $88,000 (current corrective bounce zone)
Targets:
TP1: $72,000
TP2: $62,000
Final Target (Wave 4 Low): $58,000
Stop Loss:
Above $92,000 (protect against bullish continuation)
Short-Term Notes:
Structure shows lower-timeframe bearish imbalances.
Expecting ABC correction to complete Wave 4 inside the purple demand zone.
LONG-TERM TRADE IDEA: Buy Wave 4 for Wave 5 Mega Rally
Bias: Long (swing/position trade)
Reason: Wave 4 completion + re-entry into the major ascending channel
BUY Zone (High-Probability):
$57,000 – $63,000 (golden pocket demand + channel support)
Long-Term Targets (Wave 5 Projection):
TP1: $100,000
TP2: $120,000
Final Wave 5 Target: $150,000 – $160,000
Stop Loss:
Below $45,400 (invalidates Wave 4 structure)
Long-Term Notes:
Weekly structure remains extremely bullish.
Wave 5 historically produces BTC’s strongest parabolic expansion.
Risk-to-reward ratio is exceptional (10R+).

Bitcoin Analysis – November 21 | We Ride the Winner!Good morning everyone! Let’s jump straight into today’s BTC analysis.
But first… a quick lesson I’ve learned recently:
📌 We don’t predict the market — we prepare for scenarios and react.
Trying to guess the future only puts us behind. Our job isn’t to fight buyers or sellers…
We simply wait for them to finish their battle — then ride with the winner. 🚀⚔️
With that mindset, let’s break down the main possible scenarios:
🟥 Scenario 1: Market Continues Under Sellers’ Control
On the daily and 4h timeframe, the trend is clearly bearish:
Lower highs & lower lows
Increasing selling volume
As long as the structure keeps printing lower highs/lows, the logical play is to follow sellers — waiting only for a clean trigger.
We’ve recently tapped into the $85K zone, but my line is outdated (drawn months ago).
I need a fresh reaction from this support area to validate it.
⏳ So I’m not shorting yet.
I’m waiting for a reaction — likely sometime this weekend when global markets are quiet — and then I’ll look for a short trigger.
⚠️ Right now is NOT a short entry for me.
Patience first. Trigger next.
🟩 Scenario 2: What if BTC jumps straight to $93,500?
Nothing changes for me.
As long as sellers dominate, I’m not opening any long on Btc.
Before considering a long position, I need:
At least one equal high + equal low (neutral structure)
And ideally a break into higher highs and higher lows
Until that happens — no longs for me.
🟦 Scenario 3: Range Formation
If the market ranges inside this zone, my short may get stopped out.
But honestly… that’s fine.
A range often builds a strong structural base — and once the direction becomes clear, I’ll simply follow the confirmed trend.
📌 Final Note
Please don’t underestimate risk management and capital preservation.
These scenarios help us stay objective — but discipline is what keeps us alive in the long run.
Thanks for reading my analysis!
Wish you all a great and profitable day. 🚀✨
Winter Has Arrived — Bitcoin’s Chill DiveBitcoin’s chart looks frosty — I expect a decline toward 83,000.
The red zone on the chart marks the invalidation area, where my plan will be canceled if price reaches it.
I believe Bitcoin is entering a corrective phase, and the market might need a “cool down” before any new rally can start
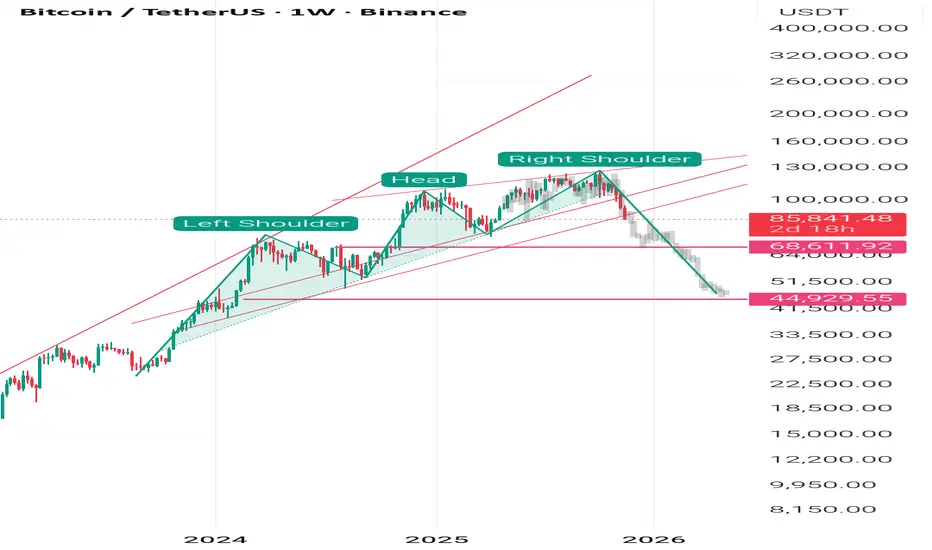
Bitcoin's Potential Head & Shoulders: Critical $75K Support# Bitcoin's Potential Head & Shoulders: Critical $75K Support Could Trigger Drop to $30K
## 📊 Current Market Structure
### The Setup
- **Current Price**: ~$84,000
- **Left Shoulder**: ~$109,000 (previous peak)
- **Head**: ~$126,000 (all-time high)
- **Critical Neckline**: $75,000
- **Potential Target on Breakdown**: $30,000
## 🎯 The Head & Shoulders Pattern Explained
### Pattern Components
**Left Shoulder (Completed)**:
- Peak at ~$109,000
- First major top in the cycle
- Followed by correction to neckline
**Head (Completed)**:
- Peak at ~$126,000 (ATH)
- Highest point of the pattern
- Currently correcting from this level
**Right Shoulder (Potential)**:
- **IF** we bounce from $75,000 support
- Could form another peak around $100K-$115K
- Would complete the bearish pattern
- Lower than the head, creating the classic formation
**Neckline (Critical Level)**:
- **$75,000** is the make-or-break level
- Acts as support for both the head and potential right shoulder
- **This level CANNOT be lost** for the pattern to remain valid
## ⚠️ Why $75K Is Absolutely Critical
### This Level Represents:
1. **Pattern Validity**:
- The foundation of the entire H&S structure
- Breaking it invalidates the bullish case
- Confirms distribution phase
2. **Technical Significance**:
- Previous resistance turned support
- High volume node from consolidation
- Psychological round number
3. **Market Structure**:
- Separates bull market from bear market
- Defines the range for right shoulder formation
- Last line of defense for bulls
## 📉 Two Scenarios From Here
### Scenario A: Bounce at $75K → Right Shoulder Formation (50% Probability)
**What Happens:**
- Price holds $75,000 support
- Rally begins toward $100K-$115K
- Forms the right shoulder (lower than $126K head)
- Creates selling opportunity for smart money
- **Then**: Breakdown occurs
**Timeline**:
- Bounce: Q1 2025
- Right shoulder formation: Q2-Q3 2025
- Breakdown: Late 2025/Early 2026
**Trading Implications**:
- Short-term bullish (75K to 100K+ = 33% gain)
- Medium-term bearish (setup for major drop)
- **Exit strategy needed** at right shoulder peak
### Scenario B: Direct Breakdown Below $75K (50% Probability)
**What Happens:**
- No bounce, direct break of $75,000
- Pattern completes immediately (no right shoulder needed)
- Accelerated selling pressure
- Target: $30,000
**Why This Could Happen:**
- Weak market structure
- Lack of buying support
- Macro headwinds (Fed policy, liquidity)
- Panic selling cascade
## 🎲 The $30K Target Explained
### How We Get There:
**Measured Move Calculation**:
- Head to Neckline distance: $126K - $75K = $51K
- Projected from breakdown point: $75K - $51K = **$24K**
- Conservative target considering support: **$30K-$35K**
**Why $30K Makes Sense:**
1. **Technical Confluence**:
- 200-week moving average (~$30K-$35K)
- Previous cycle high (2021 pre-ATH level)
- 76.4% retracement from ATH
- Typical Bitcoin bear market correction
2. **Historical Precedent**:
- 2018: 84% drop from ATH ($20K → $3K)
- 2022: 77% drop from ATH ($69K → $16K)
- 2025/26: 76% drop from ATH ($126K → $30K) would be consistent
3. **Market Cycle Logic**:
- Euphoria at $126K → Panic at $30K
- Washes out leverage and weak hands
- Creates foundation for next cycle
- Resets sentiment completely
## 📊 What Makes This Pattern Dangerous
### Red Flags to Watch:
**Distribution Signs at Right Shoulder:**
- 📉 Declining volume on rallies
- 📉 RSI bearish divergence (lower highs)
- 📉 Whale wallets distributing
- 📉 Funding rates extremely positive (over-leveraged longs)
- 📉 Retail FOMO peaks
- 📉 Media euphoria ("Bitcoin to $1M" headlines)
**Breakdown Confirmation Signals:**
- ❌ Daily close below $75K
- ❌ High volume on breakdown
- ❌ Failed retest of $75K (becomes resistance)
- ❌ Break of ascending trendline
- ❌ Death cross (50 MA crosses below 200 MA)
## 🔮 Probability Assessment
### My Analysis:
| Scenario | Probability | Timeline | Key Levels |
|----------|------------|----------|------------|
| **Bounce → Right Shoulder → Drop** | 40% | 6-12 months | $75K hold, rally to $100K-$115K, then drop to $30K |
| **Direct Breakdown to $30K** | 30% | 3-6 months | Break $75K, accelerate to $30K |
| **Pattern Fails → New ATH** | 20% | 3-6 months | Break above $126K, continue to $150K+ |
| **Extended Consolidation** | 10% | 12+ months | Range between $70K-$100K |
## 💡 Strategic Implications
### For Traders:
**Current Position ($84K)**:
- ⚠️ **High risk zone** - caught between hope and fear
- Wait for clarity at $75K level
- Don't chase moves in either direction
**If $75K Holds**:
- ✅ Long opportunity with tight stop below $75K
- Target: $100K-$115K (right shoulder)
- **Exit before right shoulder completes**
- Risk/Reward: Excellent (12-37% upside, tight stop)
**If $75K Breaks**:
- 🔴 Short opportunity or exit all longs
- First target: $60K
- Second target: $45K
- Final target: $30K-$35K
- Trail stops as it drops
### For Long-Term Investors:
**Current Strategy**:
- 🎯 **Do NOT buy here** ($84K) - wait for clarity
- 🎯 **If bounce to $100K+**: Take profits, reduce exposure
- 🎯 **If drop to $75K**: Small position (10-20% of capital)
- 🎯 **If drop to $50K-$60K**: Medium position (30-40%)
- 🎯 **If drop to $30K-$35K**: Aggressive accumulation (remaining capital)
**Dollar-Cost Averaging Zones**:
- ❌ $84K-$100K: **NO BUYING** (distribution zone)
- ⚠️ $70K-$80K: **Minimal** (5-10% of capital)
- ✅ $50K-$70K: **Moderate** (20-30% of capital)
- ✅✅ $30K-$50K: **Aggressive** (50-70% of capital)
## 🎯 Key Levels to Monitor
### Critical Support Levels (In Order):
1. **$75,000** - THE LINE IN THE SAND
- Pattern neckline
- Must hold for any bullish case
- Break = bearish confirmation
2. **$60,000-$65,000**
- Secondary support
- 50% retracement zone
- Potential dead cat bounce area
3. **$48,000-$52,000**
- Previous cycle resistance
- Strong psychological level
- Potential accumulation zone
4. **$30,000-$35,000**
- 200-week MA
- Pattern target
- Maximum pain level
- **Best buying opportunity**
### Resistance Levels (For Right Shoulder Scenario):
1. **$90,000-$95,000** - Initial resistance
2. **$100,000-$105,000** - Psychological barrier
3. **$110,000-$115,000** - Right shoulder peak zone
4. **$126,000** - Head level (unlikely to break)
## ⚡ What Could Invalidate This Bearish Setup?
### Pattern Failure Scenarios:
**Bullish Invalidation**:
- ✅ Break and close above $126K (new ATH)
- ✅ Strong volume accumulation at $75K
- ✅ Fundamental catalyst (major adoption news)
- ✅ Macro shift (Fed pivot, liquidity injection)
**Signs Pattern Won't Complete**:
- Institutional buying increases significantly
- ETF inflows accelerate
- On-chain metrics show strong accumulation
- Whale addresses growing, not distributing
- Long-term holder supply increasing
## 📰 Current Market Context
Based on your chart's news feed:
- "Bitcoin plunges below $86,000 as US jobs data dampens rate cut hopes"
- Strong jobs data = Fed stays hawkish
- Less liquidity = bearish for risk assets
- This supports the H&S breakdown thesis
## ✅ Bottom Line
### The Critical Message:
**$75,000 is the most important level in Bitcoin right now.**
- ✅ **Hold $75K** = Potential bounce to $100K-$115K (right shoulder)
- ❌ **Break $75K** = High probability of drop to $30K-$35K
- ⚠️ **Current price $84K** = No man's land, wait for clarity
### Action Plan:
**Short Term (Next 2-4 weeks)**:
- Watch $75K like a hawk
- Reduce risk exposure
- Prepare for volatility in either direction
**Medium Term (3-6 months)**:
- If bounce: Trade the right shoulder, but EXIT before completion
- If breakdown: Wait for $30K-$50K to accumulate
- Don't fight the trend
**Long Term (1-2 years)**:
- This pattern, if it completes, sets up the NEXT bull cycle
- $30K would be generational buying opportunity
- Bitcoin's long-term thesis remains intact
- Think in cycles, not in days
---
**Final Thought**: This is a textbook Head & Shoulders pattern forming on a macro scale. The $75K neckline is the key. Lose it, and we're heading much lower. Hold it, and we get one more rally before the inevitable correction. Either way, **patience and discipline will be rewarded** more than trying to catch falling knives or FOMO into pumps. 🎯

Whats your thoughts on this bitcoin idea back to highs? In my opinion BTC is pulling back very nicely and i do think it could have a bounce from this area, if it does not bounce from this area i would risk an absolute mortgage at 60 to 65 thousand. What's your analysts?
BITCOIN Next Weve Hello everyone, I hope you are all well
Today I will share with you my prediction for the next price movement of Bitcoin. I predict that the price has reached its all-time high. I previously shared an idea illustrating this; please review it below. I predict that we will see a final price rebound, as shown in the analysis, followed by a sharp drop to the targets outlined above.
This is not investment advice; please take full responsibility for your buying and selling decisions.
Warning: Be careful not to use this idea with leverage, as you could lose all your money

Don't be fearful.We are at Wave 3 correction.150k-200k at Wave 5As we can see on the MACRO LOG scale of this asset, subwaves for each big waves are clearly seen. We look at this dump as a blessing; not something to be feared of. We stay patient for where this dump goes and simply trade it.
Simply looking at the chart, vwap says 50k-ish is a very good zone to look into. Much much happy to come in if we visit below 50k with a failed auction to jump in.
Ofcourse, this is a very much big swing idea that does not mean too much for trading levels.
This approach is for investors who simply see bitcoin as an asset.
For a trader like us on this website, we must look on intermediate levels.
Goodluck traders!
Btcusd update ooooopMany of you may be surprised, but unfortunately this decline will continue, at least to $74,000. But I will expect a temporary high. If you have seen the previous analysis, you will understand what I expect from the price.

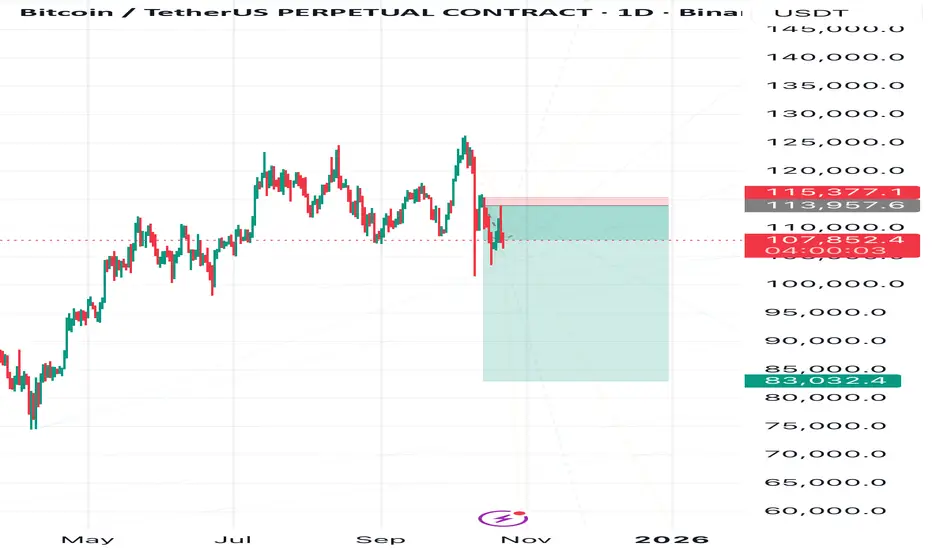
Final 2025 Forecast for BTCUSDT 21st November 2025 (Updated)1. Friday session dip to around ~$84k
2. Pump to around ~$92k over the weekend and early next week
3. Final dump down to ~$80k
4. Final pump to ~$128k to end the cycle
This idea does not indicate a massively new ATH but a topping out at the multi-cycle trend line from 2017.

SELL NOW TO 83K ON BTCUSD!!!!BTCUSD completed my last recent post analysis with 10,000pips today we have price rejecting off the inside bar supply region with a bearish rectangular pattern formed am in on another sell here holding till 83k is completed......

Bitcoin’s Head and Shoulders Pattern Signals a Possible Drop to Bitcoin’s current price action is far from healthy, and it could easily complete a Head and Shoulders pattern, leading to a correction down to the $40,000 range. While many may find this hard to accept, it’s time to face the reality: Bitcoin and other cryptocurrencies are no longer what they used to be, and altcoins are unlikely to experience another true altseason.
In 2025, the crypto bubble finally burst, revealing that digital currencies have far fewer real-world applications than promised, and public interest has faded. I’m saying goodbye to cryptocurrencies and shifting my focus to the Forex market. I will never “HODL” again, as this market has proven itself to be one of the dirtiest in the world.
Just about four weeks ago, the crypto market crashed in a way no other market does a clear sign of the disastrous manipulation by entities like Binance, which create extreme price traps to liquidate traders.
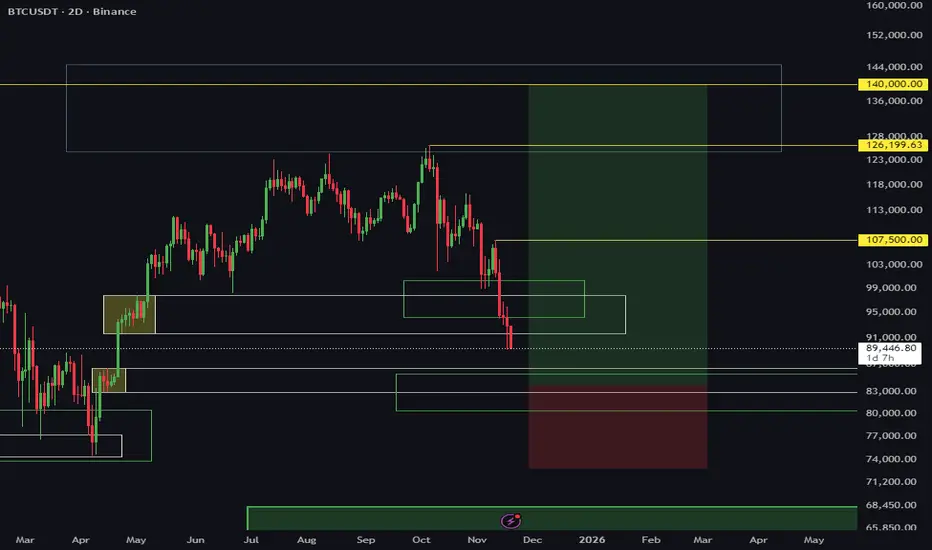
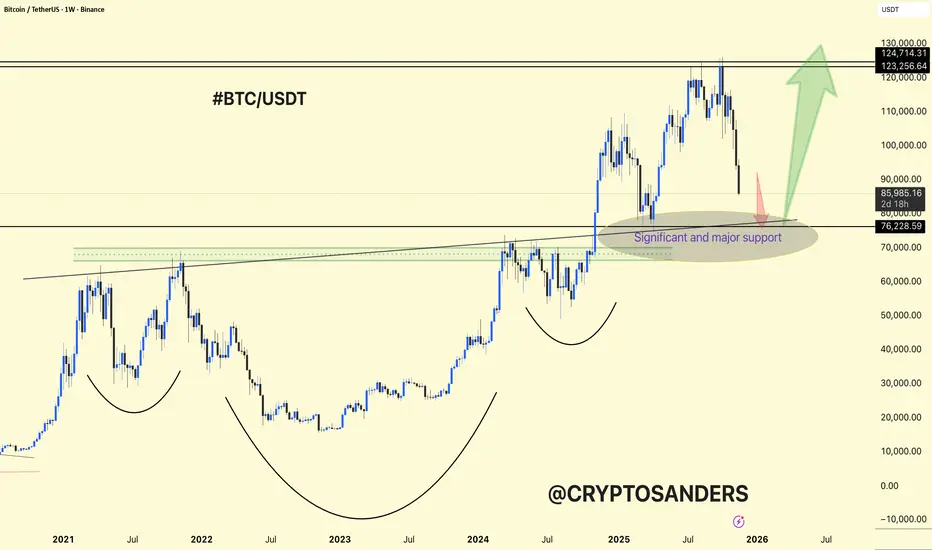
BTCUSDT Weekly Chart Analysis. BTCUSDT Weekly Chart Analysis
Major Structure: Bitcoin is experiencing a significant correction, now testing the most important multi-year support zone around $80,000–$82,000.
Patterns: The chart shows multiple rounded bottoms and a massive base structure, indicating repeated accumulation phases since 2021.
Support Zone: This highlighted area is not only a former breakout region but also converges with major horizontal and trendline support levels, making it highly significant for bulls.
If buyers defend this zone, a swift rebound toward $123,000–$130,000 is likely, maintaining the long-term uptrend.
Failure to hold here increases risk for deeper corrective moves, and the next support would be much lower.
Momentum Shift: The steepness and sharp drop into support reflect panic or forced selling, often associated with extreme sentiment lows.
DYOR | NFA
BTC Absolute Bottom is 76,500 SHORT THEN LONG to new ATH's30- 40% correction is usually a good pullback historically speaking. The last pullback similar to this one was January 2025 - April 2025 totalling a 32% retracement . thereafter taking off from $74,500 to ATH's.

BTC, OH BTC...Where Art Thou Going? - The Next Target = 77K-80KThis is part 2 of my analysis on BTC since we had the initial All Time High and the Break of Structure that led to all of this downfall. Please see the previously posted analysis on BTC and the analysis on ETH to see how the market structure has been playing out.
As mentioned in my previous post, don't follow the hype of Tariffs, Flash Crashes, and other non-sense reasons as to why BTC is dumping to these levels. This is a clear technical breakdown that is following how I "Read" market structure.
After the ATH of ~ 125K, we had a Break of Structure on the H4, that pulled back to what I call the "source" and then gave a strong rejection. This was followed by a Daily Break of Structure, and then a Weekly Break of Structure as well. This almost always leads to a continued rejection, and the target is the Daily "Source Zone" and then the Weekly Demand Source Zone.
As of today, we have fallen down through the Daily Source and are just inside of the large Weekly Source Zone (~77K - 88.5K). We will now have to dive down into this zone and look for the Daily Source to see more precisely where BTC is going. The daily range is between 77K - 80K, so that is the most likely target. Being a daily source within a weekly source, there should be a strong volume of buyers at this level, and we should see BTC spring back up from there.

BTCUSDT Weekly – Long SetupRumors swirl that Trump’s prepping a market-saving maneuver—just in time to protect his family's crypto bags before the next bear market. Whether it’s fiscal fireworks or just good ol’ wave theory, the chart’s pointing north.
Let’s see if the Trump pump delivers before the bears regroup. 🐂🇺s