Bitcoin Elliot Wave Correction : 40K Bitcoin completes it’s Elliot wave pattern with 24K marking the top of this cycle .
85K likely the bottom for this first wave down with a relief rally expected to 113K .
From there 42K is the next possible support for the second wave down. Saylor is in trouble.
Trade ideas

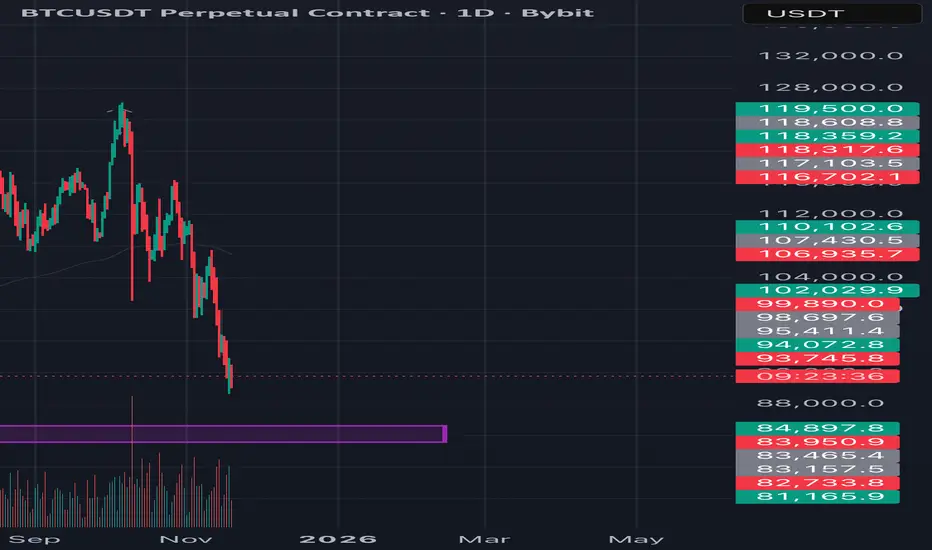
BTCUSDT.P - November 20, 2025The chart shows a clear downtrend marked by descending highs and lows, with price currently heading near a key horizontal support around the 88,000 level. A descending trendline acts as overhead resistance, while the shaded area near 92,000 represents a notable resistance zone. Price action suggests two possible outcomes: a bearish breakdown below support could extend the decline toward 85,000, while a successful breakout above the trendline may trigger a reversal toward 92,000 resistance. Momentum currently favors the bears as the market retests support after sustained selling pressure.

$BTC Correction 3 in Progress – Exactly on Script!KUCOIN:BTCUSDT CRYPTOCAP:BTC Correction 3 in Progress – Exactly on Script! 📉🚨
Altcoin Pioneers! ⚡ Bitcoin is following the historical fractal to the dot:
- Correction 1: -34% ✅
- Correction 2: -32% ✅
- Correction 3: currently -29.5% and counting (price ~89,130)
We’re now deep into the scariest phase of every bull market – the one that shakes out weak hands before the real parabolic run. This weekly candle is testing the 0.618 Fib + previous cycle highs zone (~84–88k).
What happens next:
- Hold 84k → final capitulation wick → explosive markup to 150k+
- Lose 84k decisively → extended correction toward 70–74k (less likely)
Indicators: Weekly RSI at 58 (still healthy), no bearish divergence yet, volume rising on panic = perfect washout setup.
Bias: This is the ultimate buy-the-fear moment as long as we stay above 84k. History says the biggest gains come right after Correction 3. Stay strong! 🐂💎
#Bitcoin #BTCFractal #BullMarket

BITCOIN Short term view What do you think guys about this trade...we are going to capture 3000 pips....A one hour strong bullish candle is confirmation....

BTC - Another (Drastic) Possibility For those who have been following my bitcoin short ideas, another possibility in this movement that I urge you NOT TO DISCREDIT so easily:
We see a flash crash / wick beginning from 89,000-89,500 region - and we drop straight to sub 10,000
My expected bottom of this wick is precisely 7,250
Now why would this happen, or be possible?
DXY is breaking down a major multi year bearish structure. This means the US dollar will fall in value over the next years, and lead to one of the largest bull markets we’ve ever witnessed on stocks, equities, and securities.
Bitcoin has been steadily rising and collecting not only long position stop loss orders, but liquidation orders for all the leveraged buys (including Microstrategy).
This leaves a massive chain reaction of sell orders ready to trigger off, one into the next, below price.
As price falls, more liquidity is removed and more sell orders are filled - this equals a drop at incredible speed that does not stop until there are no more orders.
So while I have been urging a 3 way corrective drop as such:
89,500 to 34,800
34,800 to 61,000-63,000
61,000 to 8,000
It’s entirely possible we see the following:
89,500 to 8,000
Happy trading,
- DD

BTC short TermDear Traders,
i expect to reach 119,200 it can go more up little bit but a second dump can be cooking
im publishing this idea bcz a lot of ppl lost money and most of you follow the wrong ppl
market is green yes but fully manipulated


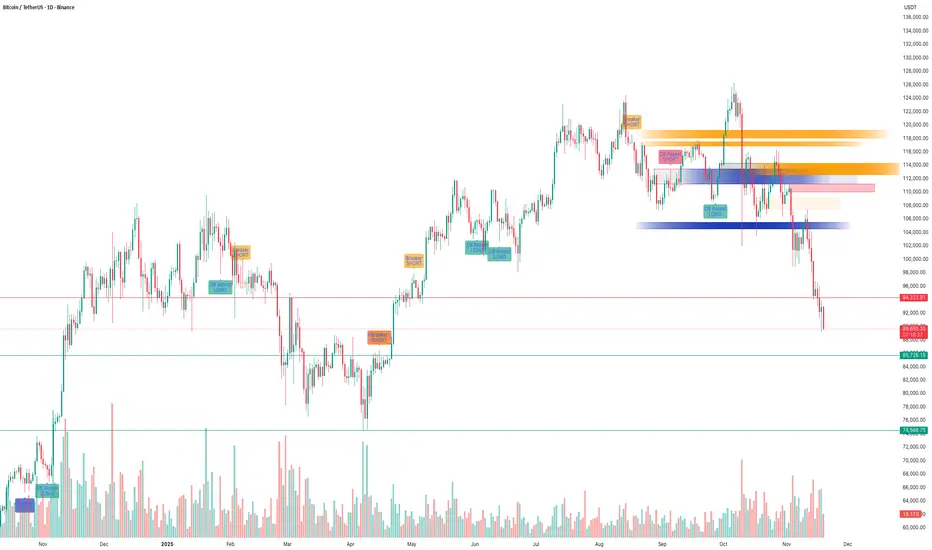
BTC – SMC Suite Follow-Up: Liquidity Grab at 116K and the Drop!!BTC – SMC Suite Follow-Up: Liquidity Grab at 116K and the Drop That Followed
This is a follow-up to my earlier idea “ BTC – Liquidity Grab at $116K Before Deep Correction? ” where I highlighted the danger of price trading into stacked SMC levels on the 1D chart.
1️⃣ Quick recap of the original idea
In the previous post, price was trading around the $112K–$116K zone.
Using the SMC Suite on the 1D chart, I highlighted:
• A high-timeframe supply / OB cluster around 116K.
• A liquidity grab above prior highs – price spiked into fresh liquidity sitting above the range.
• A confluence of Breaker + OB Re-test + FVG acting as a “danger zone” for fresh longs.
• The idea that this move could be a distribution / liquidity grab before a deeper correction.
The key message was: this is not a safe place to be aggressive long; watch for rejection and potential downside.
2️⃣ How price reacted afterwards
Since that post:
• Price respected the 116K zone as supply – every attempt to hold above it failed.
• The highlighted OB + Breaker block acted as a ceiling; price consolidated there and then rolled over.
• After losing the mid-range structure, BTC started a trend of lower highs and lower lows , confirming distribution.
• We have now traded all the way down into the d emand / support zones below 92K and then lower , which were also plotted in advance by the same SMC levels.
In simple terms, the area we marked as a “ danger zone for longs ” turned out to be the top of the move before this large downside leg.
3️⃣ What the SMC levels showed well
This move is a nice case study of how the SMC concepts aligned:
• Liquidity Sweep : Price ran above previous highs into fresh liquidity, then failed to hold.
• Breaker + OB Re-test : Former demand became supply; retest of this breaker block rejected price.
• FVG + Imbalance Zones : Upside imbalances got filled and then flipped into resistance.
• Structure Shift : After the rejection, market structure shifted bearish with clean breaks of prior swing lows.
None of this is about “perfect prediction”, but about reading where smart money might be offloading risk and where retail is most vulnerable.
4️⃣ Takeaways & what I’m watching next
• HTF SMC levels matter. When multiple concepts cluster (Breaker, OB, FVG, previous highs), treat that zone with respect.
• Liquidity grabs at highs are great warning signals – especially when followed by a clear structure shift.
• For now, I’m watching how price behaves around the current demand zones and whether we see:
• Strong rejection + reclaim of broken levels (potential swing-long areas), or
• Continuation of lower highs pointing to further downside.
This post is for educational purposes only, not financial advice.
Bitcoin - Relief rally is imminent!Introduction
Bitcoin (BTC) has shown strong downward pressure over the past several days, yet it is beginning to display early signs of stabilization within key higher-timeframe fair value gap zones. Even though the current market structure remains bearish, several technical elements are aligning that suggest the potential for a relief rally. With multiple patterns and liquidity levels converging, the market may be preparing for a temporary upside correction before determining its next major direction.
Weekly FVG
On the weekly timeframe, BTC recently tapped into the weekly fair value gap and filled roughly fifty percent of this imbalance. This partial fill often indicates that the market is collecting liquidity before initiating a larger move. As a result, this weekly FVG acts as a strong demand zone where buyers tend to become active again, offering an area where price often stabilizes, even if only temporarily. The reaction here suggests that BTC may be forming a short-term base.
Daily FVG
On the daily timeframe, another fair value gap is present, and it aligns almost perfectly with the weekly zone. Above current price action lies a clear descending trendline, which is likely to act as resistance on any upward push. The combination of the daily FVG and the downward trendline creates a technically significant decision point. If BTC reaches this area, it may face renewed selling pressure, making this zone crucial for determining whether the market can extend higher or whether the downtrend will reassert itself.
4H Timeframe
On the 4-hour chart, BTC has formed a falling wedge, a pattern that is typically considered bullish. Initially, price broke downward out of the wedge, which seemed like a continuation of weakness. However, BTC quickly moved back into the structure, signaling a fake-out. This type of movement often occurs when liquidity is collected beneath the pattern before a reversal begins. The return into the wedge strengthens the case for a short-term upward correction, suggesting that buyers may be gaining traction.
Relief Rally
The first zone to watch lies just above the current price level, where a 4-hour bearish FVG overlaps with the descending trendline. This confluence is likely to act as immediate resistance, making an initial rejection from this level highly plausible. After a potential rejection, price may revisit the bullish 4-hour FVG below, where buyers are expected to step in again. From this supportive zone, BTC could attempt to break through the descending trendline and continue higher toward the upper 4-hour bearish FVG around the 98,000-dollar region. This serves as a logical target for a relief rally, should momentum continue to build.
Conclusion
BTC is currently positioned within an important higher-timeframe demand zone, strengthened by the overlap of both the weekly and daily FVGs. Although the broader market structure remains bearish, the fake-out within the falling wedge on the 4-hour chart signals that a relief rally may be developing. The immediate resistance above price will provide the first major test. If Bitcoin finds renewed momentum from the bullish 4-hour FVG and successfully breaks the descending trendline, an upward move toward 98,000 dollars becomes increasingly realistic. For now, BTC appears to be setting the stage for a corrective bounce, with key levels offering clear guidance on how this scenario could unfold.

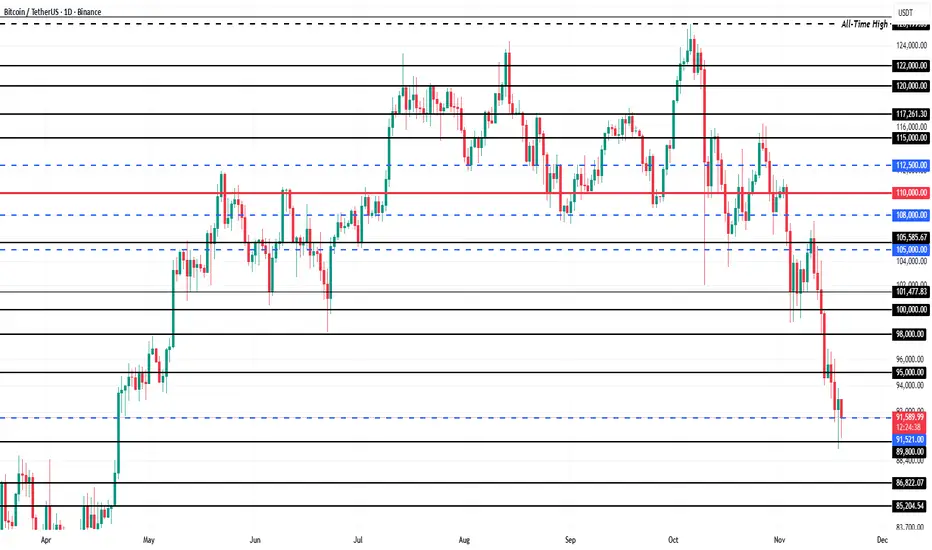
Bitcoin last chance before the market bull season endThe market is at a critical technical juncture. A decisive breakdown and sustained close below the $90,000 support zone would signal a confirmed shift into a sustained bearish cycle. In such a scenario, the next significant structural support is projected near the $60,000 level, representing a potential depreciation of over 30% from current levels.
Conversely, this level also presents a pivotal opportunity for the bulls to defend the market structure. A strong rejection and consolidation above $90,000, forming a robust base, would be the first step towards stabilization. Following this, a recovery and sustained break above $110,000 would be required to invalidate the bearish outlook and signal the probable start of a new bull phase.
DISCLAIMER: ((trade based on your own decision))
<<press like👍 if you enjoy💚

TradeCityPro | Bitcoin Daily Analysis #225👋 Welcome to TradeCity Pro!
Let’s jump into today’s Bitcoin analysis. After the pullback to 93,555, Bitcoin has moved into a ranging phase.
⌛️ 1-Hour Timeframe
Yesterday, after reaching its support zone, Bitcoin made a corrective upward move and pulled back to 93,555.
💡 Right now, after completing that pullback, the price has dropped back down to 90,489 and has shown a reaction to this level.
✔️ As you can see, selling volume has been increasing during this move, and we haven’t seen any significant buying volume enter the market yet.
✨ Today’s trigger for opening a position is the break of 90,489.This is a suitable trigger for a short position, and breaking it could be the start of the next bearish leg.
⭐ If the move toward 90,489 comes with increasing volume, we can even enter earlier using a candle setup, before the full break happens.
📊 For a long position, it’s still too early.We first need to see the price stabilize above 93,555, and only then we can look for long triggers.
❌ Disclaimer ❌
Trading futures is highly risky and dangerous. If you're not an expert, these triggers may not be suitable for you. You should first learn risk and capital management. You can also use the educational content from this channel.
Finally, these triggers reflect my personal opinions on price action, and the market may move completely against this analysis. So, do your own research before opening any position.

BTC DAILY KEY LEVEL APPROACHING BTC has been on a down trend for a while now and is currently approaching a daily demand zone which is the zone that caused the break of structure of the previous high on the daily time frame. So let wait for price to Tap into the zone and see if buyers will eventually kick in or probably break below it to continue the downtrend. Let wait for clear confirmation.
BTC - Short Update - Next Expected MovesBitcoin “Ultimate Swing Short” has been playing out beautifully from our upper entry of 121,500.
Here are updated details of expected path from here:
SHORT - 91,500 Entry - Target of 35,500
LONG - 34,700 to 35,200 Entry - Target of 62,000
SHORT - 63,000 to 63,900 Entry - Target of 10,000
BUY - 7,600 to 9,000
Here is a list of the take profit targets not yet hit for those holding the short:
1) 87,400
2) 67,900
3) 43,800
4) 21,600
5) 10,100
Expect these last moves to be very fast, best to plan ahead and be prepared.
Much love and happy trading.
- DD

Bitcoin long term view Almost 70million Bitcoin bought in just 5 months and that's why we saw a huge rally....now it's time to sell...it will reach below level

BTCUSDTBTCUSDT price is near the support level 90196-88441. If the price can hold above 88441, it is expected that the price will rebound. Consider buying the red zone.
** This is not financial advice.
🔥Trading futures, forex, CFDs and stocks carries a risk of loss.
Please consider carefully whether such trading is suitable for you.
>>GooD Luck 😊
❤️ Like and subscribe to never miss a new idea!

Bitcoin longEntering long again . I think btc is going to climb higher .Chart is looking good for a potential bounce.

Bitcoin Channel Low Support, Bottom Forming?Bitcoin is currently testing the $90,000 channel support, a historical level that previously marked major cycle lows. Holding this region keeps price inside a strong higher-time-frame range.
If BTC maintains this support on a closing basis, the probability of a rotation toward $135,000 increases, setting up conditions for a potential attempt at new all-time highs.
Key Points
- $90,000 acting as major channel support from previous market bottom
- Holding support keeps BTC within higher-time-frame bullish structure
- Break above resistance opens path toward $135,000 and beyond
What to Expect
As long as Bitcoin holds above $90,000, a rebound toward $135,000 becomes the likely next move. A breakdown would delay the bullish continuation.

Expecting BTC to grab above liquidity.As the BTC bounce back to the liquidity zones, we are expecting it to take the previous days liquidity. Let see

BITCOIN SIGNAL: NOBODY COUNTS ON THIS!!! (scary)Yello Paradisers! Enjoy the video!
And Paradisers! Keep in mind to trade only with a proper professional trading strategy. Wait for confirmations. Play with tactics. This is the only way you can be long-term profitable.
Remember, don’t trade without confirmations. Wait for them before creating a trade. Be disciplined, patient, and emotionally controlled. Only trade the highest probability setups with the greatest risk to reward ratio. This will ensure that you become a long-term profitable professional trader.
Don't be a gambler. Don't try to get rich quick. Make sure that your trading is professionally based on proper strategies and trade tactics.

Bitcoin’s Price at $90,000 Is Signaling a Bottom Formation
Bitcoin trades at $90,331 and holds above the $89,800 support level, which has become a key buffer during the decline. The recent drop to a multi-month low has increased caution, but technical and behavioral signals suggest downside pressure is easing.
Based on investor support and historical patterns, a deeper drop appears unlikely. A bounce from $89,800 could push BTC back toward $95,000 as confidence improves. Strengthening demand and exchange outflows reinforce the possibility of a recovery in the near term.
If bullish momentum fades and broader weakness intensifies, Bitcoin could slip below $89,800 and fall toward $86,822. Such a decline would invalidate the current bullish thesis and signal a deeper retracement.
Bitcoin: Areas of interest (supports and resistances,short term)Here you have some boxes that show support and resistance areas where you can buy and sell

BTCUSD - 3months : Is a 50% Correction toward 50K on the table?Bitcoin faces a potential three-month corrective phase after tapping 91K. Untested liquidity below 70K and 60K keeps the downside open, making a deeper move toward the 45K demand zone increasingly likely.

BTC Bearish Scenario This idea is comes from a place purely of pattern recognition, I believe BTC still has more to give this cycle but I have noticed similarities between the "Trump pump" top and the most recent top/ price action:
Both tops feature a wick into the diagonal resistance, followed by a slightly larger wick making a new high before selling off.
After the highs in January BTC sold off back towards the trend support level, could BTC follow this pattern this time around too? So far they are tracking very closely, the beginning of November would be the bottom at trend channel support if this was to play out.
For me $108,000 is the key S/R level in this idea, a break below it would definitely open Bitcoin to the possibility, all the time price stays above it does look significantly stronger.
