TradeCityPro | Bitcoin Daily Analysis #224👋 Welcome to TradeCityPro!
Let’s dive into the Bitcoin analysis. The market has continued its downward movement and has reached its next support level.
⏳ 1-Hour Timeframe
Yesterday, after breaking the 93,965 zone, Bitcoin started a downward move, which extended to 89,603.
⚡️ The main support zone for the price, in my opinion, is 88,262, which the price hasn't yet reached, and it was supported at 89,603.
✨ Currently, the price is making a bullish correction and has retraced to around the 0.382 Fibonacci level.
✔️ The 91,608 zone is very important, and if the price can stabilize above it, the likelihood of forming a V-pattern increases significantly.
🔔 If the price moves sharply upwards and stabilizes above 95,766, we will get confirmation of the activation of this pattern, but currently, the price is still far from it.
📊 For today’s long position, we can consider entering if the 89,603 level breaks, but with very low risk, as the price has already made its move, and I believe we are in a correction phase now.
🎲 If the upward move continues, I think we could open a long position tomorrow. Otherwise, the next trigger is 95,766.
❌ Disclaimer ❌
Trading futures is highly risky and dangerous. If you're not an expert, these triggers may not be suitable for you. You should first learn risk and capital management. You can also use the educational content from this channel.
Finally, these triggers reflect my personal opinions on price action, and the market may move completely against this analysis. So, do your own research before opening any position.
Trade ideas

BTC Weekly RSIBTC Weekly RSI Just Hit 37.5 — First Time Since Jan 2022
The last time Bitcoin’s weekly RSI fell back into this zone was January 2022, right before a 45% relief rally that carried the market from January → March, even within a macro downtrend.
After that rally, RSI eventually bottomed at 27 in July.
Today, BTC’s weekly RSI has returned to the same 37–38 region, historically signaling exhaustion in downside momentum.
If BTC mirrors the 2022 relief structure, a similar ~45% bounce from the current ~$89K zone would align with previous cycle behaviour.
Not a guarantee — but the setup rhymes with past market structure.

BTCUSDTHello Traders! 👋
What are your thoughts on BITCOIN?
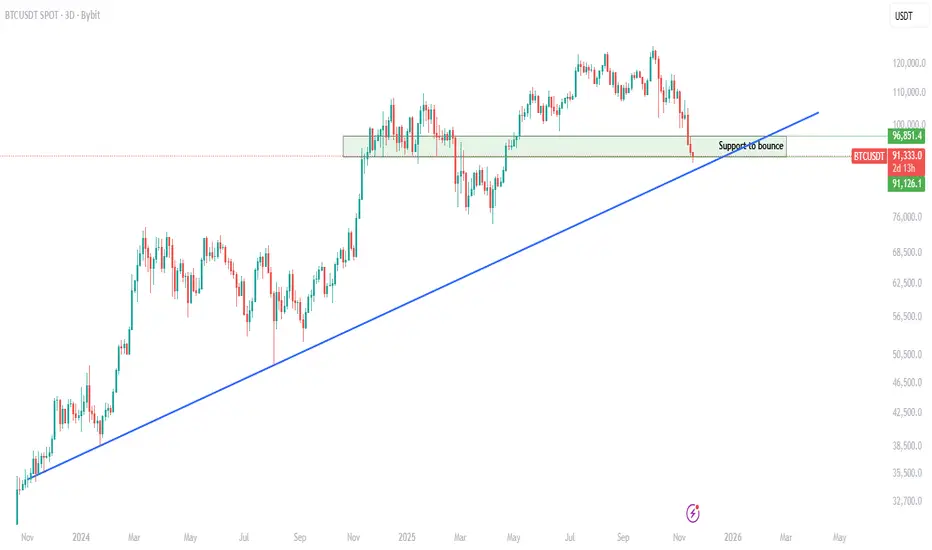
Bitcoin has dropped into the marked support zone, where a bullish reaction is likely in the short term. From this area, price may attempt a move back toward the descending trendline.
The key focus will be on how price reacts once it reaches the trendline and the overhead resistance zone.
A confirmed breakout above this resistance could trigger further upside momentum toward higher levels.
Until this breakout occurs, any upward movement will simply be considered a correction.
Don’t forget to like and share your thoughts in the comments! ❤️

Bitcoin: Short-Term Bullish Recovery on the TableBitcoin: Short-Term Bullish Recovery on the Table
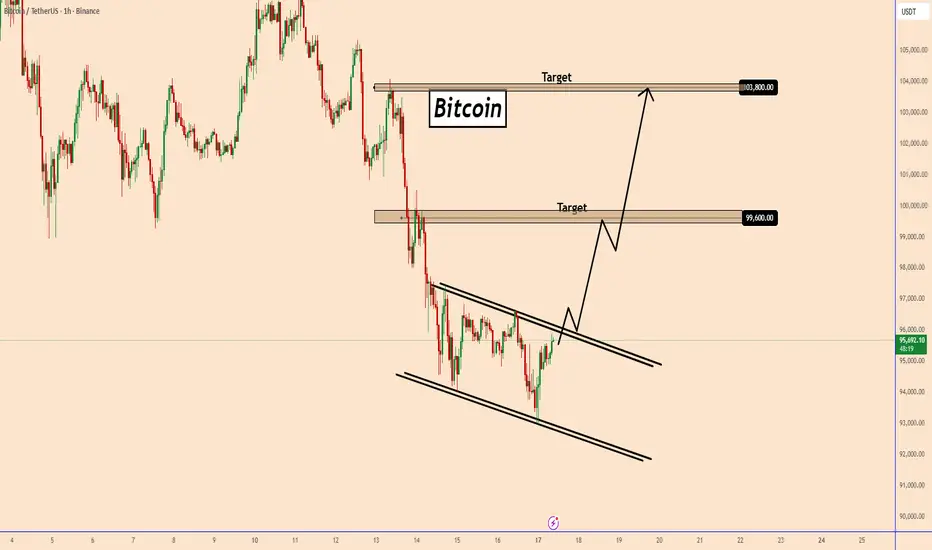
Bitcoin is showing early signs of a potential short-term bullish reversal as price continues to respect the descending channel. The latest bounce from the channel’s lower boundary suggests growing buyer interest, and a breakout above the upper trendline could trigger a stronger recovery.
If BTC manages to break and retest the channel resistance, the next targets sit at:
Key Bullish Targets
$99,600
$103,800
As long as the price holds above the channel, the short-term bullish scenario remains valid. A clean breakout would confirm upside continuation.
You may find more details in the chart!
Thank you and Good Luck!
❤️PS: Please support with a like or comment if you find this analysis useful for your trading day❤️
$BTC – Key Support TestCRYPTOCAP:BTC has reached the same support zone we highlighted earlier.
Price is reacting exactly at the trendline + horizontal support, which increases the probability of a relief bounce from this area.
As long as this support holds, BTC can push back toward the mid-range levels shown on the chart.
BTC next cycle BTC next cycle simple Pa+Fair value analysis
Acumulation range $35-55k
3-4 Year target $444k
7-10 Year target $1M

Key Bitcoin & S&P Scenarios to Watch
S&P breaks out from triangle and daily trendline; Bitcoin forming a potential weekly head-and-shoulders — key levels to watch

BTCDaily and higher time frame indicators show CRYPTOCAP:BTC is heavily oversold and selling pressure is exhausted. This looks like a massive bear trap. I expect an inverse head and shoulders to form and price to target $170K. We have traded below the 200MA for 20 days and historically it takes 50 to 70 days before reclaiming and starting a new uptrend. This could be the biggest bear trap in Bitcoin history.

$Bitcoing$A quick retest (here you'll see the most fakeouts) and a continuation.
Pls do your analysis before investing.

BTC 30% Pullback: Local Floor is inBTC now at "Golden Pocket" Retracement Level:
The fact that a 30% pullback is coinciding with a Golden Pocket Fib Retracement paired with the current Macro conditions makes Long BTC at this level an asymmetrical bet.
Math / structure of the move
0.618 is the golden ratio, and 0.786 is roughly its square root – both come directly from the Fibonacci sequence. A pullback into 61.8–78.6% is deep enough to shake out weak hands and run liquidity, but not so deep that it fully invalidates the prior impulse. That makes it a natural “last chance” zone for trend continuation.
Orderflow & crowd psychology
A lot of traders, bots, and educational content focus on 0.618 / 0.786 as “golden pocket / OTE” style zones, so limit orders, stop orders and algorithms cluster there. In crypto, where retail TA is everywhere, this becomes self-fulfilling: price often spikes into 0.618–0.786, sweeps stops, then reverses.
Sneak Peak of the HTF Indicator I am developing for the upcoming launch of Glitch Capital . A multi-timeframe breakout- and trend-following Indicator Suite I will be launching soon.
Here you can see the Glitch Sniper Algo firing the first Buy Signals since this latest pullback. This is a sneak peak of another Indicator from the Glitch Suite I will launch soon:
30% drawdowns are normal in Bitcoin bull markets, not rare “black swans.”
A near perfect 30% pullback from ATH during a Bull Market is a known Phenomena during Crypto Bull Markets
Here’s how it looks historically:
2013 bull market: At least two 30–40% corrections on the way up.
2015–2017 bull market: Study of this cycle shows “at least nine large drawdowns” with an average correction of about 37% from peak to trough. Community analysis of the 2017 leg alone often highlights ~6 separate ~30% dips between 2016–2017 before the final top.
2011–2021 overall: About 13 drawdowns of more than 30% across that decade (bull + bear), underlining how routine deep pullbacks are in BTC.
Glassnode / market analysts: Repeatedly describe 30–40% corrections as “typical” in BTC bull markets, i.e. part of a healthy uptrend rather than a trend-break by default.
If you compress that into a rule of thumb:
In a strong Bitcoin bull cycle you can easily see several pullbacks of ~30%+, roughly every few months. So when you see a ~30% dip in a confirmed bull market, historically it’s been common and often buyable, not an automatic end-of-cycle signal.

Bitcoin (BTC): Bitcoin Fell Below $90K | Buyers Reclaim QuicklyA rollercoaster ride is happening on the markets, where BTC dipped below $90K (yet buyers managed to retake the dominance over that area).
This is a very important zone, as losing control over this would result in a very deep correctional movement, which might turn into the bearish market (or the start of it).
What we are expecting, though, is the reversal to happen and just like last time, a re-test of 100 EMA, which would be ideal after the recent dip we had!
Swallow Academy

How to build a Healthy Trading MindsetMany traders underestimate how much psychology shapes their results. This guide outlines the foundations of a strong trading mindset that supports consistent and disciplined decision-making.
1. Understand That Emotional Discipline Is a Skill
Trading naturally triggers emotions such as fear, frustration, greed, and impatience. These reactions are not weaknesses; they are human. What separates consistent traders from inconsistent ones is their ability to recognize emotions without acting on them.
A resilient mindset comes from training, not talent.
2. Create Distance Between Yourself and Your Trades
Do not tie your self-worth to the outcome of a single position. A loss does not mean you failed, and a win does not mean you are skilled. When traders begin to link identity to results, they make impulsive decisions.
Use phrases like “this trade” instead of “my trade” to remove ownership bias.
3. Focus on Process, Not Profit
Most traders sabotage themselves by obsessing over the end result. The market does not reward effort; it rewards alignment with probability.
Instead of thinking “How much can I make?”, think “Did I execute according to my plan?”
Your trading plan should define your entries, exits, risk, and market conditions. Follow it even when it feels uncomfortable.
4. Accept Uncertainty as Part of the Game
No setup is guaranteed. Every trade, no matter how perfect, carries uncertainty. Accepting this prevents you from forcing control where none exists.
When you fully accept uncertainty, you no longer fear it.
5. Build Consistency Through Routine
A stable routine reduces mental noise. Examples include:
• Reviewing your plan before each session
• Limiting how many markets you monitor
• Taking breaks after high-stress situations
• Logging your trades with honest notes
When your routine is consistent, your decisions become consistent.
6. Use Losses as Data, Not Drama
A loss is not a personal attack from the market. It is information.
Ask: “What does this loss teach me about my system or my mindset?”
If you can extract value from losses, they become opportunities instead of obstacles.
7. Master Patience
Most trading errors come from acting too soon, not too late. Patience means waiting for your setup without deviation.
If you need to be in a trade at all times, it is no longer trading; it is compulsion.
8. Protect Your Mental Capital
Mental capital is as important as financial capital. Overtrading, revenge trading, and excessive chart time drain your cognitive energy.
Stop trading when you notice fatigue, frustration, or impulsiveness. A clear mind is an advantage.
9. Develop Long-Term Thinking
Think in terms of series, not individual outcomes. A single win or loss means little. What matters is the overall direction of your equity curve.
Professional traders think in months and years. Amateurs think in minutes.
Conclusion
A powerful trading mindset is built through consistency, self-awareness, and emotional control. By focusing on process and discipline rather than short-term results, you create a stable internal environment that supports longevity in the markets.
BTC market on fire, sharp dropBTC Daily Timeframe – Short Summary
BTC is forming a bearish 5-wave Elliott structure:
Wave (3) seems to have bottomed around 94,000.
Price is now expected to make a Wave (4) pullback toward 100,000–101,000 (major resistance).
After that, BTC is likely to drop again in Wave (5) toward the 80,000–82,000 zone (1.618 extension).
Technical signals:
BTC is below all EMAs (34/89/200) → trend still bearish.
200 EMA near 104,800 is strong resistance.
Key supports: 94k, then 80k.
Bias: Bearish while below 104k–105k.

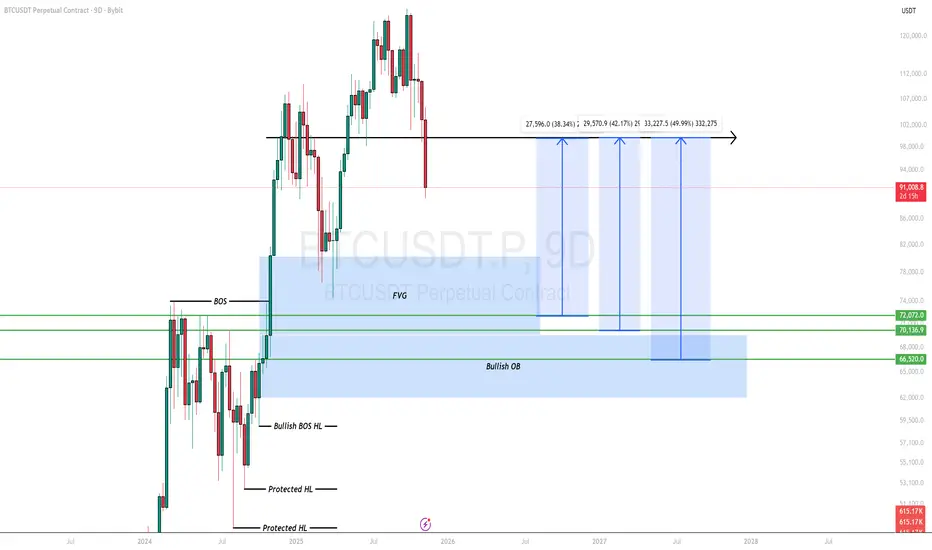
Probable Bullish Reversal Levels For BTCUSDT.The price levels BTC is likely to have a bullish reversal from provided there is no market manipulation.
📌 $66,520
📌 $70,136
📌 $72,072
Trade safe and smart.
BTC/USDT | Bitcoin Drops Hard – Key Demand Zones Now in Play!By analyzing the #Bitcoin chart on the daily timeframe, we can see that BTC failed to hold above $104,700, and as expected, this led to a heavy sell-off. First, the price dropped to $94,000, and then a second strong wave pushed it down to $89,000. Bitcoin is now trading around $91,000.
Key supply zones and demand zones are marked on the chart. Important demand levels sit at $88,000, $84,000, and the larger zone at $74,000–$78,000. Watch how the price reacts to these areas.
If Bitcoin wants to recover, it must first hold above these key zones. But if BTC breaks below $74,000, it could open the door for a deeper drop toward $50,000. For now, focus on price reactions at the marked demand levels.
Please support me with your likes and comments to motivate me to share more analysis with you and share your opinion about the possible trend of this chart with me !
Best Regards , Arman Shaban

DeGRAM | BTCUSD is testing the $90k level📊 Technical Analysis
● BTC/USD is testing a major support cluster near 88–90K, where price aligns with the long-term dynamic support line formed from previous triangle and flag breakdowns.
● The new rejection wick at support and the descending channel structure suggest a potential medium-term rebound toward 95–97K if buyers defend this level.
💡 Fundamental Analysis
● Bitcoin sentiment stabilizes as ETF inflows resume and risk assets recover after easing US inflation expectations.
✨ Summary
Support: 88–90K. Rebound potential: 95–97K. Medium-term bullish scenario valid while holding the dynamic support.
-------------------
Share your opinion in the comments and support the idea with a like. Thanks for your support!

Mastering RSI: A Complete Guide to Momentum🔵 Mastering RSI: A Complete Guide to Momentum, Regimes, Reversals & Professional Signals
Difficulty: 🐳🐳🐳🐳🐋 (Advanced)
This article goes far beyond the basic idea of “RSI = overbought/oversold.” If you want to truly master RSI as a momentum gauge, trend filter, reversal tool, and structure confirmation model, this guide is for you.
🔵 WHY MOST TRADERS MISUSE RSI
Most traders use RSI in the simplest way:
RSI above 70 = sell
RSI below 30 = buy
This leads to shorting strong trends and catching falling knives.
RSI is not a reversal button. RSI is a momentum translator.
To master RSI, you must understand:
Trend regimes
Momentum pressure
Acceleration and deceleration
Failure swings
Divergences
Trend vs range behavior
Multi-timeframe alignment
Structure confirmation
RSI shows the strength behind price, not just extremes.
🔵 1. RSI TREND REGIMES (CORE FOUNDATION)
RSI moves in predictable zones depending on the type of market environment.
Bullish RSI Regime
RSI holds between 40 and 80
Pullbacks bottom around 40–50
Breaks above 60 show trend acceleration
Bearish RSI Regime
RSI holds between 20 and 60
Pullback tops form around 50–60
Breaks below 40 confirm bearish dominance
These regimes tell you who controls the market before you even look at candles.
🔵 2. MOMENTUM PRESSURE (RSI AS A SPEEDOMETER)
RSI measures the speed and pressure of price movement.
Rising RSI with rising price = trend acceleration
Falling RSI with rising price = momentum weakening
Rising RSI with falling price = early strength
Falling RSI with falling price = continuation pressure
This is not divergence. It is momentum pressure, the earliest sign of trend shift.
🔵 3. FAILURE SWINGS (THE MOST RELIABLE RSI REVERSAL SIGNAL)
Failure swings are powerful because they show internal momentum breaking before price reacts.
Bullish Failure Swing
RSI makes a low
RSI rallies
RSI dips again but stays above previous low
RSI breaks the previous high
Bearish Failure Swing
RSI makes a high
RSI pulls back
RSI rallies but fails to break the previous high
RSI breaks the previous low
Failure swings often appear at trend tops and bottoms before candles reveal anything.
🔵 4. DIVERGENCES (REGULAR AND HIDDEN)
Regular Divergence: Reversal Clue
Bullish: price lower low, RSI higher low
Bearish: price higher high, RSI lower high
Hidden Divergence: Trend Continuation
Bullish hidden: price higher low, RSI lower low
Bearish hidden: price lower high, RSI higher high
Hidden divergence is more powerful than regular because it confirms trend continuation.
🔵 5. RANGE RSI VS TREND RSI
RSI behaves very differently in ranges versus trends.
Range Environment
RSI oscillates between 30 and 70
Reversals at extremes have high accuracy
RSI 50 is the equilibrium
Trend Environment
RSI stays above 50 in bullish trends
RSI stays below 50 in bearish trends
30 and 70 extremes lose meaning
Always identify environment first. RSI signals change depending on regime.
🔵 6. RSI AS A STRUCTURE FILTER
RSI combined with structure improves trade selection dramatically.
Price makes higher highs + RSI rising = healthy trend
Price makes higher highs + RSI flat = weak breakout
Price makes higher highs + RSI dropping = exhaustion
Support retest + RSI 40–50 = strong continuation potential
Most false breakouts are avoided simply by checking RSI pressure.
🔵 7. MULTI-TIMEFRAME RSI ALIGNMENT
Use higher timeframe RSI to validate lower timeframe setups.
HTF RSI bullish + LTF RSI pullback = high-quality entry
HTF RSI bearish + LTF RSI bounce = premium short area
HTF RSI crossing 50 = long-term regime shift
This is one of the most powerful RSI confluences.
🔵 EXAMPLE TRADING FRAMEWORK
Bullish Setup Checklist
RSI in bullish regime (above 50)
Pullback into 40–50 zone
Hidden bullish divergence or failure swing
Structure forms a higher low
Bearish Setup Checklist
RSI in bearish regime
Rejection from 50–60 zone
Hidden bearish divergence or failure swing
Structure forms a lower high
🔵 COMMON RSI MISTAKES
Trading RSI extremes without trend context
Ignoring RSI regimes
Entering on regular divergences in strong trends
Not using RSI midline (50) as a regime filter
Relying only on overbought/oversold signals
🔵 CONCLUSION
RSI is one of the most powerful indicators when used correctly. It provides a complete framework for:
Reading trend strength
Tracking momentum pressure
Identifying early reversals
Trading continuation setups
Filtering breakout strength
Aligning multi-timeframe bias
Master RSI, and you gain a clearer view of momentum than most traders ever experience.
How do you use RSI? Do you prefer divergences, trend zones, or failure swings? Share your approach below!

Bitcoin - trend is down. New trade is afterBitcoin - trend is down. New trade is after
clear consilidation or coming back into new local value

You’re Not Supposed to See This Analysis…Ladies and gentlemen, previously on Skeptic Lab—if you're following the page, you're probably short from the 101k level —we talked about upcoming support levels for Bitcoin. We pointed to the first support at 98k, then in order 95k and 91k. But one by one, all the supports got blown through, and now it's consolidating below the key 91k support. So, it's best we do an update on the overall structure that's formed, the next supports, scenarios, and triggers we could have.
Let's start from the weekly timeframe:
It makes sense that this week's candle has a smaller size—we've reached a daily support level, which is exactly 91,213.99 . If we lose that, the next support levels are at 87,566.47 .
In the daily timeframe
I see a high probability of ranging here. First off, the amount of liquidations has been decreasing each time: initially 300 million $ liquidated on the 101k break, then 250 million on the 95k break, but yesterday only about 195 million dollars in long positions got liquidated (if you notice, volume has also been getting lower and lower on the drops somewhat). This means the big traders aren't really present down here in a serious way, which could lead to a multi-week range. That's assuming the support zone from 90k to 91,213.99 holds— if it doesn't , we could see more downside to the weekly level I mentioned.
In the 4H timeframe
if you're with me on a position from 101k, I think it's a good spot to fully take profit. I see potential for ranging here or a reversal from this level, since it's a very key support. My long trigger here is specified as breaking the resistance at 96,066.89 in the 4H timeframe—that'd be our first long trigger. Why this level? Because after reacting to it, we dumped 7% :) So it's a super important level. For shorts, I'm waiting for a range box to form here—otherwise, I'm not opening any positions right now. Generally, opening positions right on strong support/resistance zones leads to your win rate dropping. Why? High volatility / high chance of fakes / lots of shadows... all of that tanks the win rate.
Finally, BTC.D also dropped super sharply with Bitcoin's dump.
This means going forward, if Bitcoin ranges or does a bearish range + BTC.D goes a bit uptrend, altcoins will give really good short triggers. That's it. Now get outta here.

Bitcoin’s Five-Wave Peak and What Comes NextIt seems that Bitcoin’s price action over the past two years has more or less completed a full five-wave advance. At the same time, even though each push upward made new highs, the RSI didn’t confirm those highs. This kind of divergence is often seen as a classic sign of fading momentum — the market looks strong on the surface, but the underlying buying pressure is no longer keeping up.
Based on common market structures, once a five-wave cycle finishes, the market often shifts into a three-part corrective pattern, known as an ABC correction.
Overall, Bitcoin may still see some short-term bounces, but the broader rhythm feels more like the start of a digestion or consolidation phase rather than the immediate beginning of a new bull cycle.
As for how things will ultimately unfold, we’ll have to let the market reveal the answer in its own time.

Bitcoin $BTC price analysis we need your vote !💥 Final “dip” of November?
💰 Will CRYPTOCAP:BTC drop to $91,600
to close that old GAP on the chart? 🤔
🟢 Bullish case: $100K holds → next rally begins.
🔴 Bearish case: gap fills near $91,600 → possible reversal after.
What do you think — final washout or just a pause before the next move?, vote at comments
______________
◆ Follow us ❤️ for daily crypto insights & updates!
🚀 Don’t miss out on important market moves
🧠 DYOR | This is not financial advice, just thinking out loud.

BTC longI think the bulls should gradually gain strength.
It's time to back... I guess🤷
Easy and simple.

#BTC – Isn’t it time to buy?#BTC – Isn’t it time to buy? 🚀
By analyzing market structure and outside news, BTC is approaching the zone where I’d seriously consider entering .
📍 88k–76k is the key range I’m watching for potential buys, aiming for 15–40%+ profit with a 15% stop los s.
⚡️ Important: Wait for LTF entry sign – don’t jump in blindly . Always do your own research before making a move.
#CryptoTrading #Bitcoin #BTC #ScalpTrading #CryptoAnalysis #BTCScalp #CryptoStrategy #TradeSmart #HODL #BitcoinAnalysis
