Bitcoin (BTC) Update, is price at resistance ?Bitcoin reversed sharply into the point of control and is now consolidating under the channel-high resistance that has held for several days. This suggests buyers are losing momentum.
As long as BTC stays below this resistance, the market remains vulnerable to filling the lower inefficiency and rotating back toward the 78,000 support.
Key Points:
- Consolidation under channel-high resistance
- Short-squeeze rise filled lower inefficiencies
- Single-print region below remains vulnerable
What to Expect:
A clean reclaim of resistance is needed for upside. Failure opens the door to deeper corrective moves toward 78,000.
Trade ideas

BITCOIN Bitcoin currently faces a major resistance at the 98,750 level, a zone that has repeatedly limited upward momentum. As long as the U.S. Dollar Index fails to decline and geopolitical risks remain elevated, Bitcoin is unlikely to show strong bullish continuation. Despite the lack of immediate strength, the market still provides attractive opportunities.
The 80,000 and 70,000 support regions are fundamentally valuable zones, especially if institutional buyers — such as BlackRock through ETF allocations — accumulate positions.

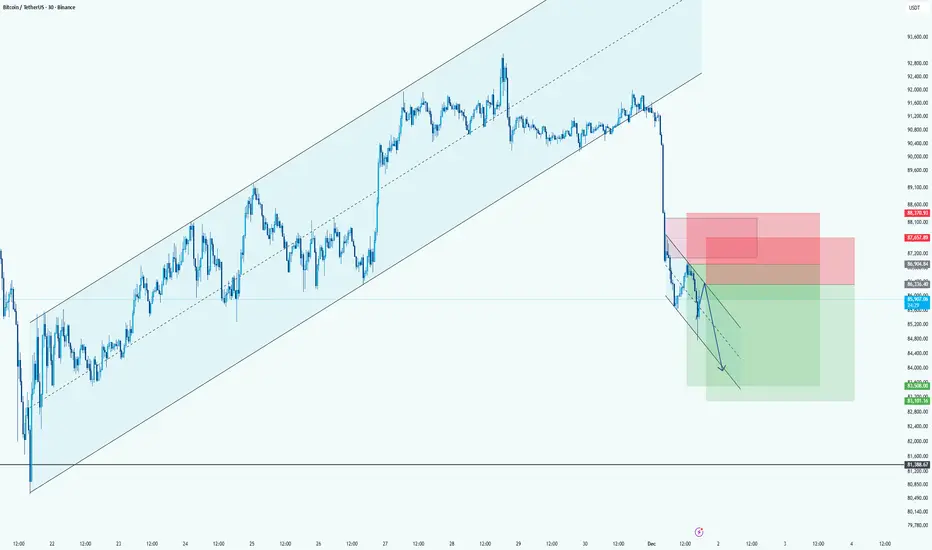
BTC: Bearish Continuation Setup After Major Channel BreakdownHi!
Price broke hard below the long-term ascending channel, confirming a clear shift from bullish to bearish momentum.
After the breakdown, BTC is moving in a small descending correction channel, creating a classic lower-high retracement toward supply.
Direction: Short
Entry Area: 87,200 – 88,300 (two stacked red zones)
Stop-Loss: Above 88,700–89,000 (top of supply)
Target: 83,000 – 84,800 (large green demand area)
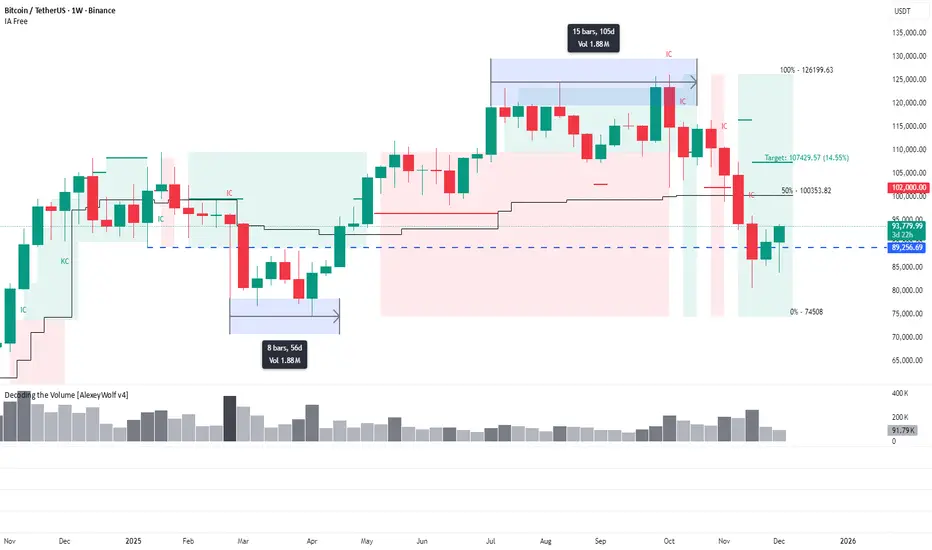
Volumes give clues: What the weekly range structure is showingThis analysis is based on the Initiative Analysis (IA) method.
Hello traders and investors!
On the weekly timeframe, Bitcoin remains in a sideways range. Notice how interestingly the price moved through its boundaries.
First, the lower boundary of the range at 89,256 was broken — and this is where a 1.88M volume was accumulated over 8 weeks .
Later, the price broke the upper boundary of the range, and the same 1.88M volume was distributed, but this time over just 15 days .
This indicates that there were far fewer buyers willing to buy at higher prices — the market needed almost twice as much time to distribute an identical volume.
Now the price has returned to the very zone where the first major volume was accumulated.
For more details about the 86,000–79,500 zone, see the related post.
Wishing you profitable trades!
BTC at Crossroads: Consolidation Before the Next Leg Up?BTC at Crossroads: Consolidation Before the Next Leg Up?
After Bitcoin came out of the consolidation, the price is reluctant to rise further. The market remains uncertain about the future moves considering that the FED is expected to cut rates at the upcoming meeting.
Perhaps the US PPI data today will start the move considering that the market should speculate again regarding the FOMC meeting.
On the other hand, BTC is well positioned for an optimistic move. It may correct in this area before moving higher. This is a normal scenario.
It is also possible that the price will fall within the pattern even more considering that the markets are still volatile and unclear before we see the optimistic move resume again.
Main targets
98900
106300
114500
You may find more details in the chart!
Thank you and Good Luck!
❤️PS: Please support with a like or comment if you find this analysis useful for your trading day❤️

TradeCityPro | Bitcoin Daily Analysis #238👋 Welcome to TradeCity Pro!
Let’s move on to today’s Bitcoin analysis. The market is currently in a correction phase after the bearish leg it experienced yesterday.
⏳ 1-Hour Timeframe
After the drop Bitcoin made, even fake-breaking the 85,220 level,
✔️ the price has started its correction, reaching up to 87,088.
🔔 During this correction, a Head & Shoulders pattern has formed, with the activation trigger being the 87,088 level.
💥 If this pattern gets activated, deeper corrections could follow.
The next resistance zone to watch is 89,082.
📊 Market volume has increased with the start of the new week, but during this correction, the volume is decreasing. This indicates that the downtrend still holds strength, and the likelihood of the trend continuing remains high.
💡 In this case, we can open a short position either after a fakeout at 89,082 or by confirming a Dow Theory breakdown.
The main short trigger right now is the 85,220 level.
📈 For a long position, breaking 89,082 is a risky trigger.
Personally, I prefer to wait for more confirmation before deciding to enter a long position on Bitcoin.
❌ Disclaimer ❌
Trading futures is highly risky and dangerous. If you're not an expert, these triggers may not be suitable for you. You should first learn risk and capital management. You can also use the educational content from this channel.
Finally, these triggers reflect my personal opinions on price action, and the market may move completely against this analysis. So, do your own research before opening any position.

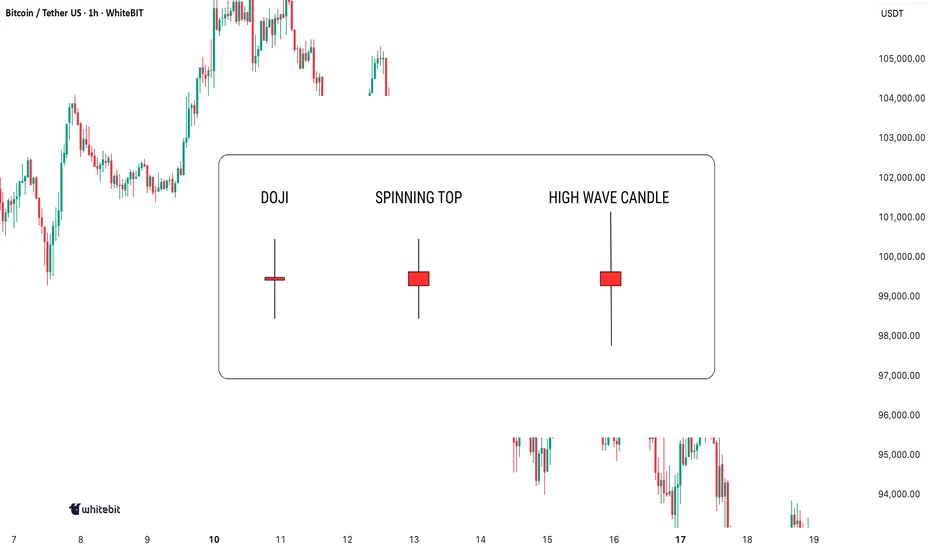
Indecision on the Chart: What These Candles Really MeanIndecision in the market? You're not alone. Every trader has faced those moments when the charts seem to scream confusion. But here's the thing: indecision candlestick patterns aren't just noise. They hold secrets that, when decoded, can give you the upper hand. Let's dive in and learn how to spot these patterns and use them to your advantage.
Mastering Indecision Candlestick Patterns
The most well-known indecision candles are the Doji, Spinning Top, and High Wave Candle. These candlesticks might seem tricky at first, but once you learn to recognize them and understand their context, they can serve as valuable tools in your trading strategy.
Doji
A Doji has a small body with nearly identical open and close prices, and long upper and lower wicks, indicating market indecision—neither buyers nor sellers gain control during that period.
When to look for confirmation: A Doji alone isn’t enough to trade. Wait for confirmation from the next candle: a bearish one after an uptrend may signal a reversal, while a bullish one after a downtrend might indicate the start of a rally.
Spinning Top
A Spinning Top is an indecision candle with a small body and longer upper and lower shadows. It indicates uncertainty, with more volatility than a Doji.
When to look for confirmation: A Spinning Top is more meaningful after a strong trend. Following an uptrend, it could signal weakening momentum. Wait for the next few candles to confirm the market’s direction.
High Wave Candle
The High Wave Candle is like the Spinning Top but with even longer wicks. It shows high volatility with no clear direction, as the price fluctuates widely but the open and close remain close, indicating indecision.
When to look for confirmation: Use the High Wave Candle with trend analysis. If it appears during consolidation or after a major move, it may signal a breakout. As with other indecision candles, wait for confirmation before acting.
Combining Indecision Candles with Indicators
While indecision candle patterns can provide useful insights, they are most effective when combined with other technical indicators. Here are some ways to use them in combination:
Moving Averages: Use moving averages (like the 50-period or 200-period) as a trend filter. If a Doji or Spinning Top forms above a moving average and the next candle confirms a reversal, it may signal trend continuation.
Relative Strength Index (RSI) : If an indecision candle forms when RSI is at extreme levels (above 70 or below 30), it may signal an upcoming pullback or reversal.
Volume: A high-volume candle following an indecision candlestick often confirms strong follow-through. Without volume, these patterns may be less reliable.
Where to Avoid Using Indecision Candles
While indecision candles are useful, there are some scenarios where relying on them without confirmation can be misleading:
Choppy Markets: Indecision candles appear frequently and may not signal real reversals.
During News Events: Sharp price spikes can create false indecision signals.
Lack of Context: A Doji in sideways price action has less significance than one after a strong trend.
Indecision candles signal uncertainty, but don’t act on them blindly. Always combine them with other analysis and make decisions based on your own judgment!
Bitcoin Only after breakout chanel resistance bull market again Soon we can expect price broke above channel resistance now it is near 93K$ and after that market will face huge gain only.
Step 1: Confirm the Breakout (The "Is It Real?" Check)
Don't buy the first tiny wick above the line. Wait for confirmation to avoid a false breakout:
Daily Close: Wait for a daily candle close (UTC) decisively above the $93K trendline.
Volume Surge: The breakout should be accompanied by significantly higher buying volume than average . This shows conviction.
Follow-Through: The price should hold above the trendline and not immediately fall back in.
Step 2: The Trade Entry Strategy
Aggressive Entry: Buy on the first strong 4-hour or daily close above $93K.
Conservative Entry : Wait for a "retest" of the broken trendline. After breaking out, price often pulls back to touch the former resistance, which should now act as new support. This is a higher-probability, lower-risk entry.
Step 3: MY Bullish Targets - A Realistic Roadmap
my targets are logical and align with measured moves and previous all-time high extensions.
First Target: ~$110,000
This is the first major psychological barrier and would represent a strong resumption of the bull market.
Second Target: ~$120,000 - $125,000
This area is a common 1.618 Fibonacci extension from key swing points and represents the next significant resistance zone.
Extended Target: ~$140,000+
This is the "blue sky" target that comes into play if the bullish momentum becomes parabolic, likely fueled by a FOMO (Fear Of Missing Out) influx of new capital.
DISCLAIMER: ((trade based on your own decision))
<<press like👍 if you enjoy💚

TradeCityPro | Bitcoin Daily Analysis #237👋 Welcome to TradeCityPro!
Let’s move on to the Bitcoin analysis. The market experienced a strong drop yesterday, and with the start of a new week and a new month, a fresh trend is beginning to form.
⏳ 1-Hour Timeframe
Yesterday, we had a long trigger on Bitcoin at 91,089. After activation, the price moved upward toward 91,813.
🔔 The 91,813 level was our next long trigger, and breaking it could have pushed the price toward the main resistance at 93,555.
✔️ But that didn’t happen.
The price was rejected from 91,813, and gradually, selling pressure increased across the market.
📊 Once the price stabilized below 90,421 — which was our short trigger — the main bearish move began. Bitcoin dropped sharply with a large bearish candle all the way down to 85,770.
🔍 The support zones at 89,082 and 87,942 did not hold either, because the move was extremely sharp and the price ignored them entirely.
💥 If you remember, we also had a momentum support on the RSI at 42.11.
💫 Once RSI stabilized below that level, the bullish momentum completely disappeared. Momentum shifted fully to bearish.
⚡️ Right now, RSI is still in the oversold zone and is pulling back toward the 30 level.
⚖️ If RSI starts moving downward again from here, Bitcoin has the potential to drop much further.
💡 Today, opening a position is much riskier than yesterday, but if you missed the move, breaking 85,770 isn’t a bad option for a continuation short.
✨ Just be careful: the market today is far more risky, so take positions with smaller risk and tighter management.
❌ Disclaimer ❌
Trading futures is highly risky and dangerous. If you're not an expert, these triggers may not be suitable for you. You should first learn risk and capital management. You can also use the educational content from this channel.
Finally, these triggers reflect my personal opinions on price action, and the market may move completely against this analysis. So, do your own research before opening any position.

Understanding Discipline in TradingWelcome back everyone to another post. In today’s article we will dive deeper into the 3 keys of Trading success! As attached below.
Today we will be reviewing the Key “DISCIPLINE”
Just like risk management and Psychology this is also a difficult skill to maintain.
In the modern world it’s considered a skill now, because most of society doesn’t have any discipline in any field.
Let’s get started.
Definition:
When it comes to Trading Discipline. Trading Discipline means one user has the mental ability ( strength ) to follow their system. Their Trading Plan, risk management and maintain their psychology regardless of what events happen.
Trading Discipline separates profitable traders from the gamblers.
(Below I have attached the article Trader or Gambler as it relates to this post, make sure to give it a read!)
Discipline ensures that the user makes the right decisions based on strategy and logic instead of FOMO, ego and greed.
It is not just about following rules though. Discipline relates to the outside world of cultivating habits, mindsets and self-control too.
1) Understanding Trading Discipline
Firstly, you must truly grasp what it actually means. Most individual traders confuse it with stubbornness. They think it’s about holding on to trades or forcing a system. In reality, it’s only about consistency and self-control! Simple right?
Example:
Imagine, you have a system. A trading plan. It has the 1% rule where you don’t risk more than 1% of your account per trade. Understanding discipline means you must know why that rule is in place. It’s too protected your capital! Not breaking it after a few losses just to catch up.
Real Life Analogy:
A professional runner trains every day. They do it even when they are sad, tired, unhappy and unmotivated. This is discipline. Discipline drives long term results. Discipline is continuing it no matter what the current situation is.
2) Implementing Trading Discipline
The process of implementation is nothing complicated. It’s only turning knowledge into action. Knowing about it won’t do anything, you must maintain the effort of consistently applying it to each step in your system.
How to implement it:
- Follow your plan: Before each trading day starts, read out your system and tell yourself you will follow it. Even if no set ups appear, you will still succeed because you followed your plan.
- Set risk rules: Apply proper risk management and lot management so you don’t cave into fear. Apply the 1:3 Rule or 1:4 Rule.
- JOURNAL your TRADES Damn it: Record every trade, your reasoning, and whether you actually followed your rules. Don’t just add a screen shot and nothing else. YOU won’t succeed if you don’t journal your trades properly.
Example:
A novice trader may plan to place an entry when price is at $50 and exit at $55 with a 2% risk per trade. Even if it dips to price $48, they hold to the stop loss accepting the loss instead of moving it and hoping it “recovers”
Real Life analogy:
Think of it as budgeting every day, or for a holiday, or your next maccas run. You set a weekly budget plan and stick to it. Even when tempted by special deals, sticking to your budget allows for long term financial health to take place. Just like risk management but with real life.
3) Maintaining Trading Discipline
Discipline can’t act overnight, it’s the process of small steps working your way up to solid consistency over time. Even when feelings run high – discipline isn’t one time. It’s daily practice.
Some strategies are:
- Reviewing your previous trades daily or at the end of each week during a market close. Assess your wins and losses.
- Build up emotional awareness, be aware of what fear, greed and overconfident emotions take place.
- Reward yourself to the rules of your system, not just profitable outcomes.
If you reward yourself for not trading in one day because not a single set up appeared, you were still successful because you didn’t “force” a set up and take a gamble.
Example:
A trader might experience 3 losses in the first hour of the day, even if they were all A++ set ups. Instead of revenge trading, he sticks to his plan, accepts the L and leaves the charts for the rest of the day to reset mentally and gain a win in another field, eg – Gym.
Real-life analogy:
By maintaining a healthy lifestyle, you must apply the same approach. You don’t stop exercising after a few days off. Discipline keeps you aligned even when your motivation and mental strength fades.
4) Adapting without breaking your Discipline
Long story short, Markets move, Markets change, Markets can and WILL evolve.
Traders must adapt. Not just allows their system to adapt, but their psychological mindset of discipline.
Adapting can be confusing but it can be done by:
- Don’t switch up new strategies, adjust your current system slightly then back test and forward test it on demo accounts. Eg Paper trading.
- Update your trading system based on data and monthly results, not emotions.
- Avoid making sudden changes right after losses.
Example:
Let’s say a forex strat no longer works due to low volume and volatility. A strict trader tests adjustments in their demo accounts, then incorporates them into the plan after they have received positive data from tests.
Real-life analogy:
A chef might change his recipe based on a specific ingredient availability but will not ignore the core cooking principles. It’s about adapting strategically, not impulsively.
5) Reinforcing Discipline Through mindset and daily life.
Discipline in the trading field is just amplified by the discipline process outside of trading. It follows the exact same process. Daily habits and mindset directly impact one’s trading performance.
To reinforce discipline, you can:
- Maintain routines: Wake up at consistent times. Don’t wake up at 3:00am to “grind” if you do that, you’re stupid – you’ll burn yourself out and make the process harder.
Plan your day and review goals. Eg do a brain dump every morning, write down or type out all ideas, thoughts and emotions and sort it out.
- Practice mental training: People suggest doing personal journaling or meditation. Just go for a walk in the morning for 5 minutes. First thing in the morning, feel the fresh breeze, air, sunlight and nature. You simulate the mind and body in a natural way allowing for you to think clearly and train your mind.
- Change your environment: surround yourself with work dogs, people who are strict on routines, self-improvement, self-development, individuals who don’t slack off.
Example:
Traders who can control their time well, exercise, eat healthy can maintain their stress in trading better than one who does not focus on outside habits.
Real-life analogy:
A school student who studies consistently every day and night rather than squishing it all in before exams perform better. Just like a trader who can maintain structured habits inside and outside of the market.
Conclusion:
Trading discipline is more than following rules, it’s a mindset and a lifestyle, it relates to the world outside of trading. Just like psychology, if you can’t master it outside, you won’t master it inside.
It's about understanding your own weaknesses and adjusting the system to hold structured rules that will allow it to be more easily achievable for yourself.
Remember, trading is not sunshine and rainbows.
It’s about building a system and following it. It is the hardest way to make “ easy ” money.
To find out what the other 2 keys are, review the 3 posts below where I explain the 3 keys to trading success, and go deeper into each of them!

BITCOIN SIGNAL: THIS IS WHERE THE CRASH WILL STOP!!!? (watchout)Yello Paradisers! Enjoy the video!
We are discussing a lot of technical stuff—Elliott Wave theory. We are going through multiple time frames, and I'm updating you about the price action, development structure, and important levels, as well as what the highest probability next move is.
And Paradisers! Keep in mind to trade only with a proper professional trading strategy. Wait for confirmations. Play with tactics. This is the only way you can be long-term profitable.
Remember, don’t trade without confirmations. Wait for them before creating a trade. Be disciplined, patient, and emotionally controlled. Only trade the highest probability setups with the greatest risk to reward ratio. This will ensure that you become a long-term profitable professional trader.
Don't be a gambler. Don't try to get rich quick. Make sure that your trading is professionally based on proper strategies and trade tactics.

Bitcoin (BTC): Seeing Bullish Signs | Need To Re-Claim 100 EMAThe 100 EMA has been tested multiple times on BTC, yet buyers did not manage to fully secure this area. What we see is a continuation of attempts to break this zone completely and secure it, and as buyers are showing volume, we are looking for it to happen.
Setup looks decent; the zone of liquidity is our stop zone, where the major target is the 200 EMA as of now!
Swallow Academy

BTC/USDT 4HOUR CHART UPDATE !!BTCUSDT is consolidating within an ascending channel after a sharp bounce from lower levels, and the price is currently retracing towards mid-channel support around 88,000–87,000 USDT.
The lower boundary of the channel and horizontal levels at 88,000, 87,013, and 84,584 act as step-down support; as long as candles remain above around 84,500, this will remain a healthy corrective pullback in the short-term uptrend.
Below that, key higher-timeframe supports near 80,550, and 76,200 are the next demand zones where a deeper flush could still maintain the larger bullish structure.
The price drops towards the lower channel area, finds support, and then rotates higher for another leg up, with the green zone around 94,000–95,000 being the first major resistance on the way back towards the large grey supply above 100,000.
DYOR | NFA

Funds Are Coming Back – Will BTC Surge?Hello traders, wishing you a great day! Let’s take a look at BTCUSDT together.
If we had to name one asset that is recovering after a storm and starting to attract capital again, Bitcoin is definitely the leading candidate right now. Expectations that the Fed will soon cut interest rates are bringing risk appetite back , the USD is cooling down, and part of the capital flow is returning to crypto – therefore BTC has a solid chance to recover after the sharp drop at the end of November.
On the 12H chart, BTC remains inside a downward channel , but is moving steadily above the short-term support around 85,700, which is marked as Immediate support . The current pullback is mainly a pause to regain momentum after the first rebound, without breaking the latest lows , and is showing signs of forming a higher low.
If price continues to hold above 85,700 and forms an accumulation pattern as projected, the resistance zone 93,900 near the upper boundary of the channel and the Ichimoku cloud will be the next natural target.
Given that macro news is gradually supporting risk assets and technical signals show weakening selling pressure, I personally prefer the scenario where BTC continues to recover toward 93–94k , rather than breaking support immediately.

Fasten Your Seatbelts – The Move Toward $75,000 Has Begun🚨 Fasten Your Seatbelts – The Move Toward $75,000 Has Begun
In my previous post, I clearly warned that a regression channel breakout could trigger the next major drop in Bitcoin — and as always, the market moved exactly as predicted.
From day one, every single scenario I’ve shared on this page has played out perfectly.
No guessing, no luck — just precise technical analysis and market structure reading.
Now, in the updated chart, Bitcoin has pulled back to the top of the descending channel (marked in blue) and is starting to turn down again.
✅ 94,000 is acting as a confirmed resistance
✅ The regression channel slope remains clearly bearish
✅ The next target is around $75,000
At this stage, any short-term bounce could simply be a retest before the next leg down.
📉 The direction is clear — and if you’ve been following my work, you already know how accurate these calls have been.
🔔 Follow for more — because what I post here doesn’t just sound good…
It happens.

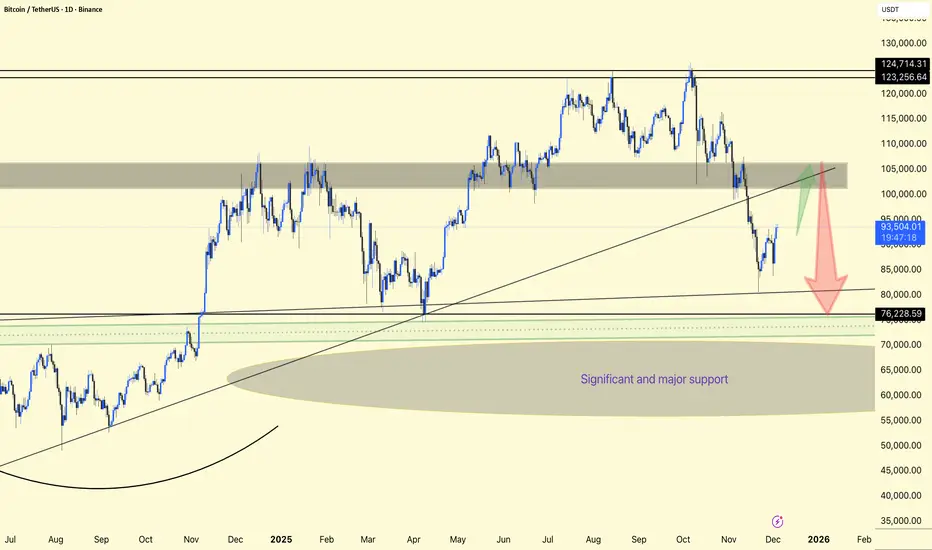
BTC/USDT 1DAY CHART ANALYSIS. Bitcoin (BTCUSDT) is in a corrective phase within a larger bullish structure, currently bouncing off support and heading back towards a large supply zone around 102,000–106,000 USDT.
The price was previously rejected from the top resistance band of 123,000–125,000 and sold off sharply, breaking mid-range support and retesting the long-term rising trendline and horizontal support around 80,000–82,000 as a key demand area.
The chart highlights a large “critical and key support” zone from around the mid-60,000s to the low-80,000s, where multiple higher-timeframe supports and rounded bases converge, making this a key zone.
After marking support, BTC has begun a relief rally towards the broken trendline and gray resistance band near 100,000–105,000; this area could serve as a decision point where either a downward continuation or a resumption of the trend is likely.
Bull Case: A strong daily close above the gray zone and reclaimed trendline would signal continuation towards 115,000 and potentially a retest of the 123,000–125,000 highs.
Bear Case: A break below 90,000 following rejection from this resistance will likely trigger another leg down towards 80,000–82,000 and, if that fails, another deep sweep into the “Significant and Major Support” region around 60,000 before a larger accumulation base can form.
DYOR | NFA
$BTC/USDT ANALYSISBitcoin on the 8-hour chart is consolidating within an ascending triangle formation, showing clear higher-low structure support near the rising trendline. The price is currently trading below both the 50-period moving average and the Ichimoku Cloud, which are acting as strong dynamic resistance levels. The highlighted red zone around 92,000–93,500 USDT represents a heavy supply area where previous rejections occurred.
As long as Bitcoin holds above the ascending trendline support near 86,000–86,500 USDT, the structure remains intact, suggesting buyers are still defending this zone. A clear breakout above the 50 MA and the 92,000 USDT resistance region would confirm a bullish continuation toward 95,000 USDT and beyond. However, failure to hold the rising support trendline could trigger a short-term correction toward 84,000 USDT before any recovery attempt.

Uptrend confirmed It's best to operate from confirmations, even when you know you're right
I have all the confirmations I need to confirm the we are in an uptrend on Bitcoin

#BTC/USDT is currently strongly bullish#BTC
The price is moving in a descending channel on the 1-hour timeframe. It has reached the lower boundary and is heading towards a breakout, with a retest of the upper boundary expected.
We are seeing a bearish trend in the Relative Strength Index (RSI), which has reached near the lower boundary, and an upward bounce is expected.
There is a key support zone in green at 88200, and the price has bounced from this level several times. Another bounce is expected.
We are seeing a trend towards stabilizing above the 100-period moving average, which we are approaching, supporting the upward trend.
Entry Price: 88900
First Target: 90000
Second Target: 91123
Third Target: 92300
Remember a simple principle: Money Management.
Place your stop-loss order below the green support zone.
For any questions, please leave a comment.
Thank you.

Is this the calm before the Bitcoin storm?Is this the calm before the Bitcoin storm?
I think if Bitcoin fails to break above $90,500, it will most likely see a major drop in the coming hours. This is my personal opinion.

BitcoinBitcoin currently traded at third corrective bullish wave from recent lower high so forcasted retracement to range from 90k to 88k with invalidation point which close daily below 86k . Target for third bullish corrective wave is 102k .

max longin BTC hereMax longing BTC here, houghts?
Price is sitting on a strong support zone with clear signs of seller exhaustion. As long as this level holds, the long setup offers a solid risk-reward. A reclaim of nearby resistance could trigger continuation upward, while a break below invalidates the idea. Open to hearing everyone’s view.

BTC$150K remains in play for $BTC. The inverse head and shoulders is still holding its structure, momentum is stabilizing, and the pattern remains valid. As long as the neckline holds, this setup has a high probability of playing out.
