BitcoinBitcoin currently traded at third corrective bullish wave from recent lower high so forcasted retracement to range from 90k to 88k with invalidation point which close daily below 86k . Target for third bullish corrective wave is 102k .
Trade ideas

max longin BTC hereMax longing BTC here, houghts?
Price is sitting on a strong support zone with clear signs of seller exhaustion. As long as this level holds, the long setup offers a solid risk-reward. A reclaim of nearby resistance could trigger continuation upward, while a break below invalidates the idea. Open to hearing everyone’s view.

BTC$150K remains in play for $BTC. The inverse head and shoulders is still holding its structure, momentum is stabilizing, and the pattern remains valid. As long as the neckline holds, this setup has a high probability of playing out.

BTC/USDT: Bulls Defend 89K as Price Eyes 96K ResistanceBTCUSDT is holding firm above its ascending trendline after defending the 89,000 support zone, preserving the broader bullish structure. The recent dip swept short-term liquidity before buyers re-entered, signaling a corrective move rather than a full reversal.
As long as price stays above 89,000, BTC has room to climb toward the 96,000 resistance zone near the weekly high. Continued higher lows and trendline respect favor upside, with consolidation phases adding strength to the bullish case.
➡️ Primary scenario: higher lows hold → continuation toward 96,000 resistance area.
❗️ Risk scenario: a break below 89,000 would invalidate the bullish setup and shift focus toward deeper support zones.


BITCOIN BULLISH NOW!BTCUSDT continues to maintain a strong bullish structure after confirming a clean Bullish CHoCH and multiple Bullish BOS signals. Price is now approaching our last buying zone (if price breaks this zone then the trend will reverse from uptrend to downtrend) at $91,200–$90,700, which remains the key area to watch.
If BTC holds this zone and shows bullish rejection, upside targets at $93,100 and $95,000 come into play as marked on the chart.
However, a break below $89,890 would invalidate the setup and signal a deeper correction.
This zone will decide whether BTC continues its bullish momentum or pulls back for further accumulation.
Always manage your risk wisely when trading volatile markets.
For more in-depth analysis, don’t forget to like and comment.

The Hidden Skill Every Great Trader Masters; And It’s Not Chart!Most traders spend years perfecting chart patterns, indicators, and entries…
Yet only a handful ever master the real skill that separates professionals from the rest, the art of waiting.
📉 Anyone can draw support and resistance.
📈 But not everyone can wait for price to reach them.
The market rewards patience, not predictions.
It’s not about catching every move, it’s about being ready when your setup aligns perfectly.
That’s when you strike. That’s when probability works for you, not against you.
Think of trading like fishing 🎣:
You don’t chase the fish, you position your line where it’s most likely to bite, then you wait.
So next time you feel the urge to jump in early, remind yourself:
You’re not just a trader. You’re a waiter, paid in precision and patience.
📚 Key takeaway:
Great traders don’t predict, they prepare.
They let the market move first, then respond with clarity.
⚠️ Disclaimer: This is not financial advice. Always do your own research and manage risk properly.
All Strategies Are Good; If Managed Properly!
~Richard Nasr

$BTC Floating in an Imbalance ZoneCRYPTOCAP:BTC is sitting inside a mid-range LVN cluster.
Price is around 89.6k, right on the edge of a thin LVN band. This isn’t a high-volume acceptance zone, so there’s no real stability — price is basically floating in an imbalance pocket, and volatility can snap either way.
If we hold above the 89k-88k, we could see a rotation back toward 95–97k to rebalance into the upper LVN.
But if 88k gives out, a quick drop toward 87.5–86.5k is likely. This would be your ideal long sweep zone.
Note: LVNs rarely act as strong support. When they break, the move usually accelerates. The downside magnet becomes the 87–86.5k HVN base — the ideal sweep zone for longs.

BTCUSDT.P - December 3, 2025Bitcoin is attempting to reverse from a prior downtrend, trading above a short-term rising trendline and pushing into a key resistance band around 93,000–94,300. The chart highlights a bullish scenario targeting the 112,000 area if price can clear this resistance and hold above the stop zone near 97,800. A failure to break and sustain above resistance, coupled with a break below the trendline, would favor a corrective move back toward the 87,300 profit level marked on the chart. Momentum is improving but remains vulnerable around resistance, making this a pivotal area for trend confirmation.

BTC/USDT 4H Chart 🔍 MARKET STRUCTURE
The chart shows a broad ascending channel in which BTC has been moving for several days:
Lower trend support: ~$87,500 – $88,000
Upper trend line: ~$94,500 – $95,000
The price has clearly rebounded from around $89,200, an important demand level.
📈 KEY LEVELS
Support
USD 89,284 – local support from which a rebound occurred
USD 87,804 – the next, much stronger support level consistent with the trendline
Resistance
USD 91,466 – currently being tested
USD 94,141 – key resistance and the upper band of the channel
📊 CHART SITUATION (4 hours)
1. Price action
The price has made a strong upward impulse from support at USD 89,280.
It is currently reaching local resistance at USD 91,450 – USD 91,700.
If this level is broken, the target is USD 94,000 – USD 94,500.
If it fails, a pullback to USD 90,200/USD 89,300 can be expected.
📉 MACD
Your MACD shows:
Bullish crossover – buy signal.
The histogram changes from red to green → momentum is increasing.
The curves are diverging, confirming the strength of the move.
This indicates that the short-term trend is turning bullish.
📌 TWO TRADING SCENARIOS
🟢 BULLISH Scenario (more likely)
Condition: H4 candle breakout and close above USD 91,700.
Targets:
TP1 → USD 92,800 – USD 93,200
TP2 → USD 94,000 – USD 94,500 (upper channel)
Stop-loss (if you were going long):
below USD 90,500
Safer below USD 89,280
MACD confirms this scenario.
🔴 BEARISH Scenario
Condition: rejection of USD 91,700 and a close below USD 90,500.
Targets:
TP1 → USD 89,300
TP2 → USD 87,800 (key trendline)
A drop to USD 87,800 would be an ideal place for large players to buy again.

BTC Update – DecemberBitcoin continues to trade within its corrective structure, gradually moving toward the key $72,000 liquidity zone. This level remains our primary target before the market potentially confirms a strong bullish reversal.
As highlighted in our previous analysis, this correction is a normal part of market structure and may serve as the final pullback before the next major upward leg.

Daily Bitcoin Trade | Short | Sunday | Dec/07/2025Hi Guys. I think Bitcoin could move down a little bit more.
Lev:43x
En: 89566
Sl: 90934
Tp: 87466
This is my personal setup. may fail. please manage your capital and risk.


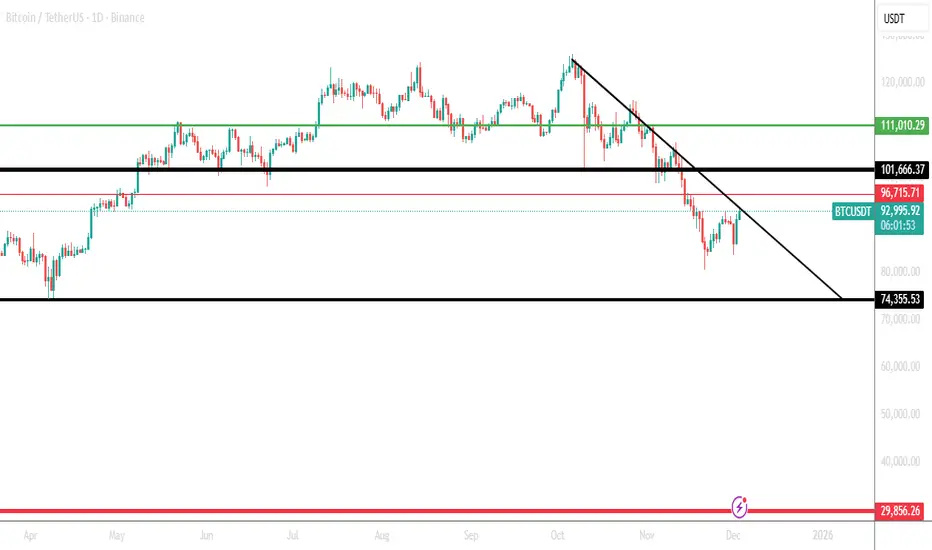
Bitcoin needs to break above the 101–103k zone.Bitcoin needs to break above the 101–103k zone.
If it manages to do that, the next target would be around 111k.
If it does not reach that level and does not break the downward trendline, then the next important level is 73k.
This area is likely to be strongly defended by investors to prevent the price from reaching it or falling below it.
If the price drops below that zone, then the bottom for the next cycle would be around 30k.
This is purely a technical analysis view.
If I personally wanted to invest, I would focus on prices that include the digit “5” in Bitcoin’s price.
I would be looking to enter at:
105k
135k in case of further upside
75k
35k in case of deeper downside
These levels are not guesses and not the result of a simple mathematical formula.
They come from a technical view of Bitcoin.
After Bitcoin broke below the 50-week moving average the week before last, the price quickly dropped by about 20%.
Right now, Bitcoin is breaking the 200-period moving average consecutively on the 3-hour timeframe. This is a positive sign, and it is also forming a low followed by a higher low. Along with the volume, this is creating a positive divergence.
But my final assessment to the question:
“Has the bearish wave really reversed now?”
My answer is: 0 out of 3.
That is my honest answer, not based on emotion or trying to please anyone.
In the end, and always: this is not investment advice.
Note: I am only translating and polishing your own analysis here, not adding any investment recommendation from my side.
FED RATE CUT idea - bull trapA head-and-shoulders setup suggesting a potential Fed rate cut on December 10, followed by a fake-out (bull trap).

How to choose what to invest inHow to choose what to invest in: a practical checklist for traders and investors
Many beginners start with the question “What should I buy today?” and skip a more important one: “What role does this money play in my life in the next years?”
That is how portfolios turn into random collections of trades and screenshots.
This text gives you a compact filter for picking assets. Not a magic list of tickers, just a way to check whether a coin, stock or ETF really fits your time horizon, risk and skill level.
Start from your life, not from the chart
Asset selection starts before you open a chart. First, you need to see how this money fits into your real life.
Three simple points help:
When you might need this money: in a month, in a year, in five years.
How painful a 10, 30 or 50 % drawdown feels for you.
How many hours per week you truly give to the market.
Example. Money is needed in six months for a mortgage down payment. A 15 % drawdown already feels terrible. Screen time is 2 hours per week. In this case, aggressive altcoins or heavy leverage look more like a stress machine than an investment tool.
Another case. Ten-year horizon, regular contributions, stable income from a job, 30 % drawdown feels acceptable. This profile can hold more volatile assets, still with clear limits on risk.
Filter 1: you must understand the asset
First filter is simple and strict: you should be able to explain the asset to a non-trader in two sentences.
The label is less important: stock, ETF, coin or future. One thing matters: you understand where the return comes from. Growth of company profit. Coupon on a bond. Risk premium on a volatile market. Fees and staking rewards in a network.
If your explanation sounds like “price goes up, everyone buys”, this is closer to magic than to a plan. Better to drop this asset from the list and move on to something more clear.
Filter 2: risk and volatility
The market does not care about your comfort. You can care about it by choosing assets that match your stress level.
Key checks:
Average daily range relative to price. For many crypto names, a 5–10 % daily range is normal. Large caps in stock markets often move less.
Historical drawdowns during market crashes.
Sensitivity to events: earnings, regulator news, large players.
The sharper the asset, the smaller its weight in the portfolio and the more careful the position size. The same asset can be fine for an aggressive profile and a disaster for a conservative one.
Filter 3: liquidity
Liquidity stays invisible until you try to exit.
Look at three things:
Daily traded volume. For active trading, it is safer to work with assets where daily volume is many times larger than your typical position.
Spread. Wide spread eats money on both entry and exit.
Order book depth. A thin book turns a big order into a mini crash.
Filter 4: basic numbers and story
Even if you are chart-first, raw numbers still help to avoid extremes.
For stocks and ETFs, it helps to check:
Sector and business model. The company earns money on something clear, not only on a buzzword in slides.
Debt and margins. Over-leveraged businesses with thin margins suffer in stress periods.
Dividends or buybacks, if your style relies on cash coming back to shareholders.
For crypto and tokens:
Role of the token. Pure “casino chip” tokens rarely live long.
Emission and unlocks. Large unlocks often push price down.
Real network use: transactions, fees, projects building on top.
Build your personal checklist
At some point it makes sense to turn filters into a short checklist you run through before each position.
Example:
Time. I know the horizon for this asset and how it fits my overall money plan.
Risk. Risk per position is no more than X % of my capital, portfolio drawdown stays inside a level I can live with.
Understanding. I know where the return comes from and what can break the scenario.
Liquidity. Volume and spread allow me to enter and exit without huge slippage.
Exit plan. I have a level where the scenario is invalid and levels where I lock in profit, partly or fully.
Connect it with the chart
On TradingView you have both charts and basic info in one place, which makes this checklist easier to apply.
A typical flow:
Use a screener to find assets that match your profile by country, sector, market cap, volatility.
Open a higher-timeframe chart and see how the asset behaved in past crashes.
Check liquidity by volume and spread.
Only then search for an entry setup according to your system: trend, level, pullback, breakout and so on.
Before clicking the button, run through your checklist again.
Common traps when choosing assets
A few classic traps that ruin even a good money management system:
Blindly following a tip from a chat without knowing what the asset is and why you are in it.
All-in on one sector or one coin.
Heavy leverage on short horizons with low experience.
Averaging down without a written plan and clear risk limits.
Ignoring currency risk and taxes.
This text is for educational purposes only and is not investment advice. You are responsible for your own money decisions.

BTCUSDT Reversal Play: My High-Probability Short Setup ## 🟠 BTCUSDT Reversal Play: My High-Probability Short Setup with Defined Risk
### 🧠 Why I’m Taking This Trade
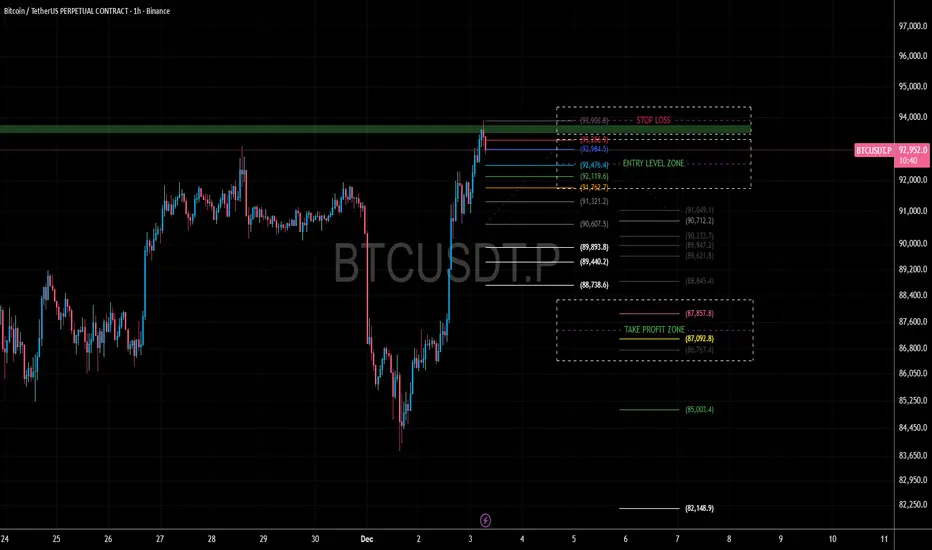
I’m positioning for a **short trade** on BTCUSDT after observing a sharp upward move followed by signs of exhaustion and a potential reversal. The recent rally pushed price into a zone where I expect sellers to step in. My goal is to catch the retracement while keeping risk tightly controlled.
I’m entering between **92,284.5 and 92,826.5**, which is a zone I’ve identified as a likely turning point. This area aligns with previous resistance and shows signs of rejection on lower timeframes.
### 🔍 What I’m Seeing on the Chart
- **Current Price**: 92,897.6
- **Recent High**: 93,903.8
- **Entry Zone**: 92,284.5 to 92,826.5
- **Stop Loss**: 93,903.8
This is placed just above the recent high to protect against a breakout continuation.
- **Take Profit Zone**: 86,767.4 to 87,857.8
These levels are based on prior support zones and Fibonacci retracement targets.
### 📊 Risk vs Reward
This setup offers a strong edge. I’m risking about **1,077 points** (from 92,826.5 to 93,903.8) to potentially gain **4,969 to 6,059 points** (down to the TP zone). That gives me a **risk-reward ratio between 4.6 and 5.6**, which is excellent for a swing short.
### 🧭 My Strategy in Simple Terms
- I’m not shorting blindly—I’m waiting for price to enter a zone where sellers have previously shown strength.
- My stop is placed above the recent high, so if price breaks that level, I know the setup is invalid.
- My targets are realistic and based on previous support zones where buyers may re-enter.
This is a **structured, disciplined trade** with clear boundaries. I’m not guessing—I’m following a plan based on price behavior, structure, and risk control.
Bitcoin - 66k in 2026 (but first a pump - watch this!)Bitcoin has been going down drastically, as I expected many, many weeks in advance. But this is not the end of the crash! We will see lower prices in 2026, specifically 66k and possibly 50k later in Q3 2026. This is my long-term vision, but in the short term I think Bitcoin should go up to retest the previous long-term trendline and the previous falling wedge pattern at 97k! Usually after a breakout/breakdown, we want to see a retest. These retests are very important because they give us a chance to sell Bitcoin at a better price and also to short Bitcoin on the futures market.
Bitcoin did some pretty crazy movements in the past weeks, regardless of the seasonality patterns. Statistically Bitcoin is extremely strong in October and November—but this time it was the opposite. Even though seasonality patterns are helpful, you always need to look for more indicators and fundamentals. Moonboys that were screaming for 200k and 500k got liquidated, and soon they will disappear from the market for good. I have been trading for almost 10 years, and I have experienced many crypto crashes, and the moonboys are always here at the top. When I was bearish at 120k, everyone was screaming in the comment section and even spitting on my bearish predictions.
So my plan for the next Bitcoin movements is as follows: First, Bitcoin should retest the 97k level (this will take some time). After that we should see another big leg to the downside to 66k.
Write a comment with your altcoin + hit the like button, and I will make an analysis for you in response. Trading is not hard if you have a good coach! This is not a trade setup, as there is no stop-loss or profit target. I share my trades privately. Thank you, and I wish you successful trades!

Next Week sorted before Next WeekAs I analysed earlier, BTC was going to grab 88K, and I did that beautifully. I took another long in that same region and it hit my TP almost immediately. It's just about understanding how liquidity is pooled and how market makers plan to grab them and trade in sync, and not about some buying or selling pressure. No fancy drawings, just pure understanding and some balls of steel. My profits for the week are sorted so I can afford to chill and see what the market is trying to do next.

BTC updates
Here’s the Bitcoin result as well: it has gained 4%, and as expected, the 90,500 level pushed the price upward with high precision.
If you’d like to see more of my analyses, make sure to follow.


Still more upside for BitcoinHi traders,
Last week Bitcoin made a correction down and went up again as I've said in my previous outlook.
Now we could see more upside at least to the bearish Weekly FVG above after the finish of the correction down.
Let's see what the market does and react.
Trade idea: Wait for a small correction down on a lower timeframe and a change in orderflow to bullish to trade longs.
This shared post is only my point of view on what could be the next move in this pair based on my technical analysis.
But I react and trade on what I see in the chart, not what I've predicted or expect.
Don't be emotional, just trade your plan!
Eduwave

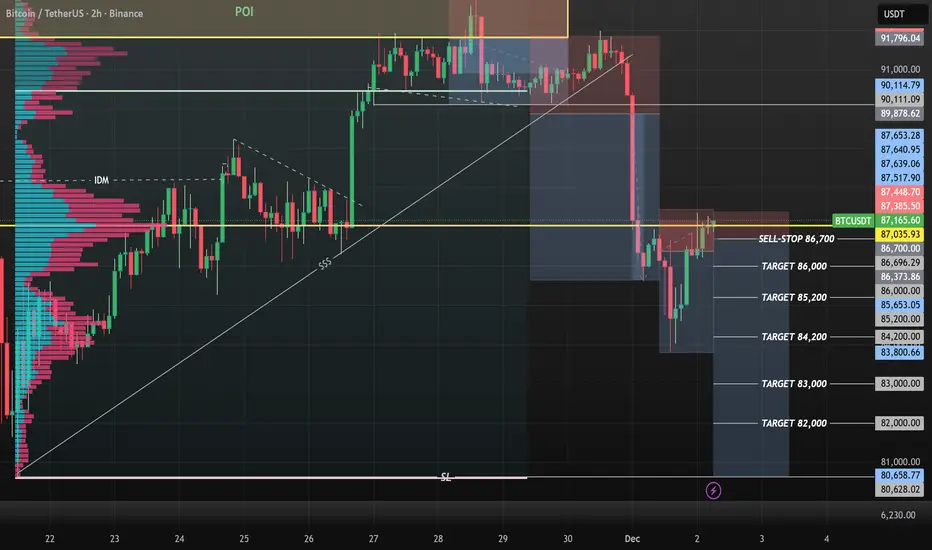
BTCUSD SELL WITH SELL-STOP ORDER!!!BTCUSD completed +2,000pips from my yesterdays analysis and predictions today we have price still ranging at my POC point level am looking forward to sell from 86,700 area using min confirmations under my POC key level to sell from there to 80k.....