FCX trade ideas


Short FCX following Fibonacci PinballThis 30m chart of FCX shows the stock pin-balling between Fibonacci retracement levels since its drop at the end of April. Look at how well the 38.2%, 50%, and 61.8% levels have acted as short-term resistance/support. I'm counting the rally as an WXY correction into the 61.8% retracement level. Initiating a short position at 17.50 for a move lower.

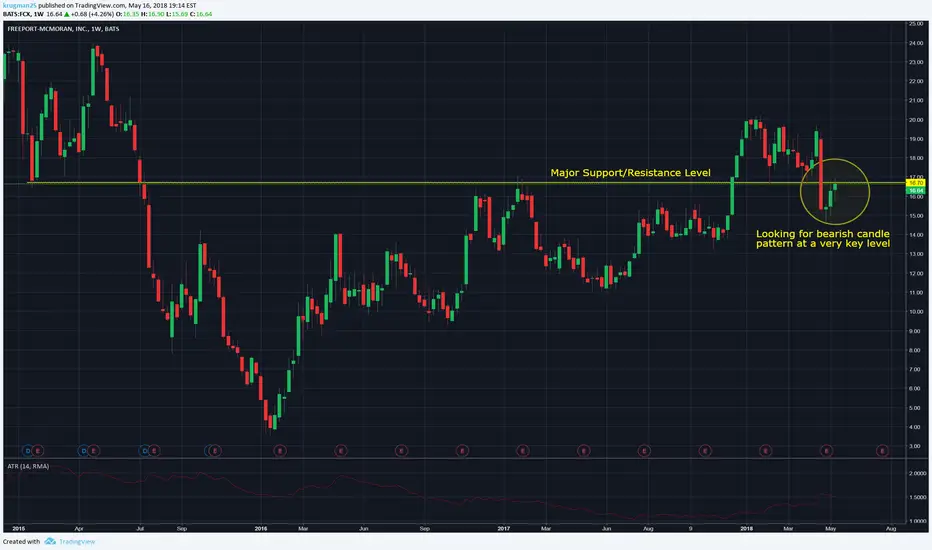
FCX - Key resistance level reached & watching for bearish entryAfter a strong bearish move price has pull back to a key resistance level of 16.70 -17.00. This is a key area to begin watching for bearish price action in the form of bearish pin bar, engulfing bar, evening star, etc. The next key support level below is 14.00 which makes a good profit taking level and could make for an attractive risk/reward scenario.
An aggressively bearish position could be short stock or a moderately bearish position with some insurance would be to sell the 18 strike calls.

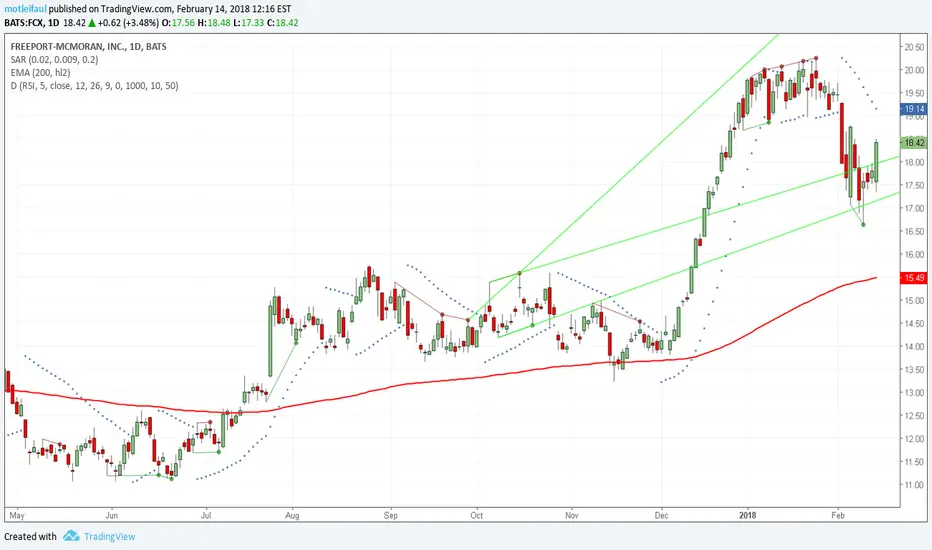
FCX Channel PlayFCX has been trading in a well defined channel since January 2016. Every bottom test of the channel has been a buying opportunity. Once such opportunity appears to be fast approaching. Coincidentally, the 200 day SMA is hovering near the bottom of the channel. I would feel comfortable going long right around the bottom of the channel/200 day support.

double bottom with 3/4 pullbackNice double bottom with 3/4 pullback to the 61.8 retracement. this gives me every indication this is bullish, also conjunction with the trend

Is this a bearish chart?Hello all
Hope you guys are having a fantastic weekend. Take a look at FCX and see if it is bearish. I overlayed it with AUDUSD. FCX is testing weekly kijun and major breakout level. I'll go long on any reversal signal here. Keep a close eye on audusd. I am watching both. AUDUSD is also on weekly cloud bottom. A breakout here, will be bearish but if it holds, bullish. Just wanted to point out some key levels.
Thank you for the read.
Take care
RetracedWe are still in a clear uptrend. The corrections are becoming shorter. If this one will end here it will be a clear sign of a continuing rise.


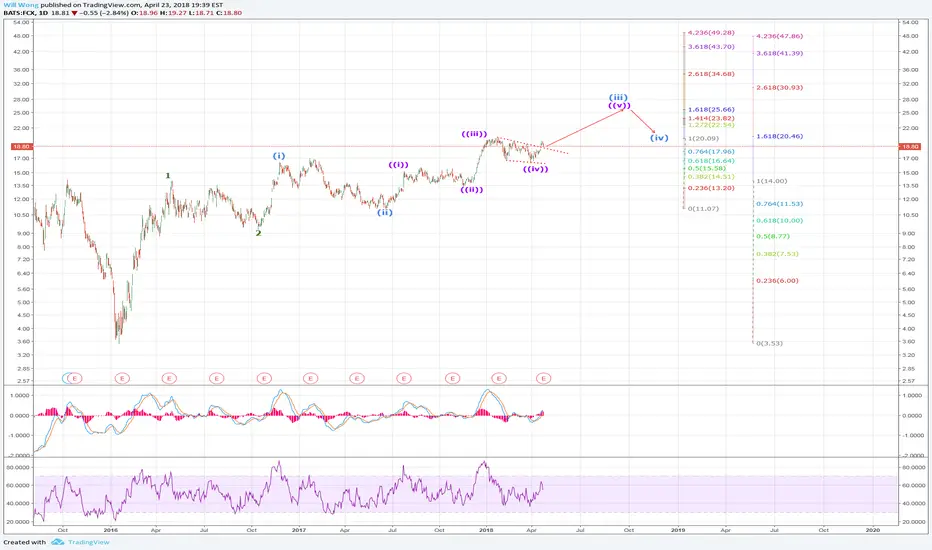
FCX - KEY LEVELAttempt to storm the key level $ 20. FCX 2.40% is one of the shares, which shows a propensity for growth, against the general background of its slowdown.
Two variants of the development of events are shown above in the graph.
We will transfer the position to the breakeven, in case of a price delay near the key level.
P/E 15.90
Forward P/E 13.86
Open 19.49
SL 18.93
TP 21.73

CorrectedWe are just meeting a resistance. The Fibonacci levels are not yet reached but as this rising support is lasting for half a year already I think that it is worth to take a posion on the trend here.

Survivor of the biggest point drop In History #10 (FCX)The majority of the last 10 ideas look similar. (Price Patterns) (Resistance Breakouts) and in different Industries, from basic materials to Finance Industry.
But the pullback is different in each one In this case the pullback is ready with a swing low in progress.
The process for share and idea is:
* Resistance line breakout
* Pullback
* Swing low


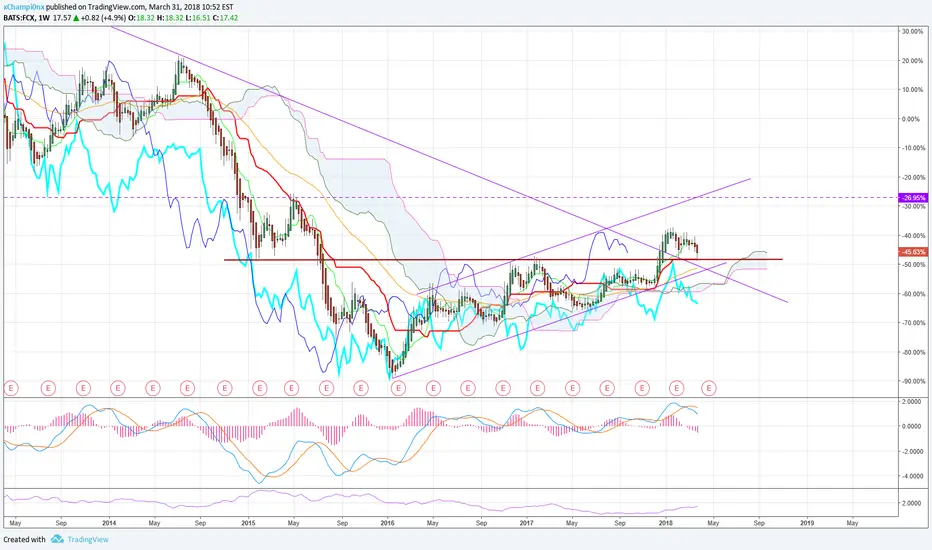
Always check the long termLong term charts show previous support and breaks to avoid chasing, even better, all data long term, this broke fast as the weekly slowly rolled over but we can see the -ve divergence on the daily as recent highs were attempted while the RSI failed at 61.8 and the hourly at 50, both declining, if not in on the short before the break, watch your entry as potential support isn't far
away at $17 area


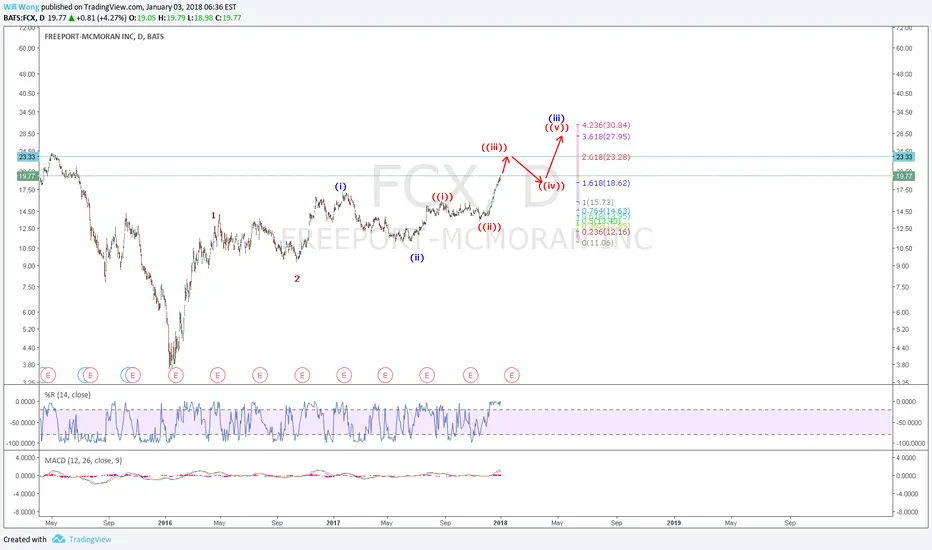
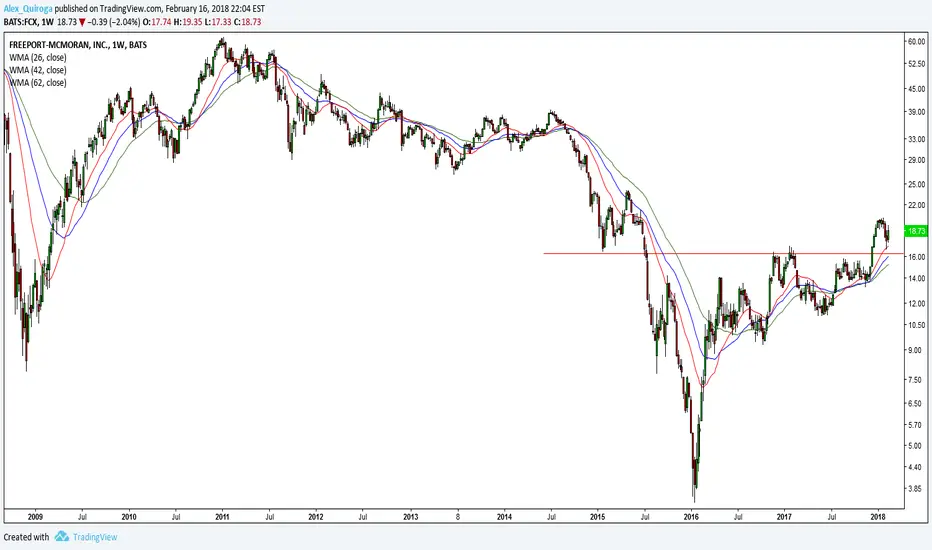
Freeport-McMoran stock to multiply 3x, at $20 now targets $60Freeport-McMoran Copped & Gold has put in a solid bottom at an important support level, with strong underlying fundamentals. This should now test upside resistance level above $60.

freeport #quarterforshortLongterm i am looking to be long but right now i will place a short at 18,64 and see if i cant some money on the way to my buy limits. placed a quarte position so not risjing too much either. #Trade618Pro, #entrylevels

Freeport LongsShout out to #backstagenews for looking out. fundamentals look good. future potential. Longterm Long. Looking to enter at lowest target 15,86, next 16,67 then 17,52 as closest target. soft targets are 24, 31, 38. #waitandsee #Trade618Pro #takeitorleaveit
