$V$V – Market Review 💳📈
Our chart shows buyers are still willing to pay a premium for Visa demand remains strong, and price continues to respect higher support levels. That’s a signal of confidence.
However, I’m not seeing enough momentum yet for buyers to push above $360.
Why?
📌 Tariffs + tighter
Key facts today
Next report date
—
Report period
—
EPS estimate
—
Revenue estimate
—
8.161 CHF
15.98 B CHF
31.86 B CHF
1.69 B
About Visa Inc.
Sector
Industry
CEO
Ryan McInerney
Website
Headquarters
San Francisco
Founded
1958
ISIN
US92826C8394
FIGI
BBG006TLX3S5
Visa, Inc. engages in the provision of digital payment services. It also facilitates global commerce through the transfer of value and information among a global network of consumers, merchants, financial institutions, businesses, strategic partners, and government entities. It offers debit cards, credit cards, prepaid products, commercial payment solutions, and global automated teller machines. The company was founded by Dee Hock in 1958 and is headquartered in San Francisco, CA.
Related stocks

VisaNYSE:V is forming a bull flag
weekly 9/21 EMAs and 50 SMA are supporting
daily 9/21 EMAs and 50/200 SMAs are supporting
NYSE:AXP earnings were good and that is a positive sign for Visa
I am bullish.
very good R/R with stops on weekly close below 50 SMA

Visa Breakout Strategy: Potential Upside After Consolidation
Current Price: $341.89
Direction: LONG
Targets:
- T1 = $360.00
- T2 = $375.00
Stop Levels:
- S1 = $330.00
- S2 = $318.00
**Wisdom of Professional Traders:**
This analysis draws from thousands of professional traders who closely monitor Visa’s stock and sector dynamics. Market

**Trade Alert: $V NOV 07 2025 $345 CALLS – 37% ROI Target in 3 WEnter: $V NOV 07 2025 $345 CALLS
Buy in Price: $9.05 - $9.10
Take Profit: $12.47
Stop Bleeding: $8.01
ROI Potential: 37%
Exit Within: 3 Weeks

VISA Stock AnalysisVisa Inc. is a leading global payments technology company. It doesn’t issue credit cards itself, nor does it extend credit to consumers; instead, it provides the infrastructure and network (VisaNet) that enables payments between consumers, merchants, financial institutions, and governments in over 2

V - Can we see a new ATH?=======
Volume
=======
-Neutral
==========
Price Action
==========
- Price broke out of falling wedge
- Rounded bottom observed
- Triple bottom observed
=========
Oscillators
=========
- Ichimoku, price above cloud, green kumo expanding, base + conv + lagging piercing clouds upwards
- MACD bull

Visa looking for a new pumpgot out of the flag dead bounce looking to start a new cycle.
the true play is to load up over the next 3 days, hoping for green candles.
red will reverse the play but 3 greens = super bull case
we want to retest ath

Visa stock analysisVisa stock is showing signs of weakness as price approaches a possible death cross.
the uptrend line that has supported the advance for months. The structure suggests this trendline may be vulnerable to a break, which would mark a potential shift in momentum.
Based on the structure, I think Visa c

VISA BACK TO 370 BY 2026 Why Visa (V) Could Hit $370 by 2026: Payments Powerhouse Bull Case Visa’s trading at ~$344 today (Sep 23, 2025), up 15% YTD on digital payments surge, but with EPS climbing 12%+ and global transaction volumes booming, $370 (8% upside) by EOY 2026 is a low-bar target for this steady climber. Here’s t

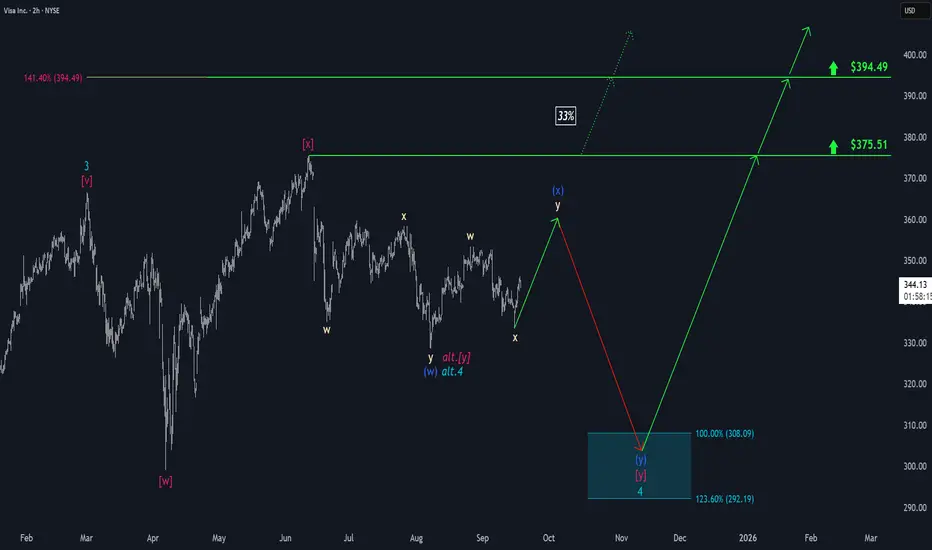
Visa: Corrective Upward MoveIn our primary scenario, we place Visa in the corrective upward move of blue wave (x). After the top, we expect the broader downward trend of turquoise wave 4 to take hold, which should push the stock into our turquoise Target Zone between $308.09 and $292.19. At that level, we anticipate a sustaine
See all ideas
Summarizing what the indicators are suggesting.
Neutral
SellBuy
Strong sellStrong buy
Strong sellSellNeutralBuyStrong buy
Neutral
SellBuy
Strong sellStrong buy
Strong sellSellNeutralBuyStrong buy
Neutral
SellBuy
Strong sellStrong buy
Strong sellSellNeutralBuyStrong buy
An aggregate view of professional's ratings.
Neutral
SellBuy
Strong sellStrong buy
Strong sellSellNeutralBuyStrong buy
Neutral
SellBuy
Strong sellStrong buy
Strong sellSellNeutralBuyStrong buy
Neutral
SellBuy
Strong sellStrong buy
Strong sellSellNeutralBuyStrong buy
Displays a symbol's price movements over previous years to identify recurring trends.
3V69
Visa Inc. 3.65% 15-SEP-2047Yield to maturity
5.26%
Maturity date
Sep 15, 2047
3V68
Visa Inc. 4.3% 14-DEC-2045Yield to maturity
5.22%
Maturity date
Dec 14, 2045
US92826CAQ5
Visa Inc. 2.0% 15-AUG-2050Yield to maturity
5.20%
Maturity date
Aug 15, 2050
V4972835
Visa Inc. 2.7% 15-APR-2040Yield to maturity
4.95%
Maturity date
Apr 15, 2040
US92826CAE2
Visa Inc. 4.15% 14-DEC-2035Yield to maturity
4.54%
Maturity date
Dec 14, 2035
3V67
Visa Inc. 3.15% 14-DEC-2025Yield to maturity
4.45%
Maturity date
Dec 14, 2025
V4972836
Visa Inc. 2.05% 15-APR-2030Yield to maturity
3.97%
Maturity date
Apr 15, 2030
V5028512
Visa Inc. 1.1% 15-FEB-2031Yield to maturity
3.94%
Maturity date
Feb 15, 2031
XS306372505
Visa Inc. 3.875% 15-MAY-2044Yield to maturity
3.83%
Maturity date
May 15, 2044
V4972834
Visa Inc. 1.9% 15-APR-2027Yield to maturity
3.80%
Maturity date
Apr 15, 2027
3V6A
Visa Inc. 2.75% 15-SEP-2027Yield to maturity
3.79%
Maturity date
Sep 15, 2027
See all 3V64 bonds
Curated watchlists where 3V64 is featured.


Frequently Asked Questions
The current price of 3V64 is 275.027 CHF — it has increased by 1.21% in the past 24 hours. Watch Visa Inc. Class A stock price performance more closely on the chart.
Depending on the exchange, the stock ticker may vary. For instance, on BX exchange Visa Inc. Class A stocks are traded under the ticker 3V64.
3V64 stock has fallen by −0.57% compared to the previous week, the month change is a 1.64% rise, over the last year Visa Inc. Class A has showed a 9.55% increase.
We've gathered analysts' opinions on Visa Inc. Class A future price: according to them, 3V64 price has a max estimate of 360.12 CHF and a min estimate of 260.08 CHF. Watch 3V64 chart and read a more detailed Visa Inc. Class A stock forecast: see what analysts think of Visa Inc. Class A and suggest that you do with its stocks.
3V64 reached its all-time high on Mar 3, 2025 with the price of 331.045 CHF, and its all-time low was 176.283 CHF and was reached on Sep 30, 2022. View more price dynamics on 3V64 chart.
See other stocks reaching their highest and lowest prices.
See other stocks reaching their highest and lowest prices.
3V64 stock is 1.48% volatile and has beta coefficient of 0.87. Track Visa Inc. Class A stock price on the chart and check out the list of the most volatile stocks — is Visa Inc. Class A there?
Today Visa Inc. Class A has the market capitalization of 533.28 B, it has increased by 0.33% over the last week.
Yes, you can track Visa Inc. Class A financials in yearly and quarterly reports right on TradingView.
Visa Inc. Class A is going to release the next earnings report on Jan 22, 2026. Keep track of upcoming events with our Earnings Calendar.
3V64 earnings for the last quarter are 2.37 CHF per share, whereas the estimation was 2.36 CHF resulting in a 0.40% surprise. The estimated earnings for the next quarter are 2.51 CHF per share. See more details about Visa Inc. Class A earnings.
Visa Inc. Class A revenue for the last quarter amounts to 8.54 B CHF, despite the estimated figure of 8.46 B CHF. In the next quarter, revenue is expected to reach 8.56 B CHF.
3V64 net income for the last quarter is 4.05 B CHF, while the quarter before that showed 4.14 B CHF of net income which accounts for −2.09% change. Track more Visa Inc. Class A financial stats to get the full picture.
Yes, 3V64 dividends are paid quarterly. The last dividend per share was 0.48 CHF. As of today, Dividend Yield (TTM)% is 0.68%. Tracking Visa Inc. Class A dividends might help you take more informed decisions.
Visa Inc. Class A dividend yield was 0.69% in 2025, and payout ratio reached 23.14%. The year before the numbers were 0.76% and 21.69% correspondingly. See high-dividend stocks and find more opportunities for your portfolio.
EBITDA measures a company's operating performance, its growth signifies an improvement in the efficiency of a company. Visa Inc. Class A EBITDA is 22.36 B CHF, and current EBITDA margin is 69.44%. See more stats in Visa Inc. Class A financial statements.
Like other stocks, 3V64 shares are traded on stock exchanges, e.g. Nasdaq, Nyse, Euronext, and the easiest way to buy them is through an online stock broker. To do this, you need to open an account and follow a broker's procedures, then start trading. You can trade Visa Inc. Class A stock right from TradingView charts — choose your broker and connect to your account.
Investing in stocks requires a comprehensive research: you should carefully study all the available data, e.g. company's financials, related news, and its technical analysis. So Visa Inc. Class A technincal analysis shows the sell today, and its 1 week rating is sell. Since market conditions are prone to changes, it's worth looking a bit further into the future — according to the 1 month rating Visa Inc. Class A stock shows the buy signal. See more of Visa Inc. Class A technicals for a more comprehensive analysis.
If you're still not sure, try looking for inspiration in our curated watchlists.
If you're still not sure, try looking for inspiration in our curated watchlists.