GM 5/13/2023GM
Running out of fuel.
Daily chart analysis
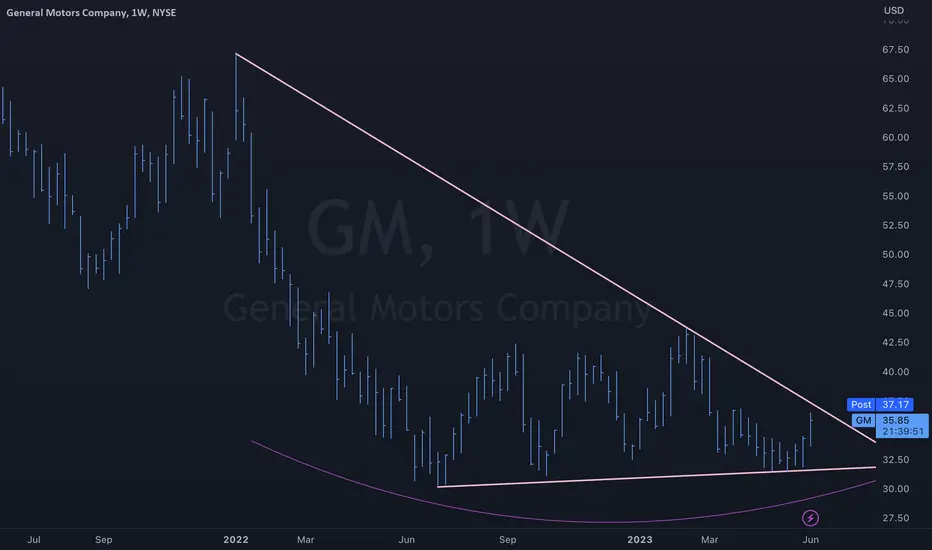
After reaching all-time lows during start of Covid back in March 2020, GM went to reach all-time highs by June 2021. All that fake money that was printed during covid sent the stock market soaring.
By December 2021, GM ran out of fumes and couldn’t break the all-time highs and a Double top pattern was formed.
To start in February 2022, price broke from the Double top neckline. The Double top pattern was then confirmed, and price entered a downtrend.
By mid-2022, price entered a Distribution stage and has been moving sideways since.
Today price finds itself breaking thru the support levels of the sideways range. It looks like the Distribution stage is complete and price will look to continue its downtrend.
There was a previous downtrend, followed by a sideways range, and now a breakdown below of support level. This is my cue to enter trade short.
Entering trade short.
Entry: 32.40
Stoploss: 35.50 (-9.64%)
Target: 20.00 (+38.23%), 3.97 RR Ratio
8GM trade ideas

GM General Motors Company Options Ahead of EarningsAnalyzing the options chain of GM General Motors Company prior to the earnings report this week,
I would consider purchasing the 45usd strike price Calls with
an expiration date of 2024-1-19
for a premium of approximately $1.14.
If these options prove to be profitable prior to the earnings release, I would sell at least half of them.
I am interested to hear your thoughts on this strategy.

General Motors to ChargePoint Trading at Bearish Shark PCZI think that these two stock will trade in opposite directions to each other, so I am tracking the ratio between the two stocks, and it looks like General Motors has just about hit the limit to the amount of ChargePoint shares it will be able to buy, and so I expect a decline in GM price and a Rise in ChargePoint's price from here.

General Motors: Bear Flag Bearish BacktestGeneral Motors after getting the TSLA Charging Plug collaboration news was able to generate enough energy to come back up to test the Bearish Channel and 55 Week EMA and from there it got a moderate rejection from it. This could be just the start of a greater move down to the zone between the 0.786 and 0.886 Fibonacci Retraces.
I could aslo see a scenario as to where GM and Ford Motors comes down as the Charging Station Stocks such as ChargePoint and maybe Blink rebound back up, as the moves between these after the news report were opposite of each other and they have two opposing setups.

$GM wedge pattern NYSE:GM bottoming pattern that started last year and wedge pattern ready to break out.
GM - DIVIDENT FALLOUT PATTERNGeneral Motors, a multinational corporation based in the United States, was the leading automobile company for 77 years until Toyota surpassed it in 2008. Despite this, GM has consistently ranked among the top 15 companies on the Fortune 500 list, and recently moved up from No. 8 to No. 5. With operations in eight countries and four brands, GM is also involved in joint ventures with Chinese automakers and produces military vehicles for the US government. Left with only four car brands for serial production the sales are taking steep downhill. The chart shows the last 3 dividend payouts and a significant 25% drop weeks after. To see if that is a solid pattern there is testing the current dividend payout we can have two level checkpoints $29' and $26', let's say that reaching the $29 level around mid-June could seek $26 by the first week of July.
Risk Disclosure: Trading Foreign Exchange (Forex) and Contracts of Difference (CFD's) carries a high level of risk. By registering and signing up, any client affirms their understanding of their own personal accountability for all transactions performed within their account and recognizes the risks associated with trading on such markets and on such sites. Furthermore, one understands that the company carries zero influence over transactions, markets, and trading signals, therefore, cannot be held liable nor guarantee any profits or losses.


General Motors Monthly Log Chartmomentum breaking down below 3 year moving average
General Motors sitting on "volume defined" equilibrium.
Bias is bearish unless it can get back above the "wake up" line.
#generalmotors #gm #dji #spx

GM - BULLISH SCENARIOEarlier this month the company disclosed first quarter US deliveries rose 18% to 603,208 vehicles, with the automaker growing its US market share by an estimated 1.5%, the largest of any company in the industry, GM said.
GM also reported record electric vehicle deliveries of 20,670, though most of those were for the Chevrolet Bolt EV and EUV — GM only delivered two Hummer EV pickups and 968 Cadillac LYRIQ EVs. Analysts and investors will be keen to hear more about GM’s EV ramp-up; GM is expected to launch three more EVs — the Chevrolet Equinox, Blazer, and Silverado EV pickup.
The next price target is located at the $ 45 resistance level.
Risk Disclosure: Trading Foreign Exchange (Forex) and Contracts of Difference (CFD's) carries a high level of risk. By registering and signing up, any client affirms their understanding of their own personal accountability for all transactions performed within their account and recognizes the risks associated with trading on such markets and on such sites. Furthermore, one understands that the company carries zero influence over transactions, markets, and trading signals, therefore, cannot be held liable nor guarantee any profits or losses.

GM: Sell ideaOn GM as you see on the chart we have the breakout of vwap and the support line so it's mean that we will have a big probability to have a downtrend.Thanks!

GM General Motors Pre Earnings LONGGM is on a 4H chart. Fundamentally, the last earnings were good. GM is challenged by the adoption
of electric vehicles and the transformation of its core business. Small EV companies ( CANOO, RIDE, WKHS, FFIE, MULN)
are mainly undercapitalized noise. The competition is really TSLA and Ford. Earnings upcoming are April 25th
Technically, the price has been trending also a support of the lower standard deviations of the anchored VWAP originating
on the date of the last earnings. Recently price has moved from -2 STD VWAP band to the higher -1 STD band.
Price is now sitting on the support shown by the Luxalgo indicator with the earnings report due The VWAP bands
are quickly losing slope as earnings report day of April 25 approaches. the zero lag MACD has lines crossing under the
zero line and the histogram has just turned positive. These serve as confirmation entry signals.
I see this as entry time for an earnings play. Entry is by market order with a stop loss below the demand zone.
Targets are VWAP ( purple line), the midline between the demand/supply zones, and then the final target is the +1 STD above
VWAP ( downsloping stepped black line). Overall a reward for the risk of about 4X. I may opt to play this with call options
striking $35.00 expiring on 5/5 and currently priced at FWB:112 per contract.

General Motors continues in a trend of higher lows.General Motors Company - 30d expiry - We look to Buy at 33.55 (stop at 31.83)
Trend line support is located at 33.50.
A lower correction is expected.
We look to buy dips.
Prices expected to stall near trend line support.
This stock has seen good sales growth.
Expect trading to remain mixed and volatile.
Our profit targets will be 37.84 and 38.74
Resistance: 36.82 / 38.00 / 39.60
Support: 35.10 / 34.00 / 32.99
Please be advised that the information presented on TradingView is provided to Vantage (‘Vantage Global Limited’, ‘we’) by a third-party provider (‘Signal Centre’). Please be reminded that you are solely responsible for the trading decisions on your account. There is a very high degree of risk involved in trading. Any information and/or content is intended entirely for research, educational and informational purposes only and does not constitute investment or consultation advice or investment strategy. The information is not tailored to the investment needs of any specific person and therefore does not involve a consideration of any of the investment objectives, financial situation or needs of any viewer that may receive it. Kindly also note that past performance is not a reliable indicator of future results. Actual results may differ materially from those anticipated in forward-looking or past performance statements. We assume no liability as to the accuracy or completeness of any of the information and/or content provided herein and the Company cannot be held responsible for any omission, mistake nor for any loss or damage including without limitation to any loss of profit which may arise from reliance on any information supplied by Signal Centre.

general motors long 4hit may reach the upper trend line, when the price breaks 41 suggested to lift SL to 41, tp 44

GM time to going up this stock hit support line 4 times. every 1-2 months reached resistance line. Squeeze turned green and good volume

GM - LONGNYSE:GM
- Beautiful bounce off of daily demand and now gaining traction as well as lower channel bounce (confluences)
- A break and hold above 37.00 can test 37.76 resistance then psych level at 38.00. Above 38, you're opening doors for more upside with a final target at 40.00
Contract Suggestions which covers earnings run up as well:
GM 4/28 36 CALL
GM 4/28 37 CALL


Down trend GMBased on previous resistance I am potentially seeing a short position happening at $33 or close.
For confirmation we will wait for tomorrow 3/24 for final confirmation.

Short Put for $GM 4/21 Trade$GM Short Put Trade.
32 days till expiration.
-1 $32 Put 4/21
Approx. credit $100.
Collateral $3,200.
BE = $3,100.

GM UpdateGM RSI hit oversold on the daily and MFI is moving up.
No idea if it goes straight up like Jan or double bottoms like Oct, Fed meeting next week.
Seems to me like the futures algos are on a melt up, there's some serious money pumping into the market on these morning gaps down. The worst of the news is probably over except the Fed next Wed.
This whole year has been strange, but I want to remind everyone that the Dot Com bubble happened with interest rates higehr than they are now.

ABC/DThe target is D. Possible stop under C.
It is important to wait for EL level to clear possible resistance.
Good to be on look out for a reversal if/when price reaches D.
This is a measured move that occurs over and over again in the markets.
No recommendation.
T2 if Targets 1 are surpassed are 54.5 to 59

GM - Minor Low breakout (Aggressive Sideways Trend)Big move after earnings was capped by Vscore resistance.
Pros: Vscore is at support. 200 propulsion. Volume profile levels. Darvas 3.0.
Cons: RAF @ 50%. XLY sector is below 200prop dots. GM price dipped below 200 prop, but found support.
Entry - $39.35
Profit - Darvas Level - $40.50
25% Stop Loss
21APR23 39 Calls

General Motors shows a clear trend of higher lows.General Motors Company - 30d expiry - We look to Buy at 33.34 (stop at 31.54)
The trend of higher lows is located at 33.30.
Short term momentum is bearish.
Prices expected to stall near trend line support.
Expect trading to remain mixed and volatile.
Preferred trade is to buy on dips.
Our profit targets will be 37.84 and 38.84
Resistance: 40.00 / 41.50 / 42.36
Support: 38.12 / 37.47 / 35.13
Please be advised that the information presented on TradingView is provided to Vantage (‘Vantage Global Limited’, ‘we’) by a third-party provider (‘Signal Centre’). Please be reminded that you are solely responsible for the trading decisions on your account. There is a very high degree of risk involved in trading. Any information and/or content is intended entirely for research, educational and informational purposes only and does not constitute investment or consultation advice or investment strategy. The information is not tailored to the investment needs of any specific person and therefore does not involve a consideration of any of the investment objectives, financial situation or needs of any viewer that may receive it. Kindly also note that past performance is not a reliable indicator of future results. Actual results may differ materially from those anticipated in forward-looking or past performance statements. We assume no liability as to the accuracy or completeness of any of the information and/or content provided herein and the Company cannot be held responsible for any omission, mistake nor for any loss or damage including without limitation to any loss of profit which may arise from reliance on any information supplied by Signal Centre.

GM: Buy ideaBuy idea on GM because we have the breakout with force the vwap and the resistance line.Thanks!
