NAS100 – Bias BearishThe daily bias for NAS100 today is bearish.
Yesterday’s daily candle formed a clear bearish signal:
✔️ Swept the previous day’s high (buy-side liquidity taken)
✔️ Closed bearish
✔️ Closed outside the previous day’s range (below the prior day’s low)
This price action shows rejection of premium levels and confirms a shift toward sell-side delivery for today’s session.
Bias Summary:
Daily Bias: Bearish
Narrative: Expansion lower after liquidity sweep
Expectation: Price may seek lower liquidity pools
Outlook: Any retracement into premium could offer short setups
Trade with the narrative, not against it. 🧠🔥
Market insights


NAS100 – TFOTechnical:
Price is holding above the 25,400 area after a strong recovery from the 24,700 lows. Short-term structure remains bullish while above 25,300. A clean break above 25,500 could extend toward 25,700–25,900. Failure to hold 25,300 opens room for a pullback to 25,000–24,900.
Fundamental:
Nasdaq remains supported by expectations of softer financial conditions and resilience in large-cap tech. Near term price action is still sensitive to US yields, USD moves, and macro data.

NAS100 Trade Set Up Dec 22 2025Price is making HH/HL on the 1h indicating bullish structure with London breaking out of Asia highs so i will want to see a pullback into 1h FVG to then look for internal 1m-5m IFVG/CISD to take buys higher

NAS TakeSupport levels from pivot points and multiple moving averages create a technical base that reduces downside risk in the short term.
Volume remains steady, which confirms the reliability of the ongoing trend.
These combined technical factors typically precede price appreciation in the Nasdaq 100 , suggesting the index will likely continue to Declines hortly based on trend-following and momentum-based trading strategies with limited immediate overbought risk.

NQ Move This Week 12/22- 12/26Based on last week’s price action, the market traded lower in alignment with the prior week’s projections. Price delivered into the 4-hour discount Fair Value Gap (FVG), where it showed clear respect after tapping into the consequent encroachment toward the end of the Wednesday PM session. This reaction confirmed strong institutional interest at that discount array.
During Thursday’s trading session, price fully retraced Wednesday’s decline, signaling a shift in short-term sentiment. On Friday, we observed a bullish displacement, accompanied by a clear bullish market structure shift. This move left behind a bullish FVG visible across the 4-hour, 3-hour, 2-hour, and 1-hour timeframes, further reinforcing the strength of the move.
Given the current state of delivery, market conditions suggest a high probability of continued bullish expansion into the upcoming week. Price is likely to seek higher liquidity, with a strong draw toward the premium arrays resting at the relative equal highs within the Daily FVG originating from November 4th, 2025.

NAS100 Walk us Through.
Gosh, that's a very brief description. Could you please tell your audience a little bit more about what you're publishing

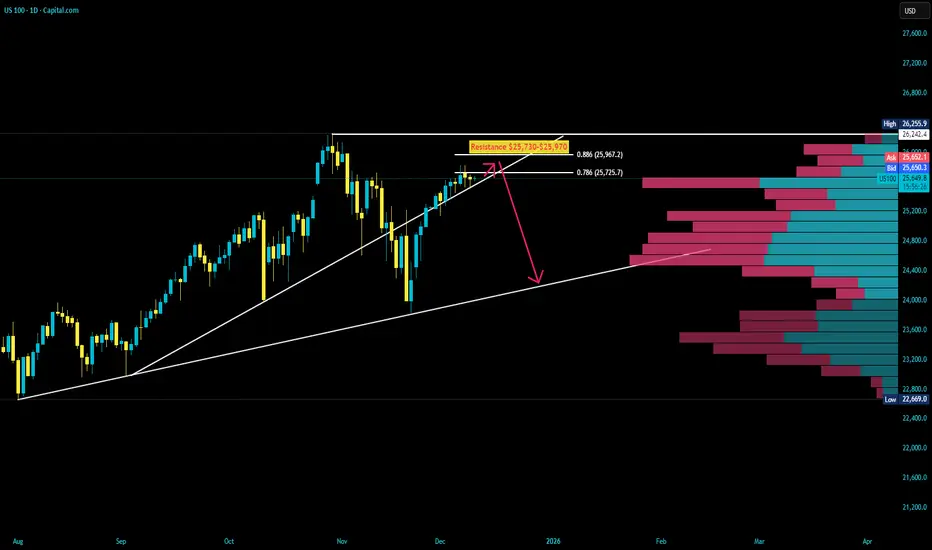
US100 Resistance AheadUS100: Tough resistance zone at 25,730–25,970. If price fails to hold above 25,730 after today’s FOMC decision, a sharp sell-off toward 24,200 becomes highly probable.
Why Traders Lose More Money on Monday MorningsWhy Traders Lose More Money on Monday Mornings
A trader opens a position at 9:35 AM on Monday. An hour later, closes with a stop loss. Same trader, same strategy, but Wednesday afternoon. Opposite result.
Coincidence? No.
The market changes not just in price. It changes in mood, speed, and aggression of participants. And this depends on time.
Monday Morning: When Emotions Rule
The weekend is over. Traders have accumulated news, opinions, fears. The first hour of trading resembles a crowd at a sale. Everyone wants to enter first.
The problem is decisions are made on emotions, not analysis. Volatility spikes. Spreads widen. False breakouts happen more often.
Research shows: Monday brings traders the highest proportion of losing trades for the week. Psychology works against you from the start.
Asian Session vs American
At 3 AM Moscow time, Tokyo opens. Movements are smooth, predictable. Ranges are narrow.
Then London joins. Speed increases. Volumes triple.
New York adds chaos. From 4:30 PM to 6:00 PM MSK, the market becomes a battlefield. US news overlaps with European position closures.
Different sessions require different psychology. Asia loves patience. Europe demands speed. America tests nerves.
Friday Afternoon: Trap for the Greedy
By Friday, traders are tired. More decisions made than the entire week. Willpower reserves are depleted.
After lunch, many just want to close the week. Mass position closing begins. Trends break. Patterns stop working.
But the most dangerous thing: the desire to "recover for the week." A trader sees the last chance to fix results. Enters risky trades. Increases lot size.
Broker statistics confirm: Friday after 3 PM MSK collects more stop losses than any other time.
Ghost Hours
There are periods when the market technically works, but better not to trade.
From 10 PM to 2 AM MSK, America closed, Asia still sleeping. Liquidity drops. One large order can move price 20 pips.
European lunch time (1 PM-2 PM MSK) is also treacherous. Volumes freeze. Price marks time. Then suddenly shoots in any direction without reason.
Trading these hours resembles fishing in an empty pond. You can sit long and catch nothing.
How Time Affects Your Thinking
Fatigue accumulates. In the morning you analyze each trade. By evening you just click on the chart.
Biorhythms dictate concentration. Peak performance for most people falls at 10 AM-12 PM. After lunch comes a decline. By 5 PM, risk assessment ability drops 30%.
Add caffeine, sleep deprivation, personal problems. Your state changes perception of the same situation on the chart.
Wednesday: The Golden Middle
Statistics say: Wednesday gives the most stable results.
Monday emotions passed. Friday fatigue hasn't arrived yet. Market works in normal mode without surprises.
Most professional traders concentrate activity right in the middle of the week. Less noise, more patterns.
Find Your Time
No universal recipe exists. Some trade Asian session excellently. Others catch New York volatility.
Keep a journal not just on trades, but on time. Mark when you make the best decisions. When you make impulsive mistakes.
After a month you'll see a pattern. Perhaps your brain works clearer in the evening. Or Mondays really bring only losses.
Adapt your schedule to biology, not to the desire to trade 24/7.
Time as a Filter
Experienced traders use time as an additional entry filter.
Good setup on Monday morning? Skip it. Same setup on Wednesday? Take it.
Buy signal at 11 PM? Wait for Tokyo opening. No point risking with low liquidity.
Time doesn't cancel strategy. But it adds probability in your favor.
What the Numbers Say
Data from thousands of accounts show clear patterns:
Monday: minus 2-3% to average profitability
Tuesday-Thursday: stable results
Friday: minus 1-2% after 3 PM
Night sessions: unprofitable for 78% of traders
London-New York overlap: maximum profit for scalpers
Numbers don't lie. Psychology is real.
Final Word
You can have the best strategy in the world. But if you trade at the wrong time, results will be average.
The market doesn't change. People trading in it change. Their fatigue, fear, greed, inattention.
Time of day and day of week determine who is in the market now and in what state. And this determines how price will move.
Choose trading time as carefully as you choose entry point. Many traders add time filters to their strategies or use indicators that help track session activity.

NASS100 - Bias BearishThe bias for NAS100 today is bearish.
Yesterday’s daily candle met the bearish bias condition, signaling weakness and potential continuation to the downside. Price action shows that buy-side liquidity has been engaged, followed by a bearish daily close, which aligns with sell-side delivery.
As long as price remains below yesterday’s high and continues to respect lower structure, the market favors downside expansion.
Bias Summary:
Daily bias: Bearish
Expectation: Lower prices
Focus: Sell-side liquidity targets
Best entries: Retracements into premium zones
Stay patient and trade in alignment with the daily narrative. 🧠🔥

NQ Move This Week 12/15 - 12/19After failing to reclaim all-time highs last week and showing a clear bearish rejection, price has shifted market structure from bullish to bearish. This may mark the beginning of a Market Maker Sell Model forming this week. If price delivers a strong daily close that fully engulfs the bullish Fair Value Gap (FVG), I would expect price to continue repricing lower.

Nasdaq - The final blow-off top!⚰️Nasdaq ( TVC:NDQ ) can rally a final +25%:
🔎Analysis summary:
Just this month, we witnessed quite some volatility on the Nasdaq with a correction of about -10%. However, bulls immediately stepped in and clearly pushed price higher. Since there is still bullish pressure, a final blow-off top rally in the near future is quite likely.
📝Levels to watch:
$25,000 and $30,000
SwingTraderPhil
SwingTrading.Simplified. | Investing.Simplified. | #LONGTERMVISION

NASDAQ SHORT VERY BEARISHTri-star doji printed, a rare and strong reversal pattern - extremely bearish.

US Tech 100 NASDAQ Structural Bearish Shift
IG:NASDAQ
Structural Bearish Shift Explained
Multi-Timeframe Price Action Breakdown (1D → 4H)
This analysis focuses purely on market structure, liquidity, and intention.
🔹 1D CONTEXT — MARKET STRUCTURE SHIFT
On the Daily timeframe, the market printed a clear bearish Market Structure Shift (MSS):
• The prior bullish sequence (HH → HL) was invalidated
• Price broke the key HL, officially changing the higher-timeframe flow
• This confirms a bearish structural bias on 1D
The critical detail is where the shift originated.
⸻
🔹 ORIGIN OF THE 1D MSS (KEY DETAIL)
The Daily MSS was caused by an internal high, not by a macro LH:
• This internal high was the impulsive driver that broke the Daily HL
• Once the HL failed, that internal high became:
• The origin of the bearish shift
• A high-probability liquidity pool
This distinction matters.
The market is not reacting randomly — it is respecting structural causality.
⸻
🔹 1D LIQUIDITY SWEEP = MITIGATION, NOT BREAKOUT
After the MSS, price returned precisely to that internal high and:
• Swept liquidity above it
• Took stops from:
• Early shorts
• Late breakout longs
• Failed to accept above the level
• Closed back below the sweep zone
This move is best defined as:
Daily mitigation of the MSS origin, not an attempt at bullish continuation.
No acceptance = no bullish intent.
🔹 4H CONFIRMATION — INTERNAL ALIGNMENT
Dropping to 4H, the lower-timeframe behavior aligns perfectly with the Daily narrative:
• A 4H bearish MSS printed
• Followed by a 4H BOS to the downside
• A clean bearish Fair Value Gap (FVG) was left behind
• Price expanded impulsively away from that imbalance
This tells us:
• The Daily mitigation triggered internal distribution
• Lower timeframes accepted the bearish flow
• Momentum is now aligned top-down
⸻
🔹 WHAT THIS TELLS US ABOUT MARKET INTENT
Putting it all together:
• ✅ Daily bearish MSS defines bias
• ✅ Liquidity above the MSS origin has been fully mitigated
• ✅ 4H structure confirms bearish continuation
• ❌ No bullish acceptance or expansion above key levels
This is not a failed breakout
This is a structural transition from accumulation to distribution
⸻
🔹 KEY TAKEAWAY
After a Daily Market Structure Shift, the market revisited the exact internal high that caused the shift, swept liquidity, failed to accept higher prices, and aligned lower-timeframe structure to the downside.
Bias: Bearish
Framework: Structure → Liquidity → Acceptance
Not financial advice.
AI Generated.

Next Nas100 GainThese combined technical factors typically precede price appreciation in the Nasdaq 100 , suggesting the index will likely continue to rise shortly based on trend-following and momentum-based trading strategies with limited immediate overbought risk


$BTC - $DXY -$SPX - $NDX - $GOLD 11/12/2025 forecastWhile the past days saw a fairly moderate negative energy across an index at a time, things will now complicate. As we're looking for both CRYPTOCAP:BTC , TVC:GOLD and NASDAQ:NDX (the latter still waiting to properly discount the incoming negative days) to witness huge peaks of negative energy, at 3:49 am UTC and particularly at 7:50 am UTC being the hardest one, volatility will further increase as we get towards 12/12/2025.

Nas100 LONG SETUP Price continues to trade within the uptrend amid a week full of data. Mild consolidation is expected above 25.217 before we can go up

US100 SELL📊 US100 Elliott Wave Setup & Historical Context
This chart outlines a potential (A)-(B)-(C) corrective wave within a long-term bullish channel on the US100 (Nasdaq 100). The current price action suggests wave (B) may have peaked, and wave (C) could now be unfolding toward key Fibonacci zones—100%, 161.8%, and 200%—which historically act as strong support during corrections.
🔍 Why a 30% Drop Isn’t Unusual
Corrections of 20–35% are not only common in the Nasdaq 100—they're part of its growth DNA.

NAS100 M30 | Bearish Reaction Off Pullback ResistanceMomentum: Bearish
Price is currently below the ichimoku cloud.
Sell entry: 25,514.71
- Pullback resistance
- 78.6% Fib retracement
Stop Loss: 25,686.06
- Swing high resistance
Take Profit: 25,271.77
- Pullback support
High Risk Investment Warning
Stratos Markets Limited (tradu.com/uk ), Stratos Europe Ltd (tradu.com/eu ):
CFDs are complex instruments and come with a high risk of losing money rapidly due to leverage. 70% of retail investor accounts lose money when trading CFDs with this provider. You should consider whether you understand how CFDs work and whether you can afford to take the high risk of losing your money.
Stratos Global LLC (tradu.com/en ): Losses can exceed deposits.
Please be advised that the information presented on TradingView is provided to Tradu (‘Company’, ‘we’) by a third-party provider (‘TFA Global Pte Ltd’). Please be reminded that you are solely responsible for the trading decisions on your account. Any information and/or content is intended entirely for research, educational and informational purposes only and does not constitute investment or consultation advice or investment strategy. The information is not tailored to the investment needs of any specific person and therefore does not involve a consideration of any of the investment objectives, financial situation or needs of any viewer that may receive it. Past performance is not a reliable indicator of future results. Actual results may differ materially from those anticipated in forward-looking or past performance statements. We assume no liability as to the accuracy or completeness of any of the information and/or content provided herein and the Company cannot be held responsible for any omission, mistake nor for any loss or damage including without limitation to any loss of profit which may arise from reliance on any information supplied by TFA Global Pte Ltd.

USNAS100 | Correction Toward 25835 Before Bearish ContinuationUSNAS100 – Technical Overview
USNAS100 is expected to make a corrective move toward 25710–25835, where the market may find short-term resistance before resuming the broader bearish trend.
A continuation of downside momentum requires a confirmed break of key support.
Technical Analysis
The index is likely to retrace upward toward 25710 and 25835.
This zone is expected to act as a reaction area before sellers regain control.
A 1H close below 25430 will confirm bearish continuation, targeting:
→ 25430
→ 25210
If the price breaks above 25835, the structure shifts bullish, opening the path toward 25985 and higher upside potential.
Pivot Line: 25700
Support: 25430 · 25210
Resistance: 25830 · 25985

Nasdaq Buy Area Buy Nasdaq once retest IFVG , Algo 2 is running in Daily time frame
expecting big candle once break this breaker

NAS100 – Technical & Fundamental Outlook (Short)Technical: NAS100 is trading sideways to bearish on H1, clearly rejecting the 26,000–26,200 supply zone. As long as price remains below this area, a corrective bias is favored, with key support around 25,000–24,800. Upside moves look weak.
Fundamental: The index remains pressured by higher-for-longer rate expectations, USD strength, and rotation out of tech. Markets stay cautious ahead of upcoming macro data and Fed guidance.
