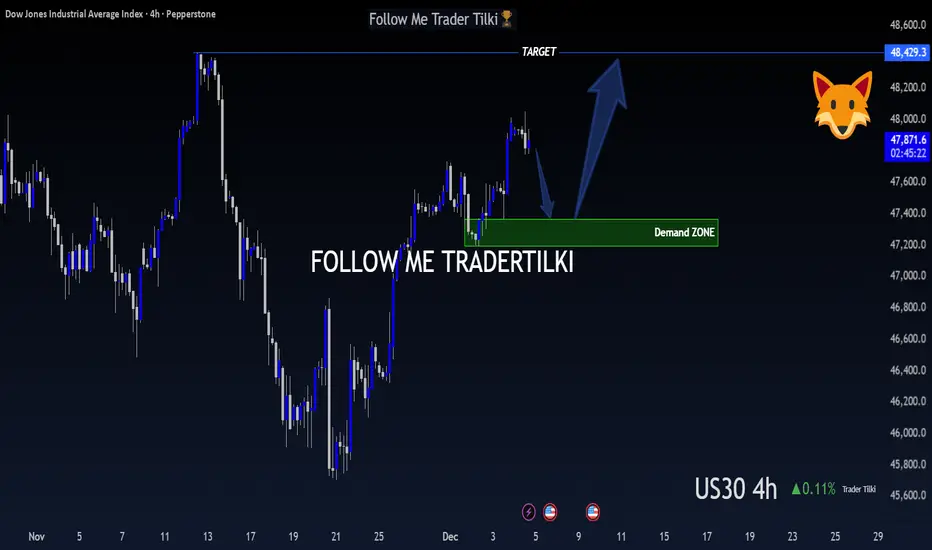
US30 (DOW JONES) – 4-Hour Timeframe Tradertilki AnalysisMy friends,
I have analyzed US30 on the 4-hour timeframe.
My friends, if US30 reaches the levels between 47,361 and 47,192, I will open a buy position.
My target will be the 48,429 level.
My friends, I share these analyses thanks to each like I receive from you.
Your likes increase my motivation and encourage me to support you in this way.🙏
Thank you to all my friends who support me with their likes.❤️
Trade ideas
US30: Another Attempt to Rise AgainUS30: Another Attempt to Rise Again
US30 broke out of a triangle pattern indicating a rise in the bullish momentum.
If price continues to respect this small pattern, US30 should rise more today with targets at 48000 and 48123.
It may work better with call options as this limits the risk in a better way considering the market volatility.
You may find more details in the chart!
Thank you and Good Luck!
❤️PS: Please support with a like or comment if you find this analysis useful for your trading day❤️

Dow Jones is approaching an important support! Hey Traders, in today's trading session we are monitoring US30 for a buying opportunity around 47,350 zone, Dow Jones is trading in an uptrend and currently is in a correction phase in which it is approaching the trend at 43.350 support and resistance area.
Trade safe, Joe.

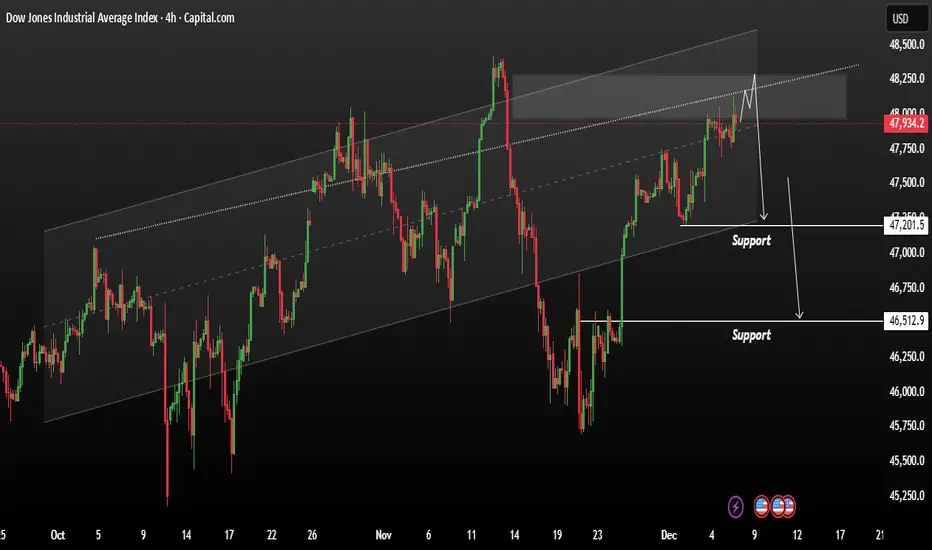
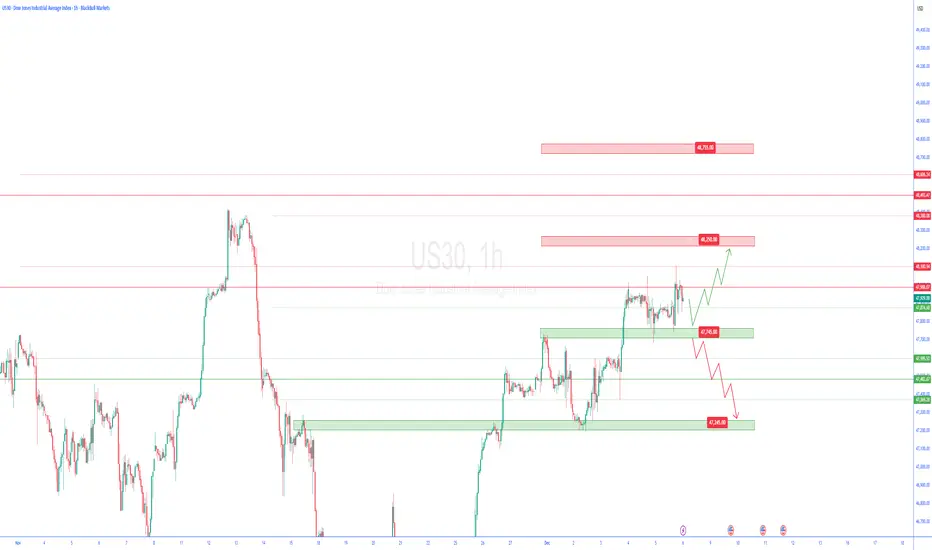
US30 Consolidation bearish range shift to support sideUS30 Consolidation bearish range action within a clearly defined ascending channel. The price has recently approached the upper boundary of this channel, where it appears to be facing resistance.
A projected path is drawn suggesting a potential short-term rejection from the upper channel line, with price possibly pulling back toward support zones the trendline reinforcing the resistance zone near 48,000–48,250, where buyers may be weakening. If a rejection occurs at this level, the drawn arrows indicate a potential multi-step decline toward the identified support areas.
Overall, the chart suggests the index is in a broader uptrend, but currently positioned at a high-risk resistance zone where a corrective move downward is possible if the price reacts then we could see support side target will be 47,200 / 46512,
You may find more details in the chart.
Trade wisely best of luck buddies.
Ps; Support with like and comments for better analysis thanks for supporting.
US30 analysisFirst post! I wanted to try something different and new by posting my understandings of US30. US30 tends to fake out before the real move. In my chart I like to label what I would consider whole number quarter levels. I like to wait to see some sort of opposite candle of the overall potential continuation. My Take profits are usually from 600-1250 of a continuance of the move for the day.
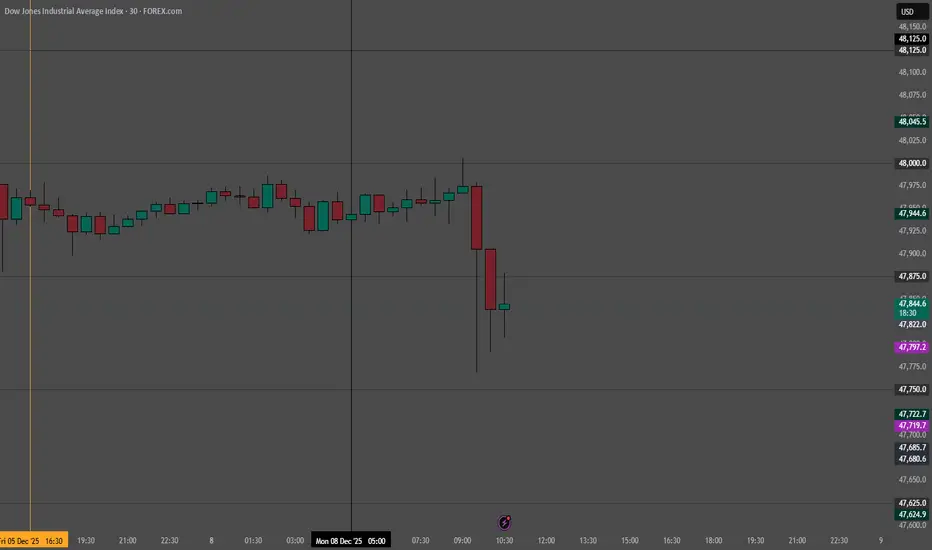
US30 | Markets Brace for Fed Rate Cut DecisionUS30 – Technical Overview
Wall Street futures edged higher on Monday as traders prepared for one of the most closely watched—and divisive—Federal Reserve meetings in recent years.
Markets widely expect the Fed to deliver its long-awaited interest rate cut this week.
Last week’s delayed data showed moderate growth in consumer spending late in Q3, further boosting confidence that policymakers may prioritize supporting the labor market and reducing borrowing costs.
Technical Analysis
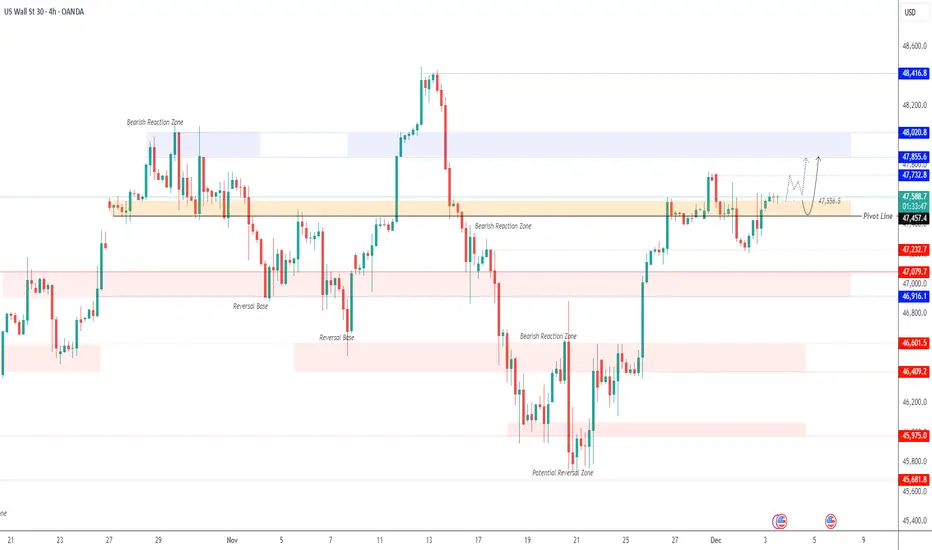
US30 continues to trade below 48020, indicating that bearish momentum remains in control.
As long as price stays under this level, the index is expected to move toward 47770 and 47460, with 47560 acting as an intermediate support.
A bullish reversal requires a 1H candle close above 48020, which would confirm a shift in momentum and open the way toward 48410 and potentially the ATH region.
Key Levels
Pivot Line: 48020
Support: 47770 · 47560 · 47460
Resistance: 48300 · 48410
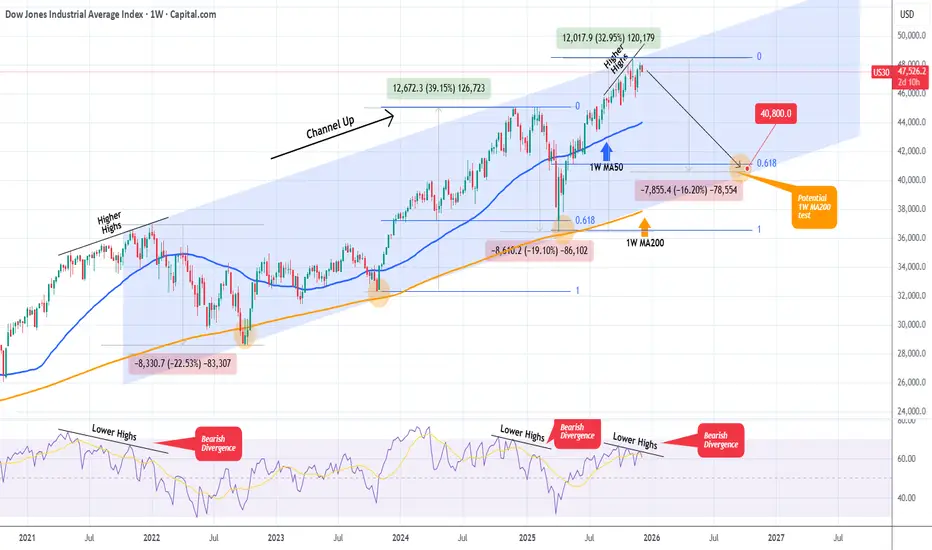
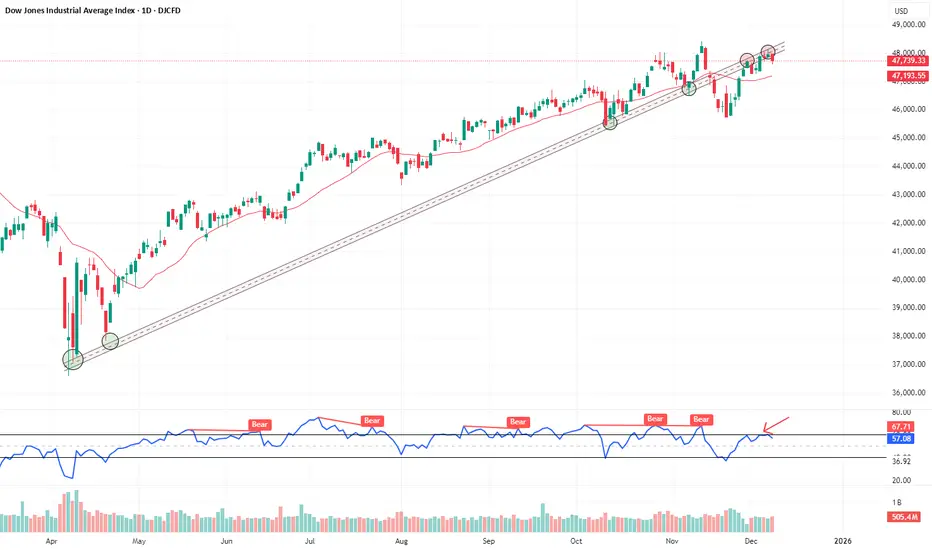
DOW JONES Is it starting a new Bear Cycle towards 40800?Dow Jones (DJI) has been trading within a 4-year Channel Up since the start of the 2022 Inflation Crisis. One month ago it hit the top of this pattern and hasn't made a new High since.
This is increasingly alarming as the 1W RSI is on a Bearish Divergence under Lower Highs against the market's Higher Highs. Every time this took place within this pattern, the index corrected heavily and attempted a 1W MA200 (orange trend-line) test.
As a result, if Dow fails to make a new High, we expect the bearish sentiment to intensify and start a new Bear Cycle (Bearish Leg for the Channel Up) towards its 1W MA200 and the 0.618 Fibonacci retracement level, which was the Target of the previous correction. Based on that it is possible for the index to hit 40800 at the bottom of the Channel Up.
---
** Please LIKE 👍, FOLLOW ✅, SHARE 🙌 and COMMENT ✍ if you enjoy this idea! Also share your ideas and charts in the comments section below! This is best way to keep it relevant, support us, keep the content here free and allow the idea to reach as many people as possible. **
---
💸💸💸💸💸💸
👇 👇 👇 👇 👇 👇
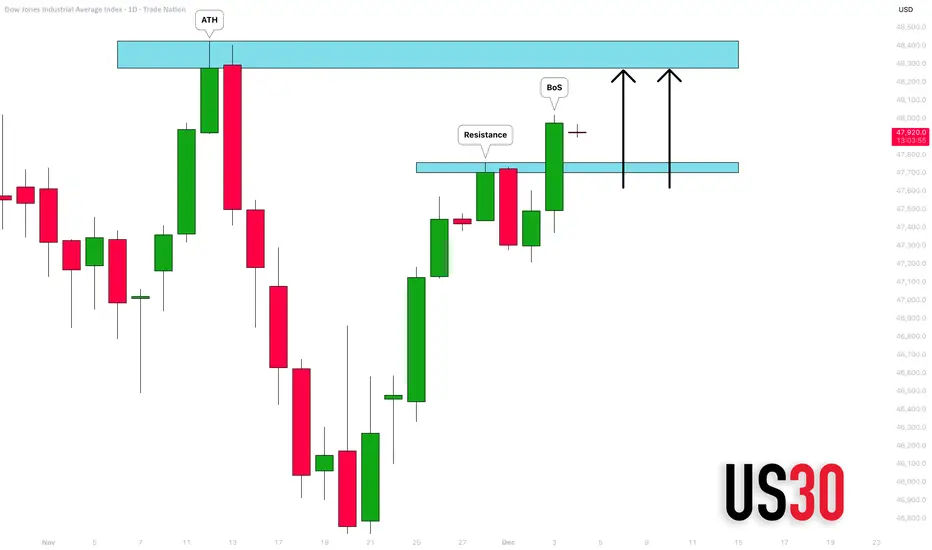
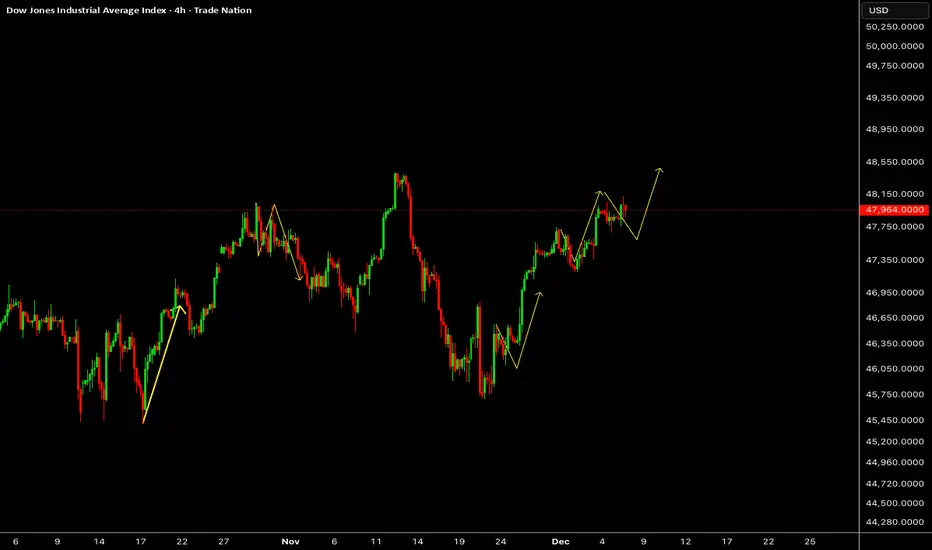
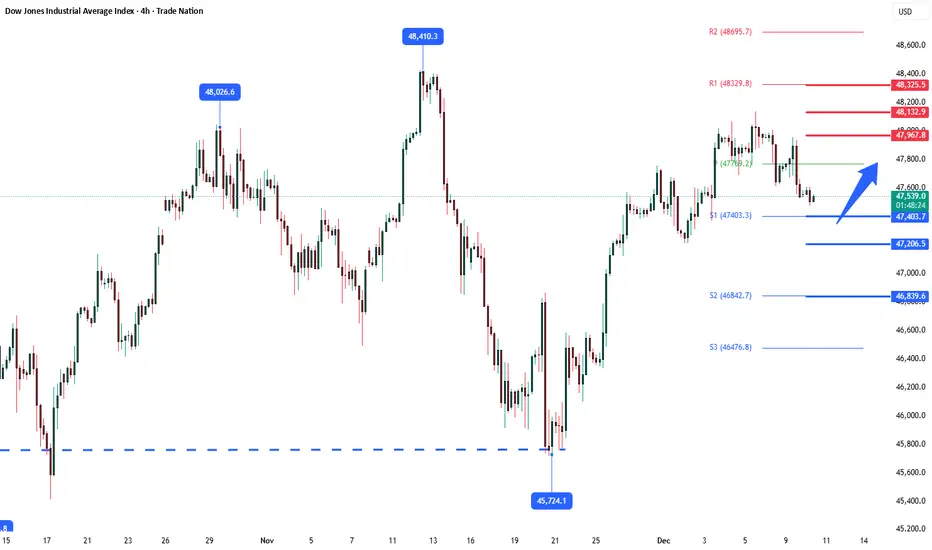
DOW JONES INDEX (US30): Confirmed BoS
With the yesterday's fundamental US news releases and
Trump's speech, US30 bounced strongly.
The market violated a significant daily resistance cluster
and closed above that.
It opens a potential for more growth to a resistance based
on a current All-Time High.
❤️Please, support my work with like, thank you!❤️
I am part of Trade Nation's Influencer program and receive a monthly fee for using their TradingView charts in my analysis.

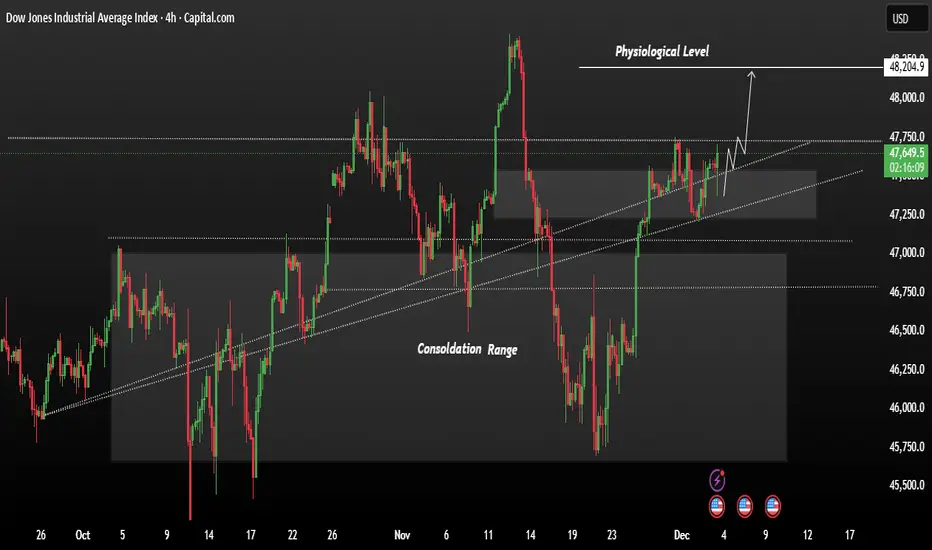
US3O showing strong bullish momentumUS30 is trading in a steady upward channel after breaking out of its previous consolidation range. Price is holding above support and showing strong bullish momentum.
As long as it stays above the current breakout zone, the market is positioned to push higher toward the next psychological level around 48,205. Buyers remain in control, and any pullbacks into the trendline support may attract fresh buying pressure.
If the price test the support level after again price range bullish from the current range we could expect price remains chance for bullish pattern.
You may find more details in the chart.
Trade wisely best of Luck buddies.
Ps; Support with like and comments for better analysis thanks for supporting.
US30 - DOW Hits Major Supply Reversal coming on Dow as it hits a major supply zone. This is part of a bigger cross-asset move that I am anticipating across global equities. I see a synchronised sell off in global equities coming this month.

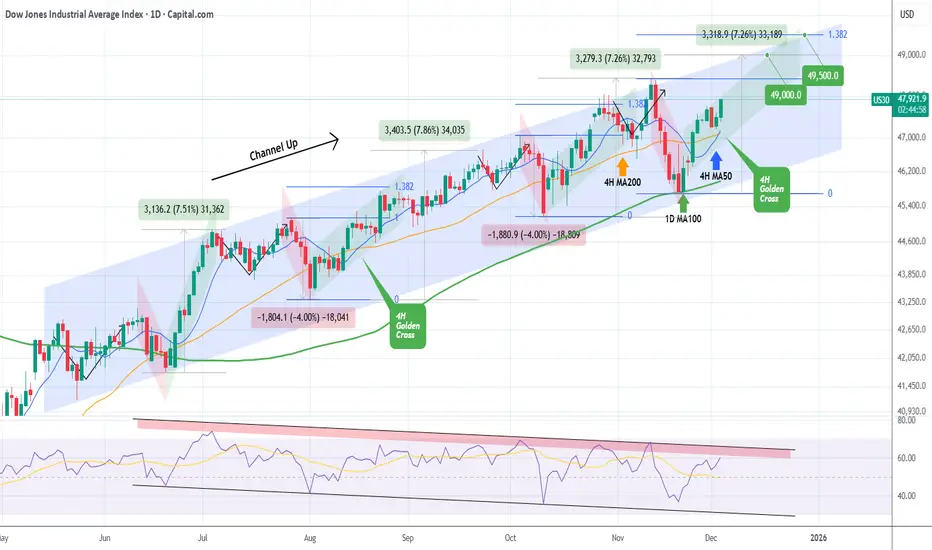
DOW JONES formed its first 4H Golden Cross since August. BullishDow Jones (DJI) has been trading within a 6-month Channel Up and today it formed its first 4H Golden Cross since August 15. Coming off a Higher Low bottom 2 weeks ago on the 1D MA100 (green trend-line), we are currently on the new Bullish Leg of the pattern.
The last one rose by +7.26%, roughly the % amount of the previous two as well, so our immediate Target remains 49000 as we've shown on last weeks analysis.
This time we also see an over-extended Target if the end-of-year rally lasts a bit longer, on the 1.382 Fibonacci extension at 49500, as this level has been hit on every Bullish Leg of this pattern.
If the 1D RSI though hits its Lower Highs Zone (red) earlier, it might be a good idea technically to book profits before those Targets are reached.
---
** Please LIKE 👍, FOLLOW ✅, SHARE 🙌 and COMMENT ✍ if you enjoy this idea! Also share your ideas and charts in the comments section below! This is best way to keep it relevant, support us, keep the content here free and allow the idea to reach as many people as possible. **
---
💸💸💸💸💸💸
👇 👇 👇 👇 👇 👇
US30 – PREMIUM OUTLOOK | Momentum Shifts at Key Resistance ZoneUS30 – Technical Overview
US30 continues to show bearish momentum as long as price remains below 47920 and 48020, with downside targets at 47720 and 47560.
Price action in this zone remains sensitive, and sellers maintain control while the index trades under these resistance levels.
However, if the market closes a 1H candle above 48020, this would signal a shift in momentum and open the way for a bullish move toward 48410.
Key Levels
Pivot Line: 47920
Support: 47730 · 47560 · 47460
Resistance: 48020 · 48320 · 48410
previous idea:

US30 Dow Jones Weekly Open Retest Strategy’m watching US30 (Dow Jones) closely right now, and it’s been in a strong bullish trend over the last two weeks. 📈🔥 We’ve seen two powerful drives to the upside, and there’s a good chance we could get that classic third drive completing a three-drive pattern before the week ends.
As price pushed higher, it’s already dipped back down into sell-side liquidity, clearing out those resting lows. That kind of move often sets the stage for another leg higher, so it’s definitely possible we see US30 continue north from the current levels. ⬆️💰
At the same time, it wouldn’t surprise me to see price pull back a bit more, possibly dipping below the weekly open to rebalance before making its next move.
Either way, my focus is on the weekly open. I want to see price break through it, come back, retest it, and show me that the level is now acting as support. That retest is the zone where I’d be interested in looking for long opportunities. 🟩📊
Stay patient and wait for clean structure.
Not financial advice.

US30 – MARKET OUTLOOK | December Optimism Meets Key Data RisksUS30 (Dow Jones) – Technical Overview
The Dow Jones posted a modest gain on Tuesday, rising 185 points, as traders embraced a bit of December optimism. Even small upticks count in a holiday month—especially with markets looking for positive momentum amid mixed macro signals.
Volatility is expected to increase ahead of today’s ADP employment data, which may influence risk sentiment across equities.
Technical Analysis
US30 maintains bullish momentum while trading above 47560, with upside targets at 47720 and 47855.
A breakout above these resistance zones may extend the move toward 48020.
However, a 1H or 4H close below 47460 will shift momentum into a bearish correction, opening the way toward 47230 and 47100.
Pivot Line: 47560
Resistance: 47710 · 47860 · 48020
Support: 47460 · 47230 · 47100
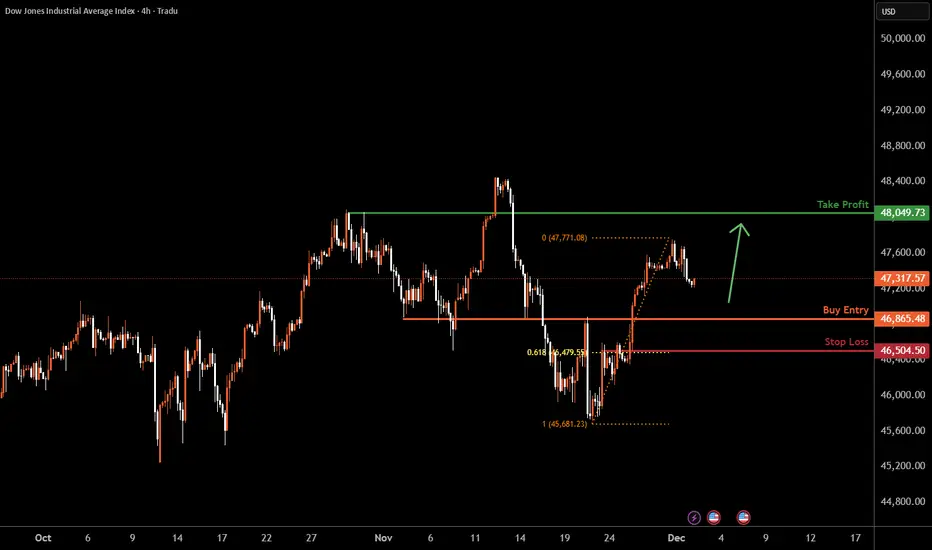
US30 H4 | Falling Towards Key SupportMomentum: Bullish
Price is pulling back toward our buy entry, which has been identified as an overlap support zone.
Buy Entry: 46,865.48
Strong overlap support
Stop Loss: 46,504.50
Pullback support
61.8% Fibonacci retracement
Take Profit: 48,049.73
Pullback resistance
High Risk Investment Warning
Stratos Markets Limited (tradu.com ), Stratos Europe Ltd (tradu.com ):
CFDs are complex instruments and come with a high risk of losing money rapidly due to leverage. 70% of retail investor accounts lose money when trading CFDs with this provider. You should consider whether you understand how CFDs work and whether you can afford to take the high risk of losing your money.
Stratos Global LLC (tradu.com ): Losses can exceed deposits.
Please be advised that the information presented on TradingView is provided to Tradu (‘Company’, ‘we’) by a third-party provider (‘TFA Global Pte Ltd’). Please be reminded that you are solely responsible for the trading decisions on your account. Any information and/or content is intended entirely for research, educational and informational purposes only and does not constitute investment or consultation advice or investment strategy. The information is not tailored to the investment needs of any specific person and therefore does not involve a consideration of any of the investment objectives, financial situation or needs of any viewer that may receive it. Past performance is not a reliable indicator of future results. Actual results may differ materially from those anticipated in forward-looking or past performance statements. We assume no liability as to the accuracy or completeness of any of the information and/or content provided herein and the Company cannot be held responsible for any omission, mistake nor for any loss or damage including without limitation to any loss of profit which may arise from reliance on any information supplied by TFA Global Pte Ltd.
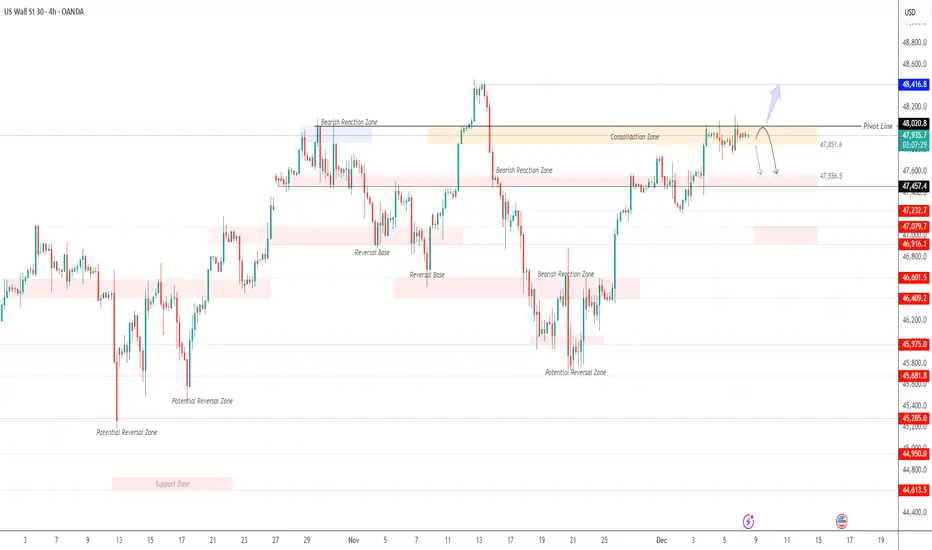
US30: What’s Forming?US30 has extended its upward move, but the latest slowdown suggests a developing consolidation phase rather than a completed trend. The structure is shaping into a potential corrective pattern, indicating that the market may still be preparing for another push once this pause finalizes. With momentum moderating, the next decisive move could unfold soon, making this an interesting setup to monitor closely.
**Disclosure:** We are part of Trade Nation's Influencer program and receive a monthly fee for using their TradingView charts in our analysis.
DOW JONES DAILY CHART ANALYSISClear trendline role reversal in play — previous support now acting as strong resistance📉
Price rejection seen near:
🔹 Trendline resistance
🔹 RSI bearish range shift (marked by repeated failures to cross 60)
🔹 Fib 0.786 retracement zone (not shown in chart)
All confluences suggest a potential pause or short-term pullback unless price breaks out with strong volume.
DowJones key trading levels ahead of FOMC rate decision Key Support and Resistance Levels
Resistance Level 1: 47967
Resistance Level 2: 48132
Resistance Level 3: 48325
Support Level 1: 47400
Support Level 2: 47200
Support Level 3: 46840
This communication is for informational purposes only and should not be viewed as any form of recommendation as to a particular course of action or as investment advice. It is not intended as an offer or solicitation for the purchase or sale of any financial instrument or as an official confirmation of any transaction. Opinions, estimates and assumptions expressed herein are made as of the date of this communication and are subject to change without notice. This communication has been prepared based upon information, including market prices, data and other information, believed to be reliable; however, Trade Nation does not warrant its completeness or accuracy. All market prices and market data contained in or attached to this communication are indicative and subject to change without notice.
us30 1h🔹 Overall Outlook and Potential Price Movements
In the charts above, we have outlined the overall outlook and possible price movement paths.
As shown, each analysis highlights a key support or resistance zone near the current market price. The market’s reaction to these zones — whether a breakout or rejection — will likely determine the next direction of the price toward the specified levels.
⚠️ Important Note:
The purpose of these trading perspectives is to identify key upcoming price levels and assess potential market reactions. The provided analyses are not trading signals in any way.
✅ Recommendation for Use:
To make effective use of these analyses, it is advised to manually draw the marked zones on your chart. Then, on the 5-minute time frame, monitor the candlestick behavior and look for valid entry triggers before making any trading decisions.
US30 SellsWe're on track folks! I'm on a prop firm you can check the link. I use Tradingview as a POV and I place trades on TradeLocker! Target hit my first TP as we speak!
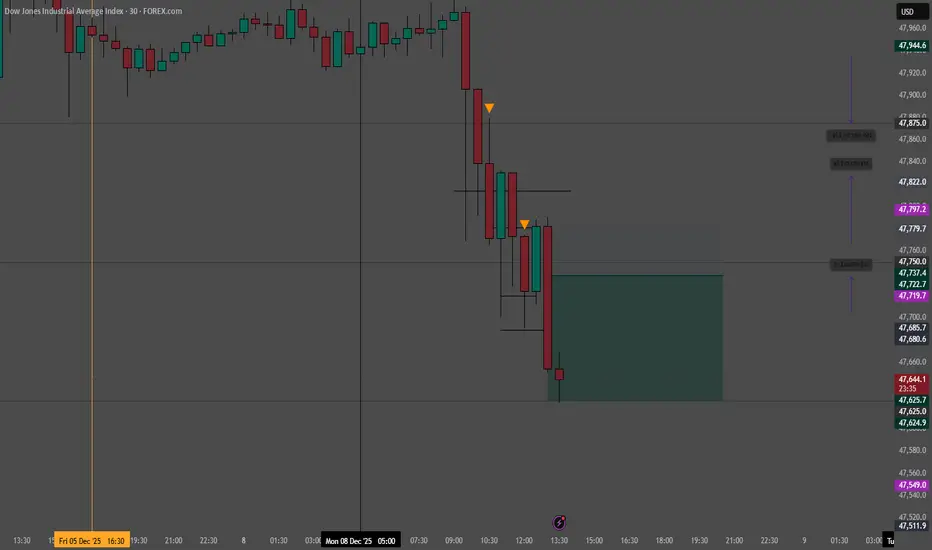
US30 Long
I'm watching a potential buy opportunity on US30. The supply zone looks like it's failing to hold, so my bias is shifting toward a long position.

US30 Trading Opportunity! SELL!
My dear friends,
Please, find my technical outlook for US30 below:
The instrument tests an important psychological level 47934
Bias - Bearish
Technical Indicators: Supper Trend gives a precise Bearish signal, while Pivot Point HL predicts price changes and potential reversals in the market.
Target - 47694
About Used Indicators:
Super-trend indicator is more useful in trending markets where there are clear uptrends and downtrends in price.
Disclosure: I am part of Trade Nation's Influencer program and receive a monthly fee for using their TradingView charts in my analysis.
———————————
WISH YOU ALL LUCK
