US30 - Potential TargetsDear Friends in Trading,
As long as price remains above 45000, continued bullish action is expected
I sincerely hope my point of view offers a valued insight
Thank you for taking the time study my analysis.
US30 trade ideas
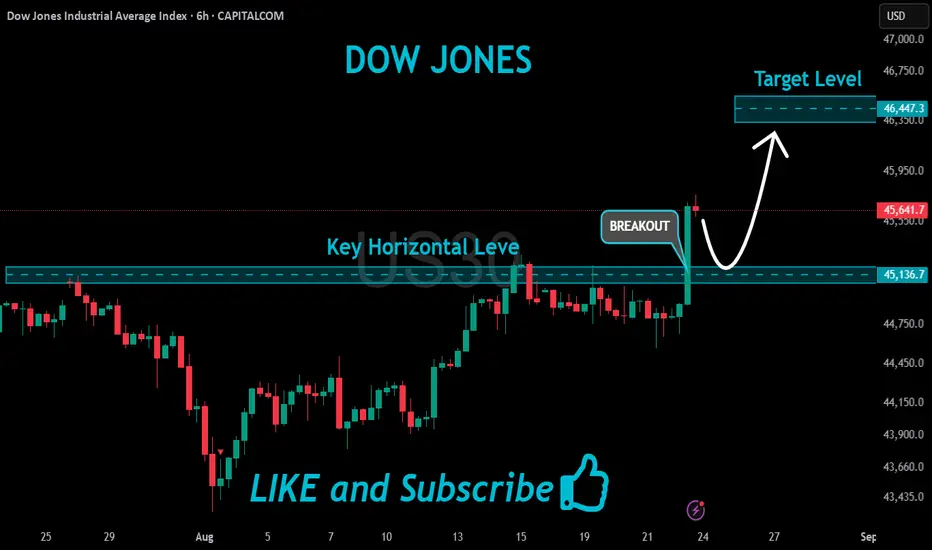
US30 Will Keep Growing!
HI,Traders !
#US30 is trading in an
Uptrend and the bullish
Breakout reinforces our
Bullish bias so after the
Potential pullback and retest
Of the new support of 45136.7
A further bullish continuation
Is to be expected !
Comment and subscribe to help us grow !
Us30 1500 Pips SecuredFX:US30
www.tradingview.com
BSL swept on the 15m followed by 2m IFVG to target PDL

US30 – Holding Above 45,280, Eyeing 45,730 and 46,196The Dow Jones Index has maintained bullish momentum after bouncing from the 45,280 support zone. Price is now trading firmly above this level, with buyers pushing toward the 45,730 resistance. A breakout here could extend the rally toward the 46,196 target.
Support at: 45,280 / 44,970 🔽
Resistance at: 45,730 / 46,196 🔼
🔎 Bias:
🔼 Bullish: Sustained strength above 45,730 keeps 46,196 in focus.
🔽 Bearish: A move back below 45,280 could expose 44,970 as the next support test.
📛 Disclaimer: This is not financial advice. Trade at your own risk.

Us30usd market analysis #US30 technical analysis. Price has broke through upward trend line. Trend line acting as resistance levels now. We should see price continue to drop here.

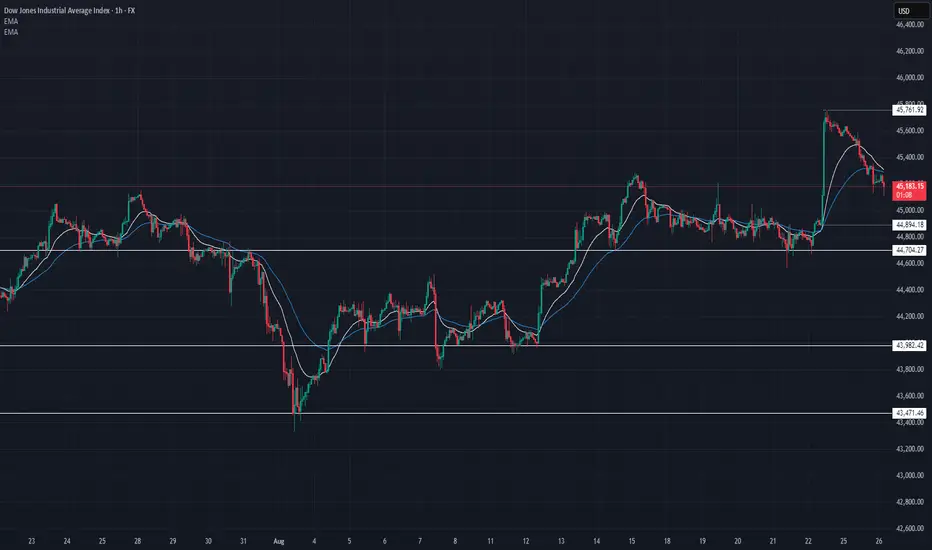
US30 Technical Breakdown – 08/26/2025📍 US30 Technical Breakdown – 08/26/2025
US30 ripped into 45,761 last week but failed to sustain momentum, rejecting hard and pulling back. Now trading around 45,170, price is consolidating just under the EMA cluster and recent highs.
Market is in decision mode: either reclaim 45,300–45,400 for continuation, or break down into the 44,800s.
📊 Current Market Behavior:
📉 Sharp rejection from 45,761 high
🔄 Sideways chop around 45,100–45,200
🧱 Key support holding near 44,894–44,704
⚠️ Momentum cooling after strong move up
📌 Key Levels:
🔹 Resistance Zones:
45,300–45,400 → EMA cluster / intraday pivot
45,500 → Short-term upside target
45,761 → Rejection high / ceiling
🔹 Support Zones:
44,894–44,704 → Crucial intraday support
44,200 → Mid-range demand
43,982–43,471 → Major downside liquidity zone
🧠 Bias:
🔄 Neutral to Slightly Bearish Intraday
Rejection from 45,761 gives sellers short-term control
Bulls need to reclaim 45,300+ to regain momentum
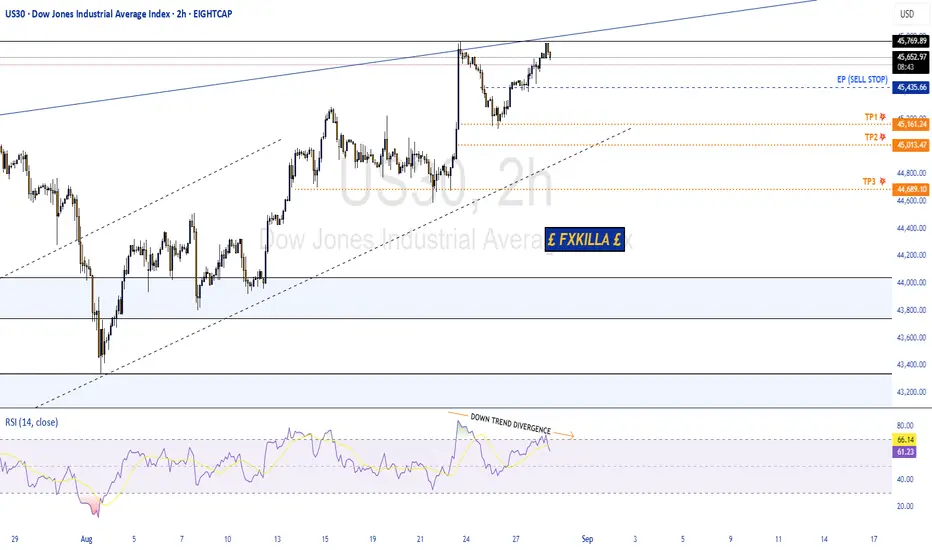
Dow Jones(US30) High Probability Setup SOON!!🚨DOW JONES HIGH PROBABILITY SELL SETUP🚨
* Here We Can See Clearly The Next Potential Move For US30 Coming Hours/Day.
* Here We Can See Clearly The Divergence On RSI Indicating A Reversal Happening.
* Keep A Close Eye On Your Trading Position.
* Happy PIP Hunting Traders.
£ FXKILLA £
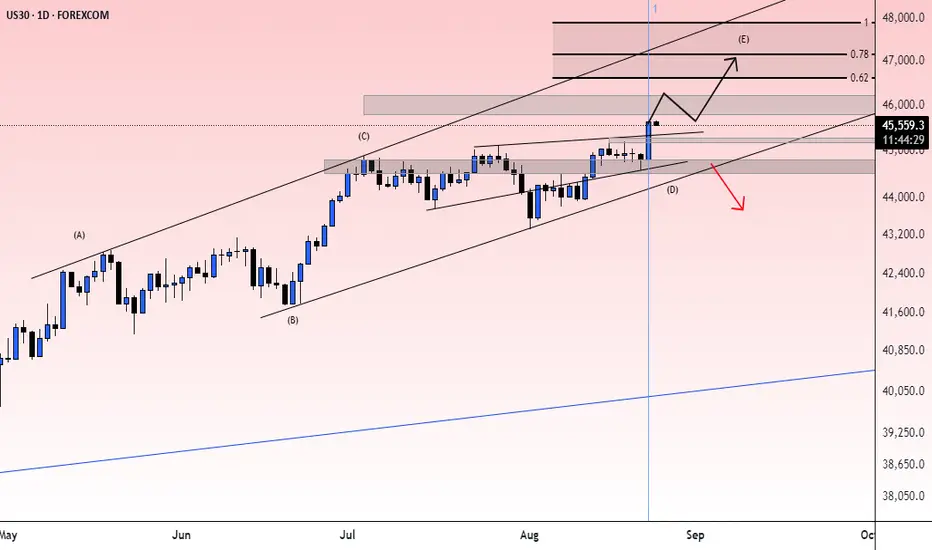
Dow Eyes 45,700-Resistance for Breakout ConfirmationDespite consistently beating market expectations with strong earnings, Nvidia’s Q3 outlook is under pressure. China’s restrictions on importing Nvidia’s H20 chips due to security concerns have weighed on the stock, preventing it from reaching new highs.
Both Nasdaq and Nvidia shares are still trading below their respective record highs, limiting upside potential for the Dow and S&P 500, especially in light of ongoing US-EU political and economic instability.
While the Dow Jones holds above the 45,000 mark, it now faces key resistance at 45,700, which must be comfortably breached to confirm further bullish continuation toward 46,200, 47,100, and 48,000. These levels align with the upper boundary of a well-respected ascending channel in place since May 2025.
On the downside, should political and economic pressures dampen risk appetite, and if overbought RSI conditions resurface, a drop below 45,000 may open the door to further losses toward 44,500 and 43,800.
Written by Razan Hilal, CMT

Dow Jones Rejected at 45,680 Ahead of GDP DataUS30 – Overview
GDP Data in Focus After Rejection From Resistance
The Dow Jones reached the 45,680 resistance level mentioned in the previous outlook and has since stabilized below it. Today, price action will likely be influenced by the upcoming U.S. GDP release, which could increase volatility.
🔹 Technical Outlook
As long as the index trades below 45,680, bearish momentum is favored toward 45,450.
A confirmed 1H close below 45,430 would strengthen the bearish move, opening the way to 45,285 → 45,110.
However, if price closes a 1H candle above 45,680, bullish momentum could resume, with upside targets at 45,860 → 45,980.
🔹 Key Levels
Pivot: 45,680
Resistance: 45,860 – 45,980
Support: 45,450 – 45,285 – 45,110
✅ Summary:
US30 has rejected resistance at 45,680 and remains under pressure ahead of the GDP release. Watch 45,680 as the pivot: staying below keeps the bearish bias intact, while a breakout above would signal renewed bullish momentum.

US30: Will 45,110 Hold or Break Lower?US30 – Overview
Bearish Drop Reaches Target, Market Consolidates at Key Levels
The Dow Jones (US30) dropped over 450 points, exactly reaching the downside targets highlighted in the previous idea.
For now, the index is expected to test 45,110 and then consolidate within the 45,110 – 45,285 range until a breakout occurs.
🔹 Technical Outlook
A 1H close below 45,110 would extend the bearish move toward 44,950. A further break lower opens the path to 44,720 → 44,610.
A 1H close above 45,285 would shift momentum bullish, targeting 45,410 → 45,580.
🔹 Key Levels
Support: 45,110, 44,950 – 44,720
Resistance: 45,285 – 45,410 – 45,580
✅ Summary:
US30 has completed its bearish move and is now consolidating around the 45,110 pivot. Watch for a confirmed 1H close to determine whether the next leg is a continuation lower or a rebound higher.

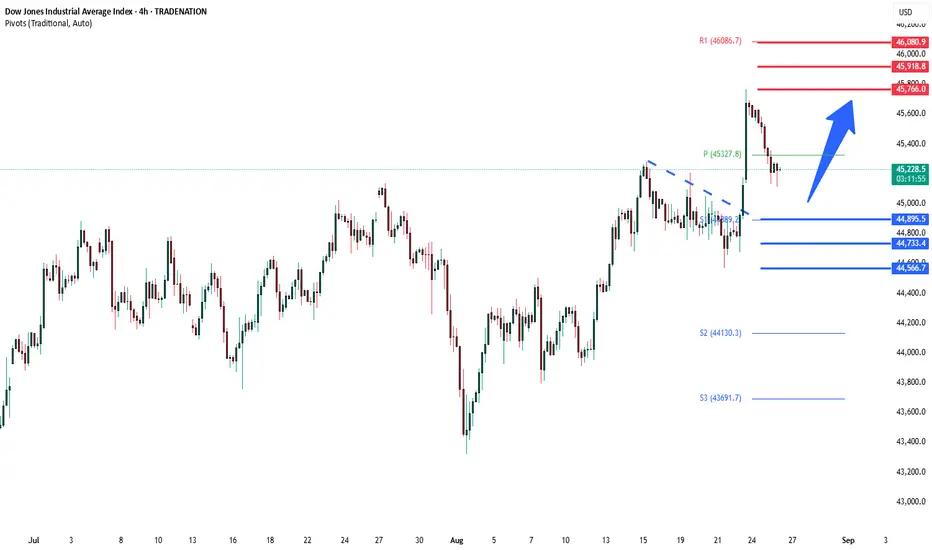
DowJones uptrend supported at 45050Key Support and Resistance Levels
Resistance Level 1: 45766
Resistance Level 2: 45920
Resistance Level 3: 46080
Support Level 1: 45050
Support Level 2: 44900
Support Level 3: 44733
This communication is for informational purposes only and should not be viewed as any form of recommendation as to a particular course of action or as investment advice. It is not intended as an offer or solicitation for the purchase or sale of any financial instrument or as an official confirmation of any transaction. Opinions, estimates and assumptions expressed herein are made as of the date of this communication and are subject to change without notice. This communication has been prepared based upon information, including market prices, data and other information, believed to be reliable; however, Trade Nation does not warrant its completeness or accuracy. All market prices and market data contained in or attached to this communication are indicative and subject to change without notice.

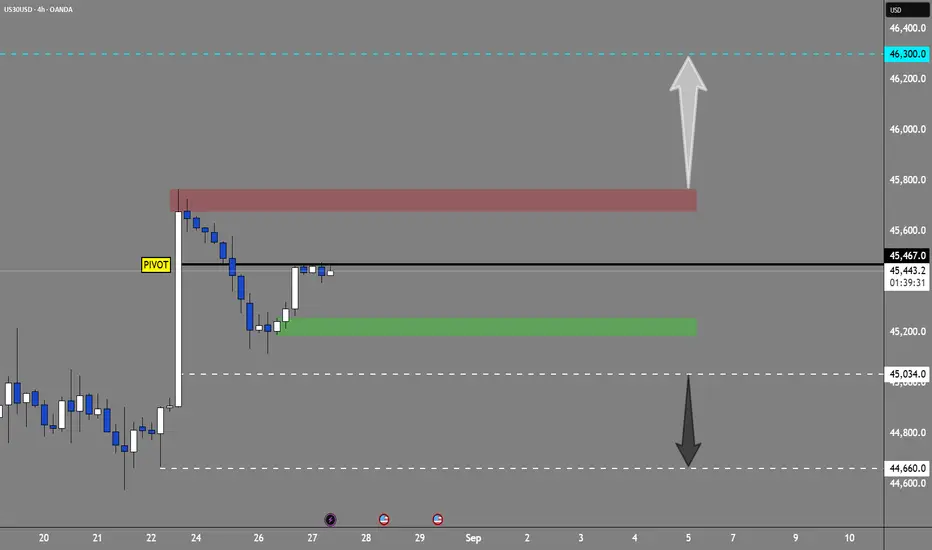
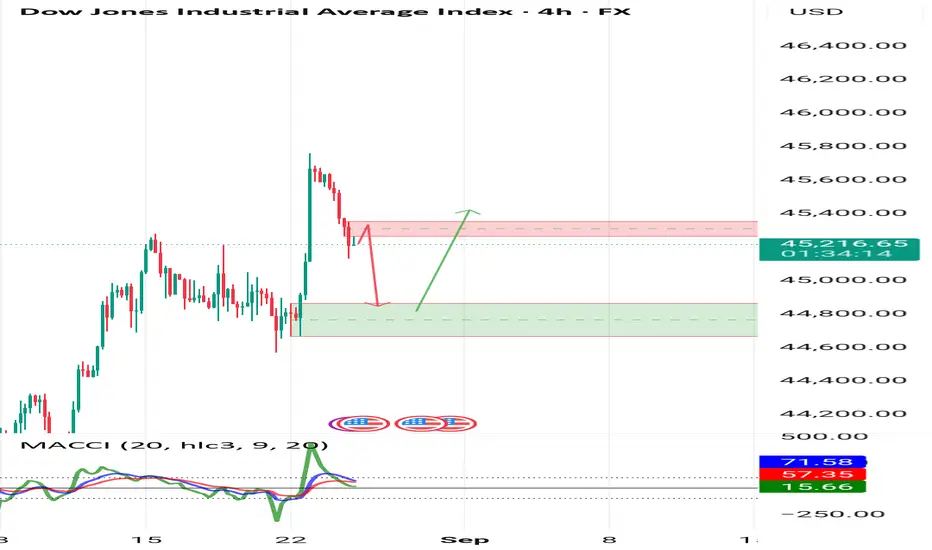
Analysis of the Dow Jones movementThe overall trend is bullish, but for a proper entry it’s better to wait until the price reaches the green zone. At the same time, a risky short opportunity from the red zone is also possible.
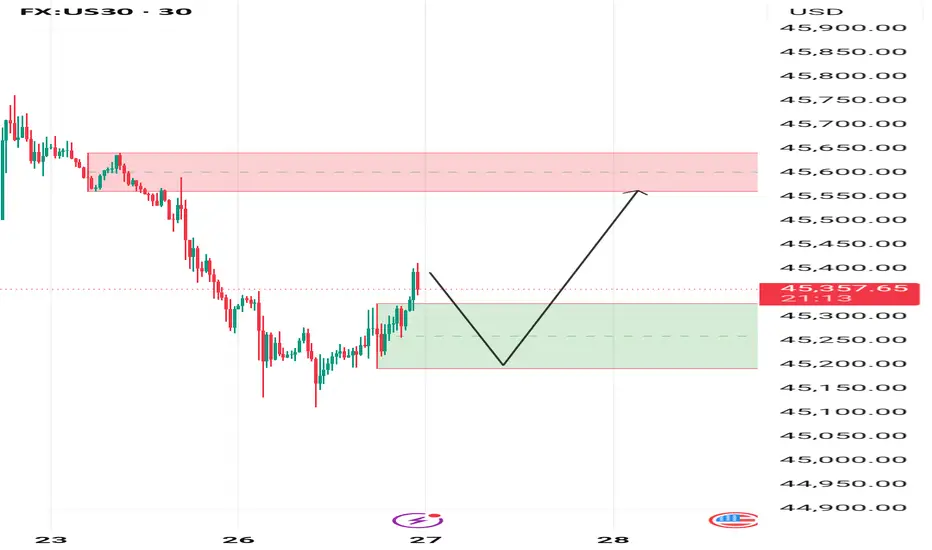
A buy setup has formed for the Dow JonesThe previous resistance level has been broken, and now with a pullback to the identified zone, we can look for buying opportunities towards the higher level
LONG DJ / US30 READINGContinuation after a PullBack On H1 timeframe
Another Entry can be done on the current Trend Line to the upside.
After a Breakout to the upside which is still valid for a Buy trade
Entry Price .... 45,230.00
DJ / US30... 45,230.0
S/L ...45,100.00
T/P ...45,320.0
Also looking at a final touch to 46,000.0 LEVEL.
And More

US30 / Dow Jones Technical AnalysisThe Dow Jones index is currently in a general uptrend, with a downward corrective movement on the hourly timeframe.
1️⃣ Bullish Scenario:
If a bullish momentum leads to a rebound from the 45,200 area and the price holds above 45,360, the index may target 45,700, with continued buying pressure potentially opening the way toward 46,000.
2️⃣ Bearish Scenario:
However, if the price remains below 45,200, this could push the index to test the 44,950 area.

Dow Key Trading Levels Key Support and Resistance Levels
Resistance Level 1: 45766
Resistance Level 2: 45920
Resistance Level 3: 45080
Support Level 1: 44900
Support Level 2: 44733
Support Level 3: 44566
This communication is for informational purposes only and should not be viewed as any form of recommendation as to a particular course of action or as investment advice. It is not intended as an offer or solicitation for the purchase or sale of any financial instrument or as an official confirmation of any transaction. Opinions, estimates and assumptions expressed herein are made as of the date of this communication and are subject to change without notice. This communication has been prepared based upon information, including market prices, data and other information, believed to be reliable; however, Trade Nation does not warrant its completeness or accuracy. All market prices and market data contained in or attached to this communication are indicative and subject to change without notice.
US 30 INDEX TRADE IDEA 26 AUGUST 2025
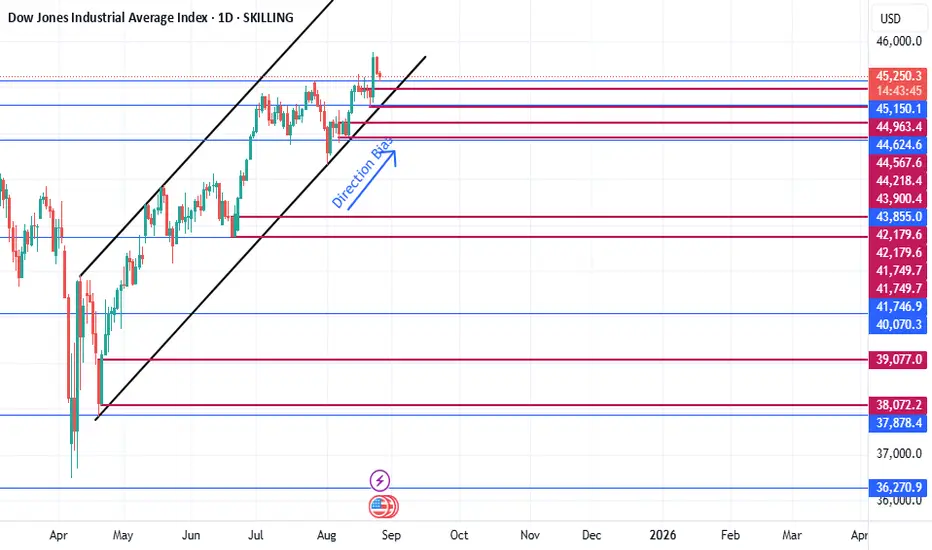
The US30 (Dow Jones) remains within a well-defined bullish channel, with recent price action rejecting the upper boundary around 45,350–45,261 . This rejection looks like a liquidity grab above prior highs, a common SMC move before a deeper retracement. The nearest demand zone lies between 44,624 – 44,218 , which coincides with an order block and previous consolidation. As long as price holds this zone, the market structure remains bullish, and longs targeting 45,261 and eventually 46,000 are favorable. A break below 43,855 , however, would signal a market structure shift to bearish, opening downside targets at 42,179 – 41,746 .
From a fundamental perspective , momentum is supported by expectations of a Fed rate cut before year-end to counter slowing growth, which generally boosts equity indices. Corporate earnings have surprised to the upside, helping maintain investor confidence. However, geopolitical risks—notably rising trade tensions between the US and China and instability in Eastern Europe—could spark risk-off sentiment, leading to sharp pullbacks. Additionally, the strong US dollar is pressuring exporters, which may weigh on the index in the short term.
Trade idea: Watch for a rejection and bullish confirmation in the 44,624–44,218 demand zone to enter long positions, with stops below 43,855 and targets at 45,261 and 46,000. If macro news worsens (e.g., escalation in geopolitical risks or hawkish Fed comments), and price breaks below 43,855, flip bias to shorts, aiming for 42,179 and possibly 41,746.
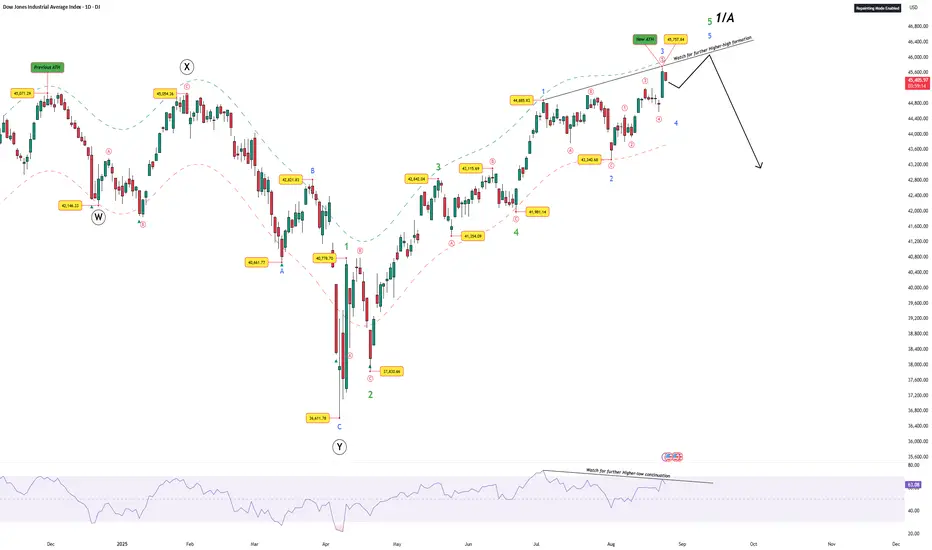
Dow Jones – Elliott Wave Setup Near All-Time HighsThe Dow Jones Industrial Average has printed a Wave 3 high at 45,757.84 , with the structure suggesting that an internal Wave 4 pullback is unfolding. Once this is complete, a final Wave 5 push could follow, potentially driving the index into fresh all-time highs.
Alternatively, the recent high at 45,757.84 may already mark the completion of Wave 5 . If that is the case, the corrective phase has already begun.
On the RSI , a clear bearish divergence is visible: while price has moved higher, momentum has failed to confirm. This often signals that the current leg of the rally is losing steam.
Based on Elliott Wave guidelines, the entire advance from 34,611 can be counted as either:
Wave 1 of a new bullish impulse, or
Wave A of a larger corrective structure .
In both cases, a corrective phase will follow once Wave 5 completes. Standard retracements are typically in the 0.382–0.618 Fibonacci zone , but the exact levels can only be projected after the Wave 5 top is confirmed.
⚠️ Invalidation Note: The current view expects a correction after the final Wave 5. However, if the index continues to trend strongly higher without respecting this sequence, the bearish setup is invalidated and the wave structure must be re-evaluated.
Summary:
Current status: Wave 3 high at 45,757.84 .
Expecting: Wave 4 pullback, then a Wave 5 push to new highs.
After Wave 5: Retracement likely in the 0.382–0.618 zone (levels to be projected once Wave 5 is fixed).
Risk: Invalidation if price keeps trending higher without corrective behavior.
Disclaimer: This analysis is for educational purposes only and does not constitute investment advice. Please do your own research (DYOR) before making any trading decisions.
US30 Trade Set Up Aug 25 2025FX:US30
www.tradingview.com
Us30 Trade Set Up: price has created a huge gap between HH/HL so i want to see more price action play out but we got sell side liquidity on the 15m that can be tested. If price sweeps and closes above i will look for buys but if price closes below we could see the start of a bigger pull back down before continuing higher

Breaking: Dow Jones's Overbought RSI Signals Correction Risk
Current Price: $45631.74
Direction: SHORT
Targets:
- T1 = $45150.00
- T2 = $44500.00
Stop Levels:
- S1 = $46000.00
- S2 = $46350.00
**Wisdom of Professional Traders:**
This analysis synthesizes insights from thousands of seasoned traders and market experts who closely monitor the Dow Jones. Leveraging collective intelligence, this approach identifies exaggerated momentum trends and potential reversal points. Many professionals agree that while the Dow Jones has gained significant ground, conditions such as overbought RSI and failing momentum indicators suggest a high-probability corrective phase.
**Key Insights:**
The Dow Jones has surged in value over the past weeks amid increased optimism regarding economic resilience and robust earnings reports from major corporates. However, key technical indicators are flashing warning signs. The Relative Strength Index (RSI) shows extreme overbought conditions above 70, historically a precursor to price stagnation or correction. Volume analysis also reveals weakness in buying pressure, further supported by bearish divergence across key oscillators.
The macroeconomic landscape remains a potential catalyst for volatility, with central banks globally hinting at further tightening amid stubborn inflation. Traders are advised to remain cautious as equity indices like the Dow Jones frequently react sharply to rate hikes or hawkish policy outlooks.
**Recent Performance:**
The Dow Jones has rallied more than 8% in the past month, driven by improving sentiment around corporate profitability and relief over lighter-than-expected economic data. However, upward momentum appears to be stalling at key resistance levels, as price activity creates narrowing candles, indicative of indecision. Furthermore, recent sessions have seen increased intraday failures to hold higher price levels, signaling weakening upside conviction.
**Expert Analysis:**
Prominent financial analysts are flagging concerns about the Dow's sustainability in this high-price zone. Market technicians observe multiple bearish technical patterns forming, including divergence on the MACD and a thinning Bollinger Band width indicating lower volatility ahead. These signals, combined with declining buyer enthusiasm, make the current trading environment ripe for a potential pullback. On the fundamental side, persistently elevated interest rates and looming recessionary fears may continue to weigh on valuation multiples.
**News Impact:**
Recent news surrounding geopolitical instability and renewed supply chain disruptions may add pressure on sentiment, fueling a risk-off environment. Additionally, upcoming earnings reports could spark further volatility as the market adjusts to existing macroeconomic headwinds. While some major companies have outperformed expectations, overall guidance leans cautious, emphasizing the need for traders to tread carefully.
**Trading Recommendation:**
Given the overextended technicals and diminishing buying momentum, taking a SHORT position on the Dow Jones presents a sensible choice. Price action and technical indicators suggest a correction phase is plausible, offering opportunities to capitalize on expected downside movements. Setting tight stop-losses around $46350 ensures protection in case the index defies odds and breaches resistance levels further. Maintain vigilance against macroeconomic updates that could cause abrupt sentiment changes.
Do you want to save hours every week? Register for the free weekly update in your language!

US30 Correction in Play — Will 45,285 Hold?US30 – Overview
After Powell’s Jackson Hole remarks boosted rate-cut expectations (now nearly 90% probability for September), indices remain in focus with volatility high.
🔹 Technical Outlook
The Dow is currently in a bearish correction toward 45,410.
If the price stabilizes below 45,410, the correction could extend toward 45,285.
Failure to break 45,285 would likely trigger a rebound, pushing the price back toward 45,690 and 45,860.
🔹 Key Levels
Support: 45,410 – 45,285 – 45,100
Resistance: 45,690 – 45,860
✅ Summary:
The Dow is consolidating within a correction phase. The bias remains broadly bullish in line with Fed expectations, but a deeper dip to 45,285 is possible before another upward attempt. A breakout above 45,690 would confirm fresh bullish momentum.

uptrend Waiting for the arrival of the guild, a triangle with the completion of its upside and with the direction of a final upward wave, when the start of an upward spiral is possible.
It is fixed and fixed with a limited resistance, which is supported by a continuous upward spiral, which is close to each other.
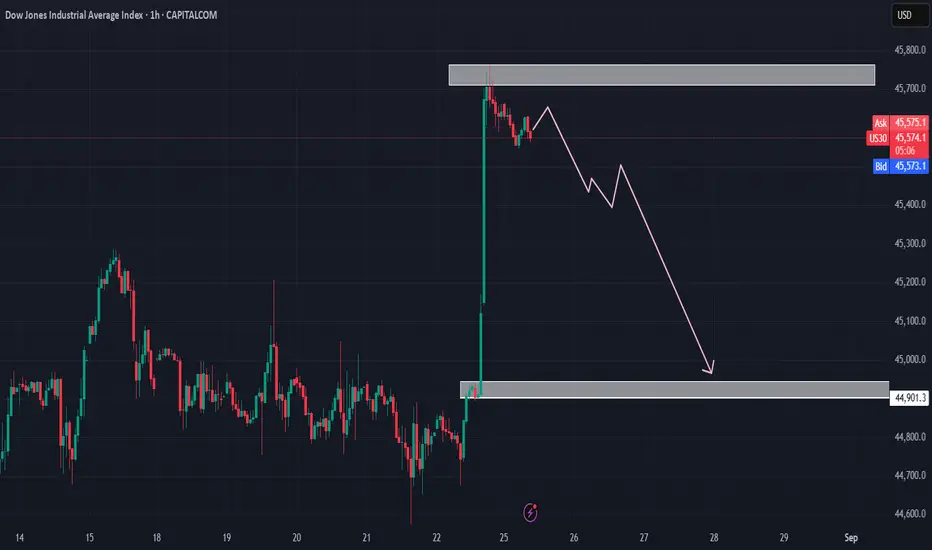
SELL US30Dow Jones Industrial Average (US30) is showing bearish momentum, targeting a move down to 44,901.3. The market favors sellers below recent resistance, so maintain a short bias. Place stops above the latest swing high to manage risk.