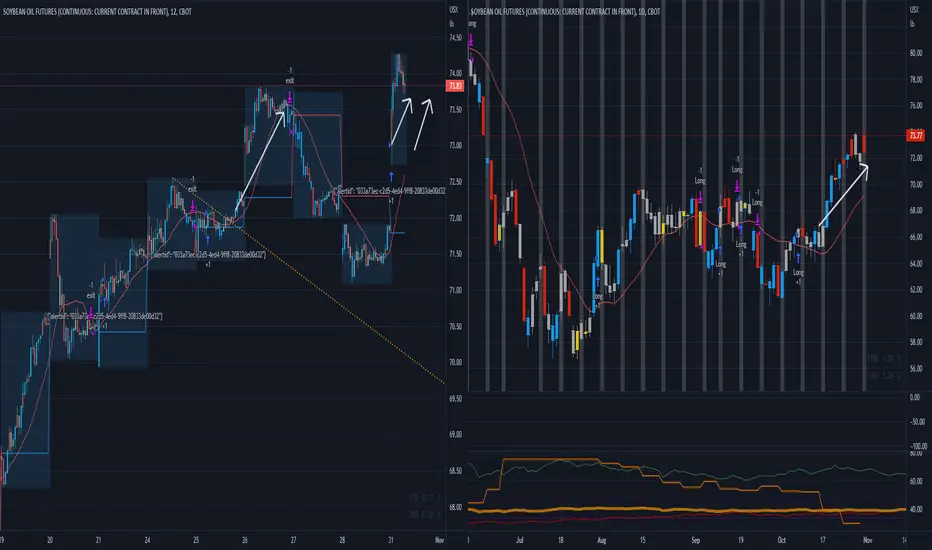
Soybean Oil is still longonly a few commodities are currently on my long trade list
www.tradingview.com
Today an entry on the 12 min chart was also possible, but like last week the better entry will be near the 18 SMA for a longer term play...
ZLH2020 trade ideas
SOYBEAN OIL // long term scenariosI don't know anything about Soybean Oil, but I watch the price that shows everything I need to know.
This is quite a long term one since it's the weekly, but it's so beautiful! Although the primary trend is still long, market participants printed a nice impulse wave on the way down. This last couple of slow waves make up a correction of the impulse wave while crawling up, and price has just tested the last weekly south breakout.
From here, the break of this countertrend takes aim at this market , shorts will be ready to jump in.
An early sign happens first with the break of the last weekly north breakout, but the second one is better. If price reaches it, be patient. It may slow down there, even make a small countertrend, but a break of this zone can take the price all the way to the next weekly north breakout, that's happen to be close to the target fibo 138.2
The early sign becomes valid only when this week's closing makes the breakout a breakout (higher than the previous high).
The countertrend is valid at the moment, but the daily printed a nice shooting star...
Thanks for reading my analysis!🤘🏽
Trade safe and let me know what you think! ⚪️⚫️
--------------------------------------------------------------------------------
ANYWAY, a lot of Qs about the direction of the price. But it doesn't matter.
WE JUST REACT!
Remember that trading is a business.
SIZE your TRADES according to your risk aversion!
----------------------------------------------------------

forecasting SOYBEAN OIL , ZL ,in dayli chart Hello to all investors, according to my previous studies and according to my experience as a trader, I see a good investment opportunity with a high probability of success, the details are reflected in the graph
Keep in Mind at double bottom in sideways marketsA much safer way to trade Trendcontinuation is to enter long at a double bottom rather than wait for another breakout above prior day high.
As long as 18 moving average is point up the long trend does not stop :-)

Soyabeen Oil commodity USA Sun Storm Investment Trading Desk & NexGen Wealth Management Service Present's: SSITD & NexGen Portfolio of the Week Series
Focus: Worldwide
By Sun Storm Investment Research & NexGen Wealth Management Service
A Profit & Solutions Strategy & Research
Trading | Investment | Stocks | ETF | Mutual Funds | Crypto | Bonds | Options | Dividend | Futures |
USA | Canada | UK | Germany | France | Italy | Rest of Europe | Mexico | India
Disclaimer: Sun Storm Investment and NexGen are not registered financial advisors, so please do your own research before trading & investing anything. This is information is for only research purposes not for actual trading & investing decision.
#debadipb #profitsolutions

Looking for a sharp reversal on Soybean OilSoybean oil futures closed last session on a long established support level and down fib extension. With crude climbing back up and after today's sell off this is likely to pop when the market re-opens.

new opportunity for sale in zlthe trend line and indicator have been breached and a pattern has been formed here that we can enter

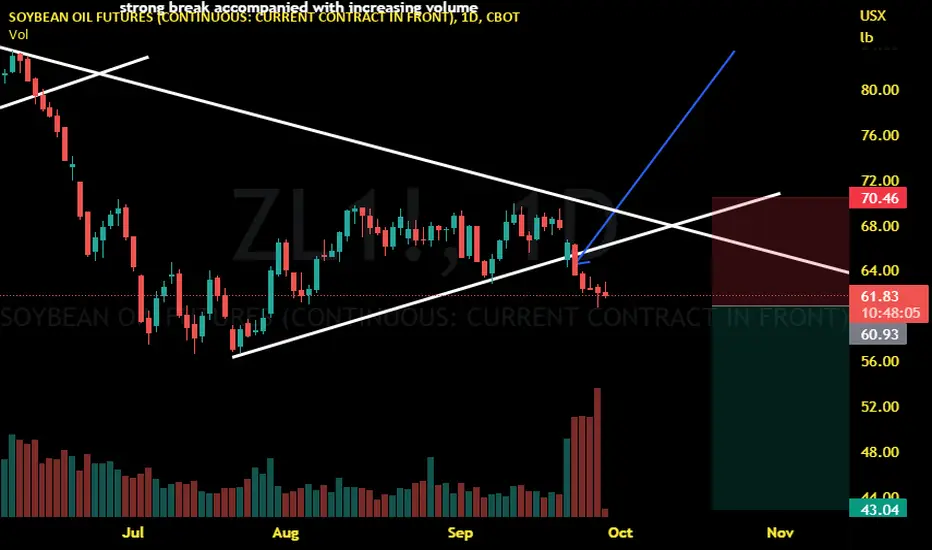
How do we ride through the selloff storm?Joining a global commodities rout, Soybean Oil had a rough time in the past 2 weeks, tumbling close to 22%. The move precipitated after breaking the 6-month uptrend and has struggled to find support until now.
After bouncing off the $65 support level and the 61.8% Fibonacci retracement, prices seem to have found a floor, ready to make the next leg upwards.
Zooming out to the daily candles, we see Relative Strength Index (RSI) deeply oversold, with only 2 other occasions since 2015 where the RSI reached such levels. One was in 2015 and the other one in 2020.The 2015 instance was followed a 50% price increase from the low of the RSI and the 2020 one was followed by a massive 196% price increase.
The sharp selloff, strong support levels, and historical precedence allow us to favor the long side for Soybean Oil.
Entry at 66.87, stops at 58.3. Target at 78.9.
Disclaimer:
The contents in this Idea are intended for information purpose only and do not constitute investment recommendation or advice. Nor are they used to promote any specific products or services. They serve as an integral part of a case study to demonstrate fundamental concepts in risk management under given market scenarios.

New ZL bull cycle beginning 20220623 - SyedNew ZL bull cycle beginning 20220623. Simply Elliot Wave and Fibonacci technical analysis.

just a guessi will be following this drawing.
* None of what i write here is not an investment advice. Please do your own research before investing in any digital asset.
* Never take my personal opinions as investment advice, you may lose your money.

Short trend ends on soybean oilCrude Oil and Soybean Oil had nice moves to the downside after INSIDEDAYs
have a look at other markets are either in long or downtrends:
www.tradingview.com
at least for soybean oil its time to take profits at aprils low...

Potential Bearish ContinuationPreferred Case: on the H4, with price moving in a descending trend channel and moving below the ichimoku cloud, we have a bearish bias that price will drop from the pivot at 80.73 in line with the 78.6% fibonacci projection and swing high to the 1st support at 76.83 in line with the horizontal swing low and 78.6% fibonacci projection.
Alternative scenario: Alternatively, price may reverse off the pivot and rise to the 1st resistance at 84.40 in line with the swing high.
Any opinions, news, research, analyses, prices, other information, or links to third-party sites contained on this website are provided on an "as-is" basis, as general market commentary, and do not constitute investment advice. The market commentary has not been prepared in accordance with legal requirements designed to promote the independence of investment research, and it is therefore not subject to any prohibition on dealing ahead of dissemination. Although this commentary is not produced by an independent source, FXCM takes all sufficient steps to eliminate or prevent any conflicts of interest arising out of the production and dissemination of this communication. The employees of FXCM commit to acting in the clients' best interests and represent their views without misleading, deceiving, or otherwise impairing the clients' ability to make informed investment decisions. For more information about the FXCM's internal organizational and administrative arrangements for the prevention of conflicts, please refer to the Firms' Managing Conflicts Policy. Please ensure that you read and understand our Full Disclaimer and Liability provision concerning the foregoing Information, which can be accessed on the website.

Dining out soon?China, one of the largest consumer of soybean oil, has tapered its demand for the edible oil due to COVID-related control measures over the past few months. With new cases falling and lockdown for Shanghai expected to be lifted soon, we see positive demand drivers on the horizon for soybean oil. Restaurants are among the largest consumers of the oil. As consumers resume their normal consumption patterns and dining out becomes the norm again, it’s easy to see the impact on demand.
Looking at the charts, we see a falling wedge pattern since April (where prices make lower highs and lower lows) which generally indicates an upside breakout could be near. On a longer timeframe, we are close to the 6-month uptrend line, where prices have bounced off in the past.
Additionally the $78 resistance level provides us with further confidence that prices are likely to remain supported at the current levels before making a jump higher.
As demand from the world’s largest consumer of soybean oil revives and technical levels remain intact, we expect more upside from here!
Staggered entry at 79.25 and 78.25 with stops below 77.25 and targets at 84 and 87.60.
Disclaimer:
The contents in this Idea are intended for information purpose only and do not constitute investment recommendation or advice. Nor are they used to promote any specific products or services. They serve as an integral part of a case study to demonstrate fundamental concepts in risk management under given market scenarios.

Buy StrengthSoybean Oil futures is on a rip. It appears to have made a 4rd wave and then pulled back in wave 4, which is an ideal time to long. Stop losses are placed below the 0.5 level, because moving below this level means there is something like 90% chance that we are wrong.
Thanks for playing.

Buy Bean oil @ Market- 1st TP 84.72, Stop @78.90Buy Bean oil @ Market- 1st TP 84.72, Stop @78.90
**Trading commodity futures and options involves substantial risk of loss.
The recommendations contained in this letter is of opinion only and
does not guarantee any profits. These are risky markets and only
risk capital should be used. Past performance is not indicative of future results**
hypothetical performance results have many inherent limitations, some of which are described below. no representation is being made that any account will or is likely to achieve profits or losses similar to those shown. in fact, there are frequently sharp differences between hypothetical performance results and the actual results subsequently achieved by any particular trading program.
one of the limitations of hypothetical performance results is that they are generally prepared with the benefit of hindsight. in addition, hypothetical trading does no involve fina
ncial risk, and no hypothetical trading record can completely account for the impact of financial risk in actual trading. for example, the ability to withstand losses or to adhere to a particular trading program in spite of trading losses are material points which can also adversely affect actual trading results. there are numerous other factors related to the markets in general or to the implementation of any specific trading program which cannot be fully accounted for in the preparation of hypothetical performance results and all of which can adversely affect actual trading results.

Soyabeen Oil Commodity USA Sun Storm Investment Trading Desk & NexGen Wealth Management Service Present's: SSITD & NexGen Portfolio of the Week Series
Focus: Worldwide
By Sun Storm Investment Research & NexGen Wealth Management Service
A Profit & Solutions Strategy & Research
Trading | Investment | Stocks | ETF | Mutual Funds | Crypto | Bonds | Options | Dividend | Futures |
USA | Canada | UK | Germany | France | Italy | Rest of Europe | Mexico | India
Disclaimer: Sun Storm Investment and NexGen are not registered financial advisors, so please do your own research before trading & investing anything. This is information is for only research purposes not for actual trading & investing decision.
#debadipb #profitsolutions

Bullish remaining strong soybeanSub5major5 WEEKLY,
AND now I'm assuming sub4major 5 H4 have finished and making its last subwave 5.
BULLISH is still remaining STRONG

Soybean Oil Futures (ZL1!), H1 Potential for Bearish ContinuatioType : Bearish Continuation
Resistance: 85'46
Pivot: 83'76
Support : 82'04
Preferred case: With price expected to reverse off the resistance of the ichimoku cloud , we see a potential bearish continuation from our pivot level of 83'76 which is in line with 50% Fibonacci retracement and horizontal pullback resistance towards our 1st support level of 82'04 which is in line with the horizontal pullback support and 38.2% Fibonacci retracement .
Alternative scenario: Alternatively, price may break our pivot structure and head for 1st resistance level of 85'46 in line with 50% Fibonacci retracement and horizontal pullback resistance.
Fundamentals: No major news.

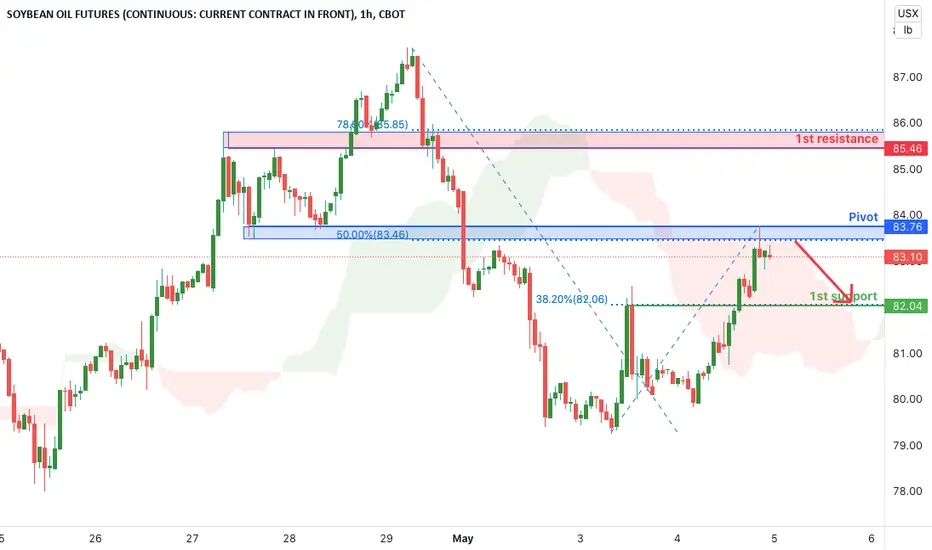
Soybean Oil Futures (ZL1!), H1 Potential for Bearish ContinuatioType : Bearish Continuation
Resistance: 85'46
Pivot: 83'76
Support : 82'04
Preferred case: With price expected to reverse off the resistance of the ichimoku cloud, we see a potential bearish continuation from our pivot level of 83'76 which is in line with 50% Fibonacci retracement and horizontal pullback resistance towards our 1st support level of 82'04 which is in line with the horizontal pullback support and 38.2% Fibonacci retracement.
Alternative scenario: Alternatively, price may break our pivot structure and head for 1st resistance level of 85'46 in line with 50% Fibonacci retracement and horizontal pullback resistance.
Fundamentals: No major news.
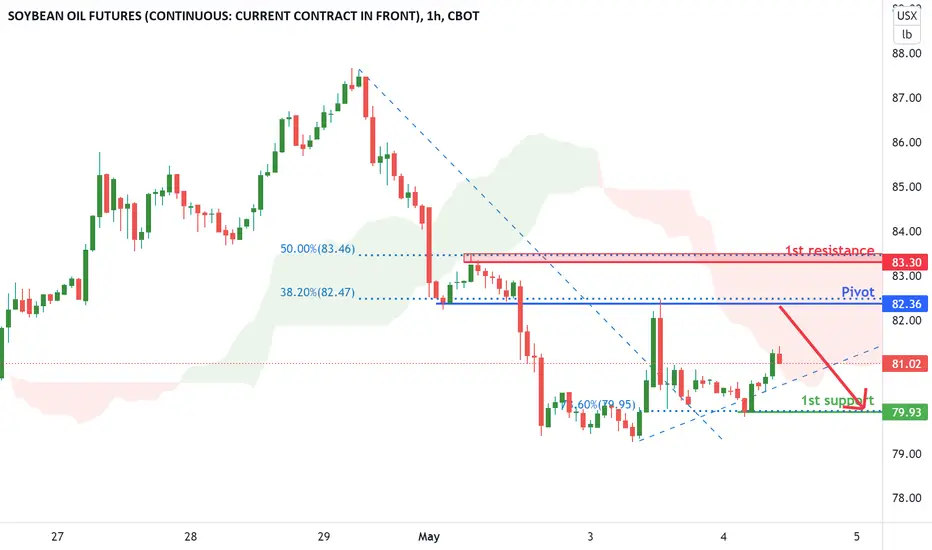
Soybean Oil Futures (ZL1!), H1 Potential for Bearish ContinuatioType : Bearish Continuation
Resistance: 83'30
Pivot: 82'45
Support : 79'93
Preferred case: With price expected to reverse off the resistance of the ichimoku cloud, we see a potential bearish continuation from our pivot level of 82'45 which is in line with 38.2% Fibonacci retracement and horizontal pullback resistance towards our 1st support level of 79'93 which is in line with the horizontal swing low support and 78.6% Fibonacci retracement.
Alternative scenario: Alternatively, price may break our pivot structure and head for 1st resistance level of 83'30 in line with 50% Fibonacci retracement and horizontal swing high resistance.
Fundamentals: No major news.
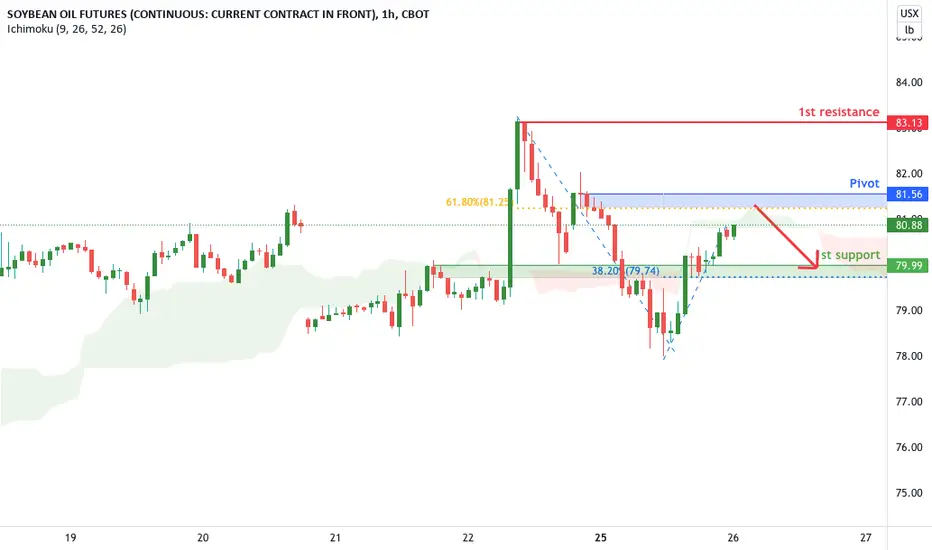
Soybean Oil Futures (ZL1!), H1 Potential for Bearish ContinuatioType : Bearish Continuation
Resistance: 83'13
Pivot: 81'56
Support : 79'99
Preferred case: With price expected to reverse off the resistance of the ichimoku cloud, we see a potential bearish continuation from our pivot level of 81'56 which is in line with 61.8% Fibonacci retracement and horizontal overlap resistance towards our 1st support level of 79'99 which is in line with the horizontal swing high resistance.
Alternative scenario: Alternatively, price may break our pivot structure and head for 1st resistance level of 83'13 in line with 38.2% Fibonacci retracement and horizontal pullback resistance.
Fundamentals: No major news.
Long July Bean Oil at Market(ZLN22)Buy July bean oil market at Market. Stop price is 7236, 1st Target Profit(TP) 79.72

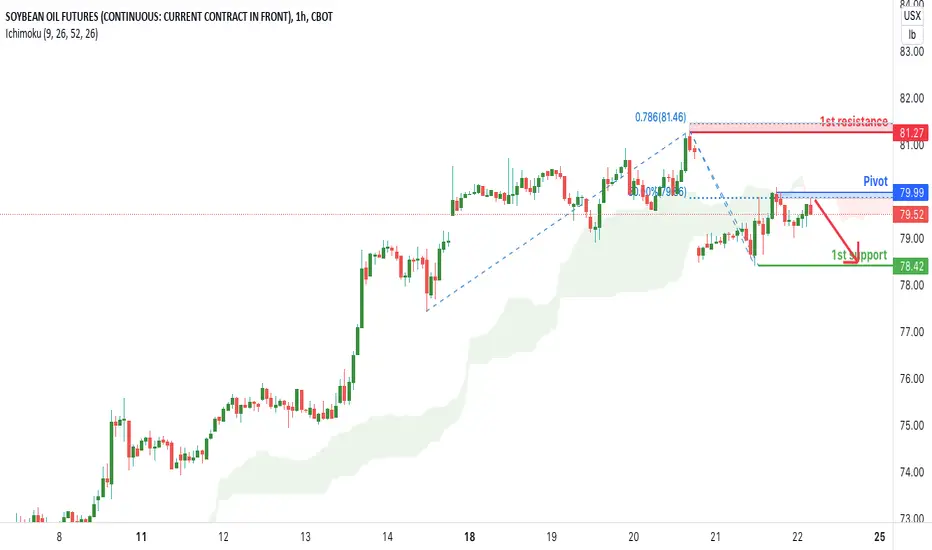
Soybean Oil Future (ZL1! ), H1 Potential for Bearish ContinuatioType : Bearish Continuation
Resistance: 81.27
Pivot: 79.67
Support : 78.42
Preferred case: With price moving below the ichimoku cloud, we see a potential bearish continuation from our pivot level of 79.67 which is in line with 50% Fibonacci retracement towards our 1st support level of 78.42 which is in line with the horizontal swing low support.
Alternative scenario: Alternatively, price may break our pivot structure and head for 1st resistance level of 81.27 in line with 78.6% Fibonacci projection.
Fundamentals: No major news.