(ZN1!): The Wedge of Decision. Rate Cut Confirmation Imminent ?The Core Thesis: The 10-Year T-Note futures price has been locked in a massive, multi-year symmetrical triangle or falling wedge pattern. A decisive breakout from this formation will not only determine the next phase of the bond market but will also confirm the direction of the 10-Year Yield, which acts as the global benchmark for borrowing costs.
Technical View: The Wedge Breakdown/Breakout
The Pattern: The Weekly chart shows a clear consolidation, characterized by lower highs and higher lows, forming a tightening range. The market is coiling, anticipating a major break.
Breakout Level (Bullish): A sustained Weekly close above the upper trendline, which corresponds roughly to the 113'16 to 114'00 zone on the chart, would signal a bullish breakout.
Price Implication: T-Note prices move UP (a bullish breakout).
Yield Implication: The 10-Year Yield (US10Y) moves DOWN.
Breakdown Level (Bearish): A definitive close below the lower trendline (around the recent lows, near 112'00) would signal a bearish breakdown.
Price Implication: T-Note prices move DOWN (a bearish breakdown).
Yield Implication: The 10-Year Yield (US10Y) moves UP.
Trade ideas

10-Year Treasuries Into FOMC: What to Expect1. Big Picture: What’s Been Driving Bonds?
Over the past several months, the U.S. Treasury market has been defined by diverging forces across the curve, the short end (2Y, 5Y) pricing near-term monetary policy outcomes and the long end (10Y, 30Y) reflecting inflation persistence, fiscal supply, and long-horizon term premium.
The short end has behaved like a proxy for rate-cut expectations, compressing aggressively whenever inflation cools or recession probability ticks higher. Meanwhile, the long end has been more sensitive to duration demand, bond auctions, and forward-looking macro risk, often moving independently when supply shocks or inflation surprises hit the tape.
The result? A curve driven by two narratives: policy timing vs long-run risk.
This sets the stage for next week’s meeting and the reaction likely depends less on the cut itself and more on the messaging around rate trajectory.
2. What did the Market do?
Following the U.S.–China tariff escalation in April (formerly referred to casually as the “Trump Tariff War,” though a better description is the Tariff Re-Escalation Phase), the ZN stabilized. Buyers stepped in between May to July 2025, compressing price toward the 112'08'0 region, which is a key daily resistance zone.
In early September, momentum shifted. Buyers overwhelmed offers and lifted prices through 112'08'0, and the move appears linked to expectations of a softer policy stance and improving forward inflation indicators during the first week of September.
Sellers responded at 113'07'0 area and market has been trapped in a three-month range between 113'25'0 high and 112'08'0 low.
This week, price rotated from the top of range and swept through the composite LVN 113'00'0 to 112'24'0, near the 1st 3 weeks of November composite VPOC.
3. What to Expect: Scenarios Into FOMC Week
Until the rate decision, compression seems likely.
Expect 2 way indecision before FOMC:
Expect two-way trade between 113'03'0 (LVN) and 112'24'0 (1st 3 weeks of Nov composite VPOC) as the market waits for the FOMC.
Bearish Scenario (Base case):
If sellers hold at 113'03'0, continuation lower toward 112'07'0 (range low / composite VAL)
Bullish Scenario:
If buyers reclaim 113'03'0 decisively, possible market move back up to 113'23'0 (Daily Range high), keeping the multi-month balance intact and potentially positioning for a breakout if FOMC guidance surprises dovish.
4. FOMC Risk: What Could Surprise the Market?
The market is currently pricing ~88.6% probability of a 25bps cut which means the cut itself is not the event. The surprise lies in the tone.
🟢 Bullish Bond Reaction (Yields lower) if:
Forward guidance hints at a sequence of cuts, not a one-off
Growth risks emphasized > inflation risks
Dovish dissent or language suggesting easing bias remains intact
🔴 Bearish Bond Reaction (Yields higher) if:
The Fed downplays future cuts or signals higher-for-longer
Inflation risk is prioritized
Dot-plot or press Q&A implies only one cut on table
Conclusion
Unless the press conference delivers a clear dovish or hawkish surprise, expect a similar indecisive, two-way response in the markets, similar to past FOMC market reactions.
What’s your call on ZN and the bond markets going into the week of FOMC? Drop a comment and give a boost so more traders can weigh in.
Disclaimer: This is not financial advice. Analysis is for educational purposes only; trade your own plan and manage risk.

Projecting Interest Rates Beyond the Current Fed RegimeCBOT: 10-Year T-Notes Futures ( CBOT:ZN1! )
Since hitting an all-time high (ATH) of 48,431 on November 12th, the Dow Jones Industrial Average lost 1,841 points, or -3.8%, to 46,590 on Monday.
Meanwhile, the Nasdaq Composite has lost over 1,300 points, or -5.5%, from its ATH of 24,020. The S&P 500 is down 250 points, or -3.6%, from 6,920. Both the Nasdaq and the S&P reached their ATH on October 29th.
Cryptocurrencies have been harder hit than stocks. Today, Bitcoin prices dropped below $90,000, a whopping 29% drawdown since the King of Crypto hit ATH of $126,080. An entire year of gains has been erased.
Two key market forces are driving the US stock market downtrend.
Firstly, Wall Street grew worried about the AI bubble bursting. Earlier this month, “Big Short” investor Michael Burry grabbed headlines after his Scion Investment’s 13F filing showed bearish bets on Nvidia (NVDA) and Palantir (PLTR). Last week, Softbank offloaded all 32.1 million shares of NVDA it held. This is followed by Peter Thiel’s hedge fund, which sold off all 537,742 shares of NVDA on Monday.
On my October 27th commentary, I discussed that heavy exposure in High Tech stocks (64%) made Nasdaq very venerable. The Dow could weather the downturn better with a lower weight (21%). The recent market trend resonates with my theory.
Secondly, the Federal Reserve has turned hawkish on monetary policy. The Fed made the last rate cut on October 29th, without the aid of updated economic data due to US government shutdown. Fed officials have warned that further rate cuts are not a sure thing if new data does not support policy easing.
On October 27th, the odds for a December cut were 98.5%, according to data from the CME FedWatch tool. Today, it went down sharply to just 57%. Not cutting has the same effect as raising expected interest rates, which tends to drive down stock valuation.
www.cmegroup.com
The Future is Less Uncertain than the Present
In my view, the market obsession with what the Fed Chair says day by day is overblown. Anybody remember a quote from Alan Greenspan? While modeling short-term decisions into long-term trends, we risk overlooking the impact from changing of guards at the Fed.
The current Fed Chair’s term will end in May 2026. Between now and then, there are four FOMC rate-setting meetings: December 9-10, 2025, January 27-28, March 17-18 and April 28-29 in 2026. What could possibly happen in four meetings:
• If the Fed is hawkish and refuses to cut rates, the policy Fed Funds rate could stay at the current 375-400 bp range.
• If the Fed turns dovish and cut 25bp every time, Fed Funds could be at 275-300 bp.
In recent meetings, the Fed no longer had consensus in its policy votes. Each decision is like a toss-up. If we only focus on the short term, trading results could be very volatile.
The next Fed Chair will be nominated by President Trump and confirmed by the Senate. We know for a fact that the President favors aggressive rate cuts to support the economy. Only someone who is 100% in agreement with the President could get nominated.
Latest news indicates that five candidates have made it to the final list to be considered for a Fed Chair nomination. They are Michelle Bowman, Christopher Waller, Kevin Warsh, Kevin Hassett and Rick Rieder.
If the Senate confirmation gets delayed, the President could pick a current Fed governor as Acting Chair. Whoever that may be, he or she will have to align with the President in terms of the direction of monetary policy. Gone with the independent central bank.
Even though we have no idea what happens next month, we could still form a good estimate of what the Fed will do in the next 2-1/2 years, starting in June 2026.
In my opinion, the expected policy rate will eventually go down to 1.0-1.5%, or even lower. This is not what the Fed currently says. Instead, I am forming an opinion based on a new Fed regime with a new Chair and multiple Fed governors supporting rate cuts.
With that in mind, we can now discuss trade strategies going beyond the next Fed meeting. We don’t have to wait a long time for everything to move in places. Once a new Fed Chair candidate is announced, the market will start pricing a different interest rate trajectory. Latest news suggests that the President may be meeting with three candidates after the Thanksgiving holiday.
Trading with 10 Year T-Notes Futures
As I mentioned earlier, US stocks have the risk of AI bubble bursting. We could wait a while to see how things play out. My trade idea today is a pure play on interest rates.
We know that Treasury prices are negatively correlated with interest rates. When rates go down, prices will likely go up. Our major chart illustrates this relationship.
CBOT 10-Year Treasury Notes Futures have a face value of $100,000 at maturity. The March 2026 contract (ZNH6) is currently quoting 112'240, equivalent to $112.75. Buying or selling one contract requires an initial margin of $1,875.
The 10Y futures are one of the most liquid futures contracts in the world. According to CME Group data, trade volume on November 17th was 1,779,688 contracts. Open Interest (OI) is 5,748,386 contracts at market close. OI is notional term is $574.8 billion.
In the next three FOMC meeting cycles, the contract prices could go either way depending on how the Fed votes. However, as soon as the President nominate his Fed Chair candidate, Treasury prices would get a big boost as the market will price in the new and lowered expected interest rates.
Hypothetically, if ZNH6 moves up 1% to $113.8775, the $1.1275 price gain would translate into $1,127.5 for a long futures position, given each dollar gain in price quotation equals $1,000 per contract. Using the initial margin of $1,875 as a cost base, the trade would produce a theoretical return of 60.1% (=1127.5/1875).
The long futures position will lose money if the Fed puts rate cuts on hold, and the new Fed Chair candidate is not announced in the next three months.
Happy Trading.
Disclaimers
*Trade ideas cited above are for illustration only, as an integral part of a case study to demonstrate the fundamental concepts in risk management under the market scenarios being discussed. They shall not be construed as investment recommendations or advice. Nor are they used to promote any specific products, or services.
CME Real-time Market Data help identify trading set-ups and express my market views. If you have futures in your trading portfolio, you can check out on CME Group data plans available that suit your trading needs www.tradingview.com

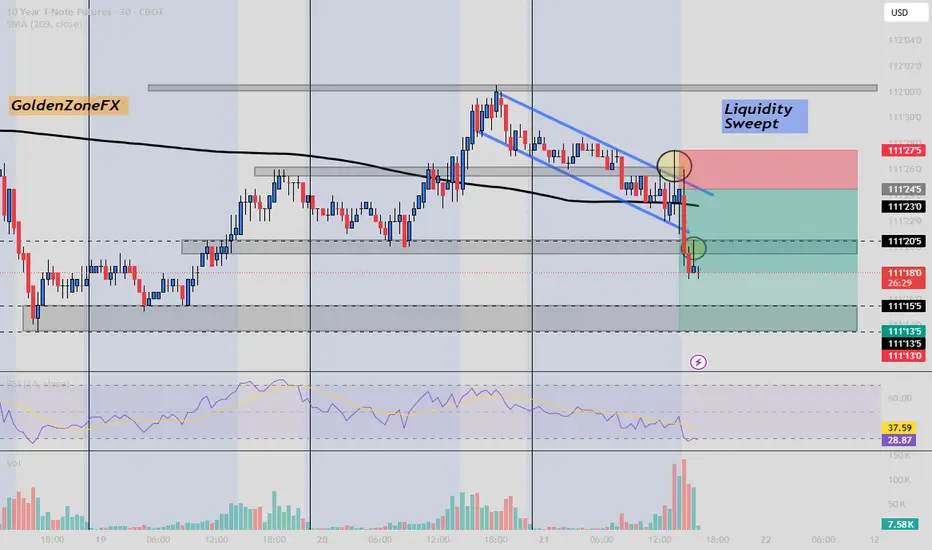
ZN Bearish Move Might Steps In?After the breakout and the liquidity that has been sweept the price performed a small pullback which confirms the short position setup.
Follow @GoldenZoneFX for more content and valuable insights.
When a Quant Tries to Be Tori Trades for a DayI’ve been experimenting with a wide range of strategies from full quant models to pure price action, from EAs to structure-based setups. Recently, I came across Tori Trades’ trend line method, and I was intrigued. It’s clean, visual, and grounded in logic: draw structure, follow the reaction, keep it simple.
So I decided to test it. Not on metals or indices, but on something different: ZN (10-Year T-Note Futures). This is a swing setup based purely on trend lines, horizontal structure, and compression. Let’s walk through it.
Why Trend lines?
The idea behind trend lines is simple: price respects geometry when enough participants see it.
- Connect higher lows or lower highs to define pressure.
- The more touches, the stronger the validity.
- When trend lines converge into an apex, volatility often compresses before an explosive move.
I wanted to see if this visual logic could translate into a clean, tradable swing setup so here we are.
The Setup
ZN has been coiling for months inside a symmetrical triangle formed by multi-touch trend lines:
- A clear horizontal key level at 111’165 sits just overhead.
- This level has acted as resistance for over a year — and now price is pressing right beneath it.
- The chart shows classic compression: higher lows building pressure into a flat ceiling.
My Bias & Trade Plan
I’m going long but only on confirmation:
- Entry: Above 111’165 ideally 111’200–111’300 (momentum or retest)
- Stop: Below the most recent higher low (110’300)
- TP1: 113’150 – major swing structure target
- TP2: 115’000 – macro resistance zone
- Bias: Bullish until structure fails or compression resolves downward
This is structure-only. No indicators, no overlays. Just price, geometry, and behavior.
I’ll be honest, I’ve never been a fan of using trend lines alone as a complete strategy. I usually lean toward data-backed models, confluence stacking, or algo-driven setups.
But the reality is: Tori’s made this work. She’s built a career around this method, and that in itself is impressive. It’s a good reminder that every trader’s edge is personal. What works for one may not work for another but you’ll never know unless you test it under pressure. So this is that test my version, my market, my rules.
If I’m Wrong
If price fails to break and hold above 111’165 — or worse, breaks below 110’300 the long thesis is invalidated.
In that case:
- The compression likely resolves downward
- I’ll sit on the sidelines and reassess or flip short if new structure develops
- This becomes a great lesson in patience and discipline not every coil breaks up
I’m not here to predict. I’m here to react to structure and manage risk. Win or lose, this setup gets published. The edge isn’t just in the trade it’s in the tracking. That’s the Staakd way.

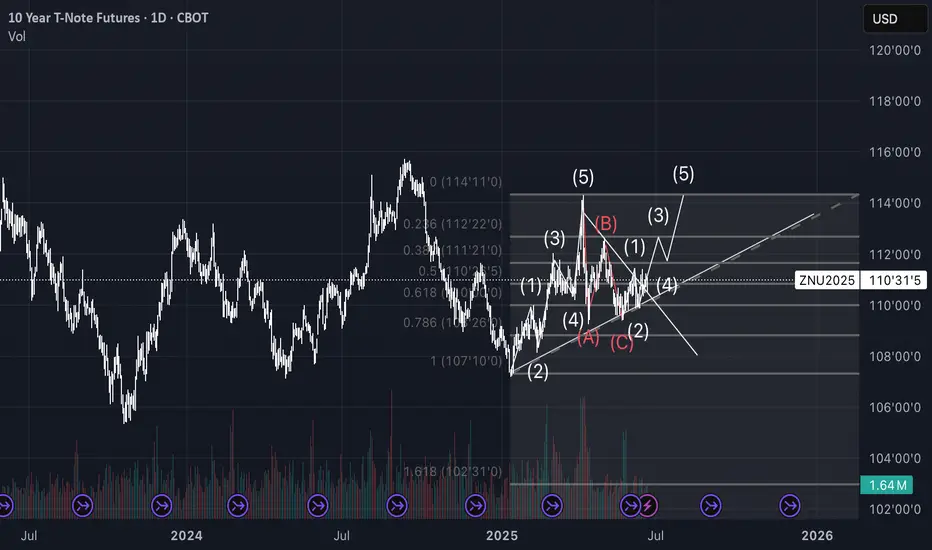
10 - Notes CallTechnical analysis of 10Y T-Note Futures (ZN1!) on 4H timeframe
Elliott Wave count with Fibonacci retracements and completed A-B-C corrective structure. Currently observing potential start of new impulsive wave (1)-(2). Breakout from descending triangle confirmed above dynamic support. Monitoring for further bullish continuation or validation of larger corrective structure.
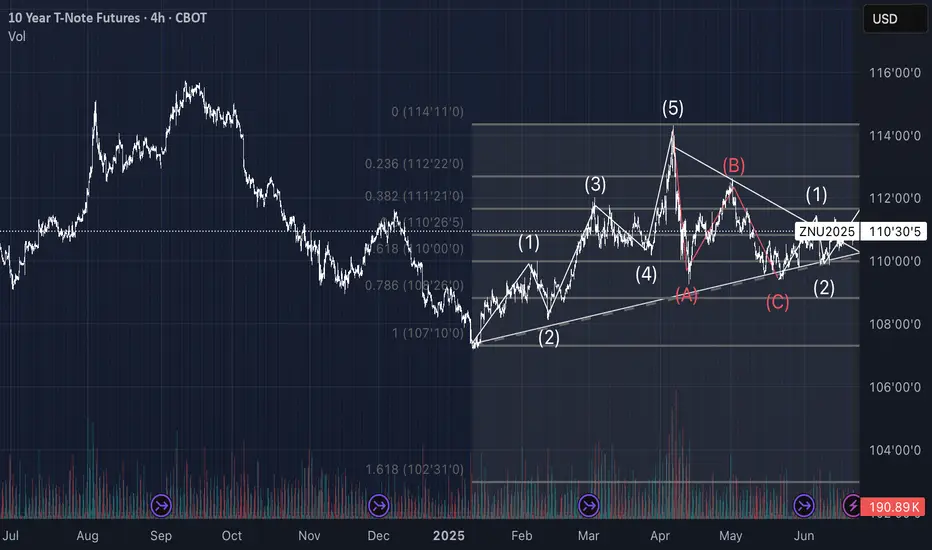
10 - NotesTechnical analysis of 10Y T-Note Futures (ZN1!) on 4H timeframe
Elliott Wave count with Fibonacci retracements and completed A-B-C corrective structure. Currently observing potential start of new impulsive wave (1)-(2). Breakout from descending triangle confirmed above dynamic support. Monitoring for further bullish continuation or validation of larger corrective structure.
How to Trade the Commitment of Traders Report Part 1Hey Traders so today I wanted to start a 3 part series on how to use the Commitment of Traders report to help you in your trading.
Enjoy!
Hope This Helps Your Trading 😃
Clifford

US 10 YR. T-NOTE 4 HR./ CORRECTIVE WAVE 4 IS LIKELY OVER!1). Price is very likely heading towards the fair Market value @ 107. 2). Risk Assets are Weak today on US$ strength! 3). BANKS ARE SELLING! 4). Volume is dropping. 5). Trendline is intersecting with target fib. level 50% TOWARDS 107! 6). Corrective wave 4 is likely dropping to complete wave 5. 7). At the bottom of wave 5 we will look for a long (Buy) position! 8). RISK ASSETS TEND TO FOLLOW THE 10 YR. T-NOTE US BOND!

Steepening Yields & Uncertainty: What says the Bond Markets?
CBOT:ZN1!
US Yield Curve in Image Above
Showing yields on May 27, 2024 vs May 27, 2025 . What happened in a year and how to understand this?
Looking at the image above, the yield curve was inverted on this day last year. Comparing last year’s term structure to today’s, we can see that the yield curve has steepened sharply.
What does this signify? Let’s dive deeper as we share our insights and assessment of what the bond market is doing.
At the March 16, 2022, meeting, the FED finally pivoted away from their "transitory inflation" narrative to a significant supply shocks narrative—supply-demand imbalances and Russia-Ukraine war-related uncertainty. This started a rate hike cycle, with rates peaking at 5.25%–5.50% in the July 26, 2023, meeting.
The Fed Funds rate was reduced by 100 bps, with a cut of 50 bps on September 18, 2024, and two cuts of 25 bps in the November and December 2024 meetings. The FED paused its rate cutting at the start of the year, citing—as we have all heard recently—that the inflation outlook remains tilted to the upside, and given policy uncertainty and trade tariffs, the risk to slowing growth continues to increase. Businesses are holding back spending due to this confusion and continued uncertainty. ** Refer to the image of FED rate path above.
The start of the rate hike cycle also began the FED’s balance sheet reduction program—from a peak of $8.97 trillion to the current balance of $6.69 trillion. **Refer to the image of FED's balance sheet above.
Rates remained elevated at these levels to bring down inflation, which peaked at 9.1% in June 2022. Inflation has currently eased to 2.3% as of April 2025. Refer to the CPI YoY image above.
Ray Dalio, Jamie Dimon, and most recently non-voter Kashkari (FED) highlighted stagflationary risks. FED Chair Powell noted risks to both sides of its dual mandate in its most recent meeting March 19, 2025.
In the March meeting, they also announced a slower pace of reducing Treasury securities, agency debt, and agency mortgage-backed securities. In this announcement, Treasury securities reduction slowed from $25 billion to $5 billion per month, while maintaining agency debt and agency mortgage-backed securities reduction at the same pace.
Many participants and analysts noted this as a dovish pivot. However, given the current market conditions and the supply-demand imbalance emerging within US Treasury and bond markets, we note the rising yields.
The yield curve steepening signifies that investors want better return on their bond holdings. The interesting turn of events here is that US Treasuries and bonds have not provided the safety they usually do in times of uncertainty and policy risk. The dollar has fallen in tandem with bonds, resulting in a devalued dollar and rising yields. Thirty-year yields touched the 5% level, and the DXY index traded at levels last seen in March 2022.
Looking deeper under the hood, we note that a repeat of COVID-pandemic-style stimulus measures may perhaps result in an uncontrollable inflation spiral. The ballooning twin deficits—i.e., trade and budget deficits—with the new “Big Beautiful Bill,” or as some analysts joked, noting this as a foreshadowing of the newest credit rating: “BBB.”
Any black swan event may just be the catalyst needed to tip these dominoes to start falling.
As we previously noted in some of our commentary, debt service payments are now more than defense spending.
The new bill, once passed, is going to add another $2.5 trillion to the deficit. While the deficit is an issue in the US, it is important to note that it is a global issue.
The key question here will be: in due time, will the US bond market and US dollar regain their usual haven status? Or will we continue seeing diversification into Gold, Bitcoin, and global markets?
So, to summarize these mechanics playing out in the US and global markets—in our view—sure, the US administration, one may debate, is not helping by creating this environment of uncertainty in global trade, coupled with a worsening deficit and higher-for-longer rates. The markets currently are perhaps at their most unpredictable stage, with so much going on in the US and across the world.
It is still too early to write off US exceptionalism, and there will be value in rotating back to US markets once the dust on policy uncertainty settles. We suggest that investors stay diversified, watch for any upside surprises to the inflation and do not chase yields blindly as the move may already be overstretched. It is also our view that we are past the extreme policy uncertainty having already noted Trump put when ES Futures fell over 20%.
Although note that near All-time highs or at 6000 level, we are likely to see further headline risks until trade deals are locked in. As always, be nimble, pragmatic and be ready to adjust with evolving market conditions.
Definitions
Plain-language definition: A “basis point” (bps) is 0.01%. So, a 50 bps cut = 0.50% reduction in interest rates.
Plain-language definition: A steep yield curve means long-term interest rates are much higher than short-term ones. This can reflect rising inflation expectations or increased risk.
A “black swan event”—an unpredictable crisis—could set off a chain reaction if confidence in US finances weakens further.
Trade deficit: Importing more than exports
Budget deficit: Government spending far more than it earns

Ten-Year Treasury Notes (ZN) Face Persistent Selling PressureThe decline in Ten-Year Treasury Notes (ZN) from the high on July 4, 2025, is unfolding as a double three Elliott Wave structure, signaling potential bearish momentum. From that peak, wave (W) completed at 109’08, followed by a corrective rally in wave (X) that topped at 112’02. The Notes have since turned lower, approaching a critical level below the wave (W) low of 109’08. A break below this level would confirm a bearish sequence, strengthening the case for further downside.
Within the ongoing wave (Y), the decline from the May 1, 2025, peak currently exhibits a five-wave impulsive structure, favoring continued downward pressure. From the wave (X) high, the initial decline in wave ((i)) ended at 110’27. A corrective rally in wave ((ii)) then followed peaking at 111’22. The Notes then extended lower in wave ((iii)), reaching 109’18, with a subsequent bounce in wave ((iv)) concluding at 110’21.
Currently, wave ((v)) is unfolding, structured as another five-wave sequence in a lesser degree. From the wave ((iv)) high, wave (i) ended at 109’20, and wave (ii) rallied to 110’14. As long as the pivot high at 112’21 remains intact, expect further downside in the Ten-Year Treasury Notes, with potential for increased volatility as the bearish structure develops.

ZN US TREASURY PRICES BASED ON A 110 TO 134 RANGE. TIME FUNCTIONBasic Fib Framework for the ZN US Treasuries with anchores on 110 and 134 to give a range of 24 for the base reference range. 24 h = 1 day , any connection ?

Bonds Could be Forming a Big Low The drop in bonds took them down the 76 retracement level and this is where we're stalled out, at least for now.
Action in this area is consistent with a head and shoulders - and if that pattern is in play then we'd be into the rally in bonds now.
Something that's always worth noticing is when there's a lot of talk of something dramatic happening in something but it doesn't make a new extreme.
During the last drop in bonds there was extreme bear sentiment (It's not even something I'm all that interested in and I was seeing it everywhere) but this drop has so far failed to break the low and, perhaps critically, remains above the 76. Currently in the pending reversal zone we have the formation of a possible reversal pattern.
This is a premise we can invert to the yields also.
If these reversals play out, they predict that these start to change really quickly. We'd be heading out of the late reversal stages and into the early trend.
We'd expect to see bonds sharp up and yields sharp down.
Failure of these levels as reversals would imply a far stronger trend in these, but I do think the odds skew better towards reversals here as per the TA norms.

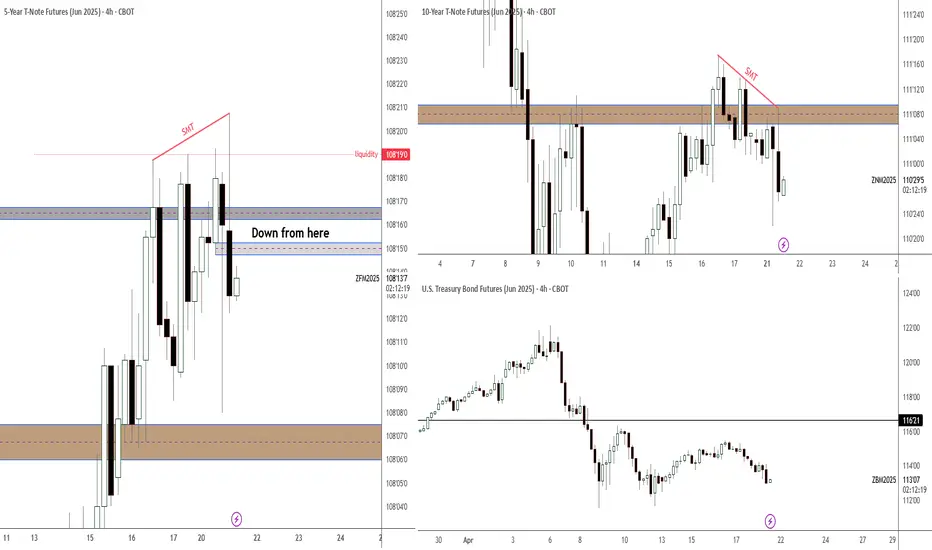
Bonds downBonds should go down according to my analysis. An as it needs more analysis to be able to publish then here you are. It will go down. SL on the SMT high.
Current Mechanics playing out in US and Global MarketsCBOT:ZN1!
COMEX:GC1!
CME:6E1!
CME:6J1!
US Bond Market:
The US bond market—specifically US 10-year Notes—has long been considered a safe haven amid market turmoil. Historically, during periods of uncertainty, investors have flocked to these “flight to safety” assets, resulting in increased demand for US 10-year notes. Mortgage rates also tend to track 10-year note yields, meaning rising yields typically imply rising mortgage rates.
From the chart above, we can observe that ZN futures rose by 6.62% from the January 13 lows to the April 7 highs and what the next possible worst case scenario looks like.
Euro FX Futures:
Euro FX futures rebounded strongly from near-parity levels, climbing to a high of 1.15175—a substantial 12.27% increase versus the USD.
Gold:
Gold futures surged 21.84% from the January 6 lows to the April 11 highs.
What caused investors and market participants to abandon the US dollar and US 10-year notes?
As previously explained, broader macroeconomic forces are at play. Investors are not just pricing in a US recession—they're also reacting to an emerging supply-demand imbalance in the US bond markets. This imbalance is driving safety inflows into gold and other alternative assets, while simultaneously pushing yields higher on the long end of the US yield curve. As a result, the yield curve is steepening.
One noteworthy point: when the 10-year to 2-year yield spread falls below zero, a recession typically follows within 12 to 18 months. After a prolonged period of a negative yield spread during 2024, the yield curve has now steepened sharply.
Additionally, a recent 20% correction in US equities adds another layer of complexity to an already fragile economic outlook. Since the onset of the trade war, both uncertainty and volatility have escalated to extreme levels.
With inflation expectations rising and growth forecasts being revised downward, the most compelling asset class to watch in the coming months is the US dollar—and, specifically, the evolving status of the US 10-year T-Note as a risk haven.
Rising yields may point to further steepening of the yield curve and signal a broader shift away from the US as the global economic leader.
What’s truly at stake is the USD’s reserve currency status. How this unfolds remains anyone’s guess.

Elliott Wave Pattern Suggests Higher EURUSD and Lower US YieldsSome nice retracement on 10-year US notes in the last three weeks looks corrective because of a clear three-wave drop with a triangle in wave (B). This suggests US yields could be trading at resistance, and if we consider the somewhat dovish stance from Powell and the FOMC last week, the market might be positioned for a lower USD. In this scenario, EURUSD could perform well—likely better than some commodity currencies, which remain trapped in sideways ranges due to weaker stock markets recently.
GH

ZN Swing Short Trade idea based on supply and demand, intermarket analysis, COT positioning and cross market valuation. Following a structured approach with clear entry, risk management, and confluence factors.

Reverse Head & Shoulders in /ZN📉 Head & Shoulders Pattern on /ZN | Chart Breakdown... Bonds going higher is signaling to traders that interest rates will come down #chartpatterns #bonds #technicalanalysis

don't get caught chasing yields higher Intraday Update: The divergent RSI in the 10yr ZN's is allowing for a pullback/moderation of overbought intraday conditions, and yields have recovered near term. However, we expect dips to be bought in any dip towards the 110'00 level.

10yr notes inverted H&S patternIntraday Update: 10yr notes has an inverted head and shoulders pattern in play, however is at the 61.8% Fibonacci retracement level of the Dec 8 highs to Jan 14 lows.

Behind the Curtain: Top Economic Influencers on ZN Futures1. Introduction
The 10-Year Treasury Note Futures (ZN), traded on the CME, are a cornerstone of the fixed-income market. As a vital benchmark for interest rate trends and macroeconomic sentiment, ZN Futures attract institutional and retail traders alike. Their liquidity, versatility, and sensitivity to economic shifts make them a go-to instrument for both speculation and hedging.
In this article, we delve into the economic forces shaping ZN Futures’ performance across daily, weekly, and monthly timeframes. By leveraging machine learning, specifically a Random Forest Regressor, we identify the most impactful indicators influencing Treasury futures returns. These insights can help traders fine-tune their strategies and navigate the complexities of this market.
2. Product Specifications
Contract Size:
The standard ZN Futures contract represents $100,000 face value of 10-Year Treasury Notes.
Tick Size:
Each tick corresponds to 1/64 of 1% of par value. This equals $15.625 per tick, ensuring precise pricing and manageable risk for traders.
Margins:
Approximately $2,000 per contract (changes through time).
Micro Contract Availability:
While the standard contract suits institutional traders, the micro-sized Yield Futures provide a smaller-scale option for retail participants. These contracts offer reduced tick values and margin requirements, enabling broader market participation.
3. Daily Economic Drivers
Machine learning models reveal that daily fluctuations in ZN Futures are significantly influenced by the following indicators:
Building Permits: A leading indicator of housing market activity, an increase in permits signals economic confidence and growth. This optimism often puts upward pressure on yields, while a decline may reflect economic caution, boosting demand for Treasuries.
U.S. Trade Balance: This metric measures the difference between exports and imports. A narrowing trade deficit typically signals improved economic health, leading to higher yields. Conversely, a widening deficit can weaken economic sentiment, increasing Treasury demand as a safe-haven asset.
China GDP Growth Rate: As a global economic powerhouse, China’s GDP growth influences global trade and financial flows. Strong growth suggests robust international demand, pressuring Treasury prices downward as yields rise. Slower growth has the opposite effect, enhancing Treasury appeal.
4. Weekly Economic Drivers
When analyzing weekly timeframes, the following indicators emerge as significant drivers of ZN Futures:
Velocity of Money (M2): This indicator reflects the speed at which money circulates in the economy. High velocity signals robust economic activity, often putting upward pressure on yields. Slowing velocity, on the other hand, may indicate stagnation, increasing demand for Treasury securities.
Consumer Sentiment Index: This metric gauges the confidence level of consumers regarding the economy. Rising sentiment suggests stronger consumer spending and economic growth, often pressuring bond prices downward as yields rise. Conversely, a decline signals economic caution, favoring safe-haven assets like ZN Futures.
Nonfarm Productivity: This measures output per hour worked in the nonfarm sector and serves as an indicator of economic efficiency. Rising productivity typically reflects economic strength and may lead to higher yields, while stagnation or declines can shift sentiment toward Treasuries.
5. Monthly Economic Drivers
On a broader monthly scale, the following indicators play a pivotal role in shaping ZN Futures:
Net Exports: This metric captures the difference between a country’s exports and imports. A surplus indicates strong global demand for domestic goods, signaling economic strength and driving yields higher. Persistent deficits, however, may weaken economic sentiment and increase demand for Treasuries as a safe haven.
10-Year Treasury Yield: As a benchmark for longer-term borrowing costs, movements in the 10-Year Treasury Yield reflect investor expectations for economic growth and inflation. Rising yields suggest optimism about future economic conditions, potentially reducing demand for Treasury futures. Declining yields indicate caution, bolstering Treasury appeal.
Durable Goods Orders: This indicator measures new orders placed with manufacturers for goods expected to last three years or more. Rising orders signal business confidence and economic growth, often leading to higher yields. Conversely, a decline in durable goods orders can indicate slowing economic momentum, increasing Treasury demand.
6. Applications for Different Trading Styles
Economic indicators provide distinct insights depending on the trading style and timeframe:
Day Traders: Focusing on daily indicators like Building Permits, U.S. Trade Balance, and China GDP Growth Rate to anticipate short-term market movements. For example, an improvement in China’s GDP Growth Rate may signal stronger global economic conditions, potentially driving yields higher and pressuring ZN Futures lower.
Swing Traders: Weekly indicators such as Velocity of Money (M2), Consumer Sentiment Index, and Nonfarm Productivity could help identify intermediate trends. For instance, rising consumer sentiment can reflect increased spending expectations, potentially prompting bearish positions in ZN Futures.
Position Traders: Monthly metrics like Net Exports, 10-Year Treasury Yield, and Durable Goods Orders may offer a macro perspective for long-term strategies. A sustained increase in durable goods orders, for instance, may indicate economic expansion, influencing traders to potentially adopt bearish sentiment on ZN Futures.
7. Conclusion
The analysis highlights how daily, weekly, and monthly economic indicators collectively influence ZN Futures. From more immediate fluctuations driven by Building Permits and China GDP Growth Rate, to longer-term trends shaped by Durable Goods Orders and the 10-Year Treasury Yield, each timeframe provides actionable insights for traders.
By understanding these indicators and incorporating machine learning models to uncover patterns, traders can refine strategies tailored to specific time horizons. Whether intraday, swing, or long-term, leveraging these insights empowers traders to navigate ZN Futures with greater precision.
Stay tuned for the next installment in the "Behind the Curtain" series, where we examine economic drivers behind another key futures market.
When charting futures, the data provided could be delayed. Traders working with the ticker symbols discussed in this idea may prefer to use CME Group real-time data plan on TradingView: www.tradingview.com - This consideration is particularly important for shorter-term traders, whereas it may be less critical for those focused on longer-term trading strategies.
General Disclaimer:
The trade ideas presented herein are solely for illustrative purposes forming a part of a case study intended to demonstrate key principles in risk management within the context of the specific market scenarios discussed. These ideas are not to be interpreted as investment recommendations or financial advice. They do not endorse or promote any specific trading strategies, financial products, or services. The information provided is based on data believed to be reliable; however, its accuracy or completeness cannot be guaranteed. Trading in financial markets involves risks, including the potential loss of principal. Each individual should conduct their own research and consult with professional financial advisors before making any investment decisions. The author or publisher of this content bears no responsibility for any actions taken based on the information provided or for any resultant financial or other losses.

elliot wave 3-3 pattern ZN
Hello Trader,
The technical analysis using Elliott Wave theory, it seems a potential 3-3 wave structure in progress or nearing completion and possible implications for trading the XXXUSD instrument.
As of now, if the 3-3 wave pattern is indeed unfolding, it suggests that the market is in a corrective phase, which could precede a more significant upward movement.
As you monitor how the 3-3 wave structure plays out, keep an eye on market signals that could indicate a shift towards a bullish phase in XXXUSD. Proper analysis and sound risk management strategies will be key in capturing any potential trading opportunities.
Lets see how it play out
Trader Kuching 24

Currency Wars: Exploring BTC/Fiat Ripple Effects on Key Markets1. Introduction
In today's interconnected financial markets, major fiat currencies like the Euro (6E) and Yen (6J) play a critical role in influencing USD-denominated assets. The relative strength between these currencies often reflects underlying economic trends and risk sentiment, which ripple across key markets like Treasuries (ZN), Gold (GC), and Equities (ES).
However, Bitcoin (BTC), a non-traditional digital asset, introduces an interesting divergence. Unlike fiat currencies, BTC's behavior during periods of significant market stress may reveal a unique relationship to USD movements. This article explores:
The relative strength between the Euro and Yen.
Correlations between fiat currencies, BTC, and USD-denominated markets.
Whether BTC reacts similarly or differently to traditional currencies during market volatility.
By analyzing these dynamics, we aim to identify how shifts in currency strength influence assets like Treasuries while assessing BTC’s independence or alignment with fiat markets.
2. Relative Strength Between 6E and 6J
To evaluate currency dynamics, we compute the relative strength of the Euro (6E) versus the Yen (6J) as a ratio. This ratio helps identify which currency is outperforming, providing insights into broader risk sentiment and market direction.
Another way to think of this ratio would be to use the RY1! Ticker symbol which represents the Euro/Japanese Yen Futures contract.
Correlation Heatmaps
The correlation heatmaps below highlight relationships between:
o Currencies: Euro (6E), Yen (6J), and Bitcoin (BTC).
o USD-Denominated Markets: Treasuries (ZN), S&P 500 (ES), Crude Oil (CL), Gold (GC), and Corn (ZC).
o Key Observations (Daily Timeframe):
The 6J (Yen) shows a positive correlation with Treasuries (ZN), supporting its traditional role as a safe-haven currency.
Bitcoin (BTC) demonstrates mixed relationships across assets, showing signs of divergence compared to fiat currencies during specific conditions.
o Key Observations (Weekly and Monthly Timeframes):
Over longer timeframes, correlations between 6E and markets like Gold (GC) strengthen, while the Yen's (6J) correlation with Treasuries becomes more pronounced.
BTC correlations remain unstable, suggesting Bitcoin behaves differently than traditional fiat currencies, particularly in stress periods.
3. BTC Divergence: Behavior During Significant Moves
To assess BTC's behavior during stress periods, we identify significant moves (beyond a predefined threshold) in the Euro (6E) and Yen (6J). Using scatter plots, we plot BTC returns against these currency moves:
BTC vs 6E (Euro):
BTC returns show occasional alignment with Euro movements but also exhibit non-linear patterns. For instance, during sharp Euro declines, BTC has at times remained resilient, highlighting its decoupling from fiat.
BTC vs 6J (Yen):
BTC's reaction to Yen strength/weakness appears more random, lacking a clear pattern. This further underscores BTC’s independence from traditional fiat dynamics, even as Yen strength typically aligns with safe-haven asset flows.
The scatter plots reveal that while fiat currencies like the Euro and Yen maintain consistent relationships with USD-denominated markets, Bitcoin exhibits periods of divergence, particularly during extreme stress events.
4. Focus on Treasury Futures (ZN)
Treasury Futures (ZN) are among the most responsive assets to currency shifts due to their role as a safe-haven instrument during economic uncertainty. Treasury prices often rise when risk aversion drives investors to seek safer assets, particularly when fiat currencies like the Yen (6J) strengthen.
6E/6J Influence on ZN
From the correlation heatmaps:
The Yen (6J) maintains a positive correlation with ZN prices, particularly during periods of market stress.
The Euro (6E) exhibits a moderate correlation, with fluctuations largely dependent on economic events affecting Eurozone stability.
When relative strength shifts in favor of the Yen (6J) over the Euro (6E), Treasury Futures often attract increased demand, reflecting investor flight-to-safety dynamics.
Forward-Looking Trade Idea
Given the above insights, here’s a hypothetical trade idea focusing on 10-Year Treasury Futures (ZN):
Trade Direction: Long Treasury Futures to capitalize on potential safe-haven flows.
Entry Price: 109’29
Target Price: 111’28
Stop Loss: 109’09
Potential for Reward: 126 ticks = $1,968.75
Potential for Risk: 40 ticks = $625
Reward-to-Risk Ratio: 3.15:1
Tick Value: 1/2 of 1/32 of one point (0.015625) = $15.625
Required margin: $2,000 per contract
This trade setup anticipates ZN’s upward momentum if the Yen continues to outperform the Euro or if broader risk-off sentiment triggers demand for Treasuries.
5. Risk Management Importance
Trading currency-driven assets like Treasury Futures or Bitcoin requires a disciplined approach to risk management due to their volatility and sensitivity to macroeconomic shifts. Key considerations include:
a. Stop-Loss Orders:
Always use stop-loss levels to limit downside exposure, especially when markets react sharply to currency moves or unexpected news.
b. Position Sizing:
Adjust position size to match market volatility.
c. Monitor Relative Strength:
Continuously track the 6E/6J ratio to identify shifts in currency strength that could signal changes in safe-haven flows or BTC behavior.
d. Non-Correlated Strategies:
Incorporate BTC into portfolios as a non-correlated asset, especially when fiat currencies exhibit linear correlations with traditional markets.
By implementing proper risk management techniques, traders can navigate the ripple effects of currency moves on markets like Treasuries and Bitcoin.
6. Conclusion
The relative strength between the Euro (6E) and Yen (6J) provides critical insights into the broader market environment, particularly during periods of stress. As shown:
Treasury Futures (ZN): Highly sensitive to Yen strength due to its safe-haven role.
Bitcoin (BTC): Demonstrates unique divergence from fiat currencies, reinforcing its role as a non-traditional asset during volatility.
By analyzing correlations and BTC’s reaction to currency moves, traders can better anticipate opportunities in USD-denominated markets and identify divergence points that signal market shifts.
When charting futures, the data provided could be delayed. Traders working with the ticker symbols discussed in this idea may prefer to use CME Group real-time data plan on TradingView: www.tradingview.com - This consideration is particularly important for shorter-term traders, whereas it may be less critical for those focused on longer-term trading strategies.
General Disclaimer:
The trade ideas presented herein are solely for illustrative purposes forming a part of a case study intended to demonstrate key principles in risk management within the context of the specific market scenarios discussed. These ideas are not to be interpreted as investment recommendations or financial advice. They do not endorse or promote any specific trading strategies, financial products, or services. The information provided is based on data believed to be reliable; however, its accuracy or completeness cannot be guaranteed. Trading in financial markets involves risks, including the potential loss of principal. Each individual should conduct their own research and consult with professional financial advisors before making any investment decisions. The author or publisher of this content bears no responsibility for any actions taken based on the information provided or for any resultant financial or other losses.
