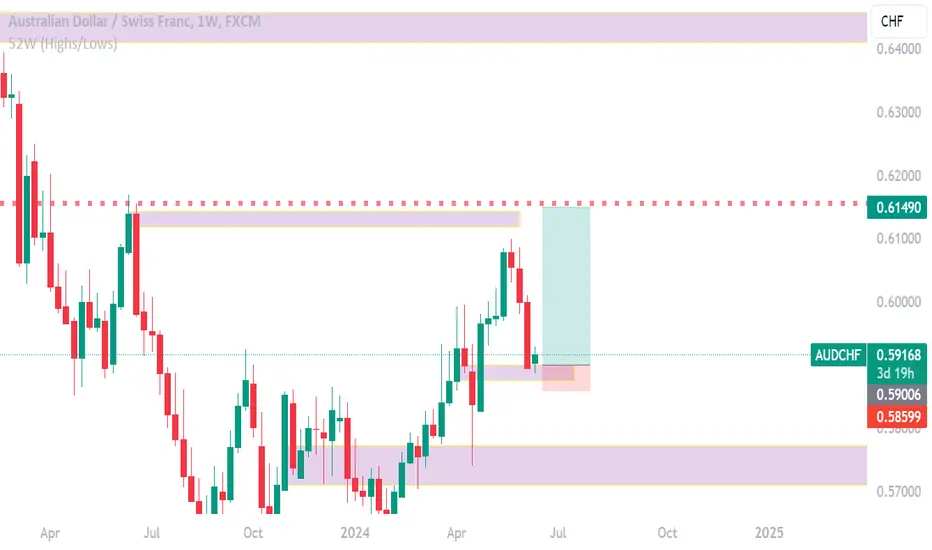
AUDCHF - BULLISH MOVEHello Traders !
The AUDCHF Price failed to break the support level (0.59296 - 0.59514).
The lower high is broken is broken !
So, I expect a bullish move 📈
-------------
TARGET: 0.59980🎯
CHFAUD trade ideas

Long Idea on AUDCHFA divergence is found at 30min chart.
Price is making lower low, while RSI is making higher low.
Overall AUDCHF is on uptrend as price is above EMA 100 and EMA 200.
Support Level is at 0.5890 - 0.5850 range.
Long Idea (Risk 1 : Reward 2.92)
TP: 0.6120
SL: 0.5820

AUDCHF NEXT MOVE POSSIBLE Audchf is bullish we have next best buying opportunity around 0.57300 dont miss this
opportunity note its not a signal after confirmation signal will be available for more updates about audchf movement stay tuned

AUDCHF - Long active !!Hello traders!
‼️ This is my perspective on AUDCHF.
Technical analysis: Here we are in a bullish market structure from 1H timeframe perspective, so I look only for long position. I expect bullish price action continuation after price filled the imbalance rejected from trendline + bullish order block.
Like, comment and subscribe to be in touch with my content!

Short AUDCHF Idea based on Classical chart patterns on a short time frame(4H chart).
abbreviations:
M/W/D/H = Month/Week/Day/Hour
TL: Trendline
DT: Double Top
DTr: Descending Triangle
The chart goes from Monthly(top left)/Weekly(top right)/Daily(bottom left)/4 Hours(bottom right)
1st from the monthly chart you can see the pair in a steady down trend, and maybe one could say that it is sitting at the low ends of the down trend.
zoom into the weekly chart and you see that indeed there was a DTr that took 17W to form indicating a break lower, which never happened. A failure of this pattern led to a move to the target derived from the pattern @0.6055 level. the market now hit the target. And the heat seems to be waning.
in the daily chart, near the 17W DTr failure target the market has now attempted to form patterns indicating topping out of the moves, 8W DT and 4WDT. While the former turned out to be a failed pattern, the former, at least for now, seems like a pattern completion.
all this in mind, the 4H chart now seems to be forming a 1W DB, which could mean that the market is still strong, and the bullish move may continue, or this is a failed attempt to consolidate and the trend turns.
based on the target derived from the 1W DB, the risk return looks more favor for a short AUDCHF, looking for almost 7:1 risk reward trade.
Entry : 0.5938 or above
SL : 0.5953 (-0.25%) / TP: 0.5835(+1.7%)
(as always, not investment advise or prediction)

AUDCHF: Bearish Outlook Explained 🇦🇺🇨🇭
AUDCHF formed a bearish flag pattern on a 4H time frame,
after quite a strong bearish movement.
Breakout of the support of the flag is an important bearish signal.
The pair may keep falling now.
Goals: 0.5899 / 0.5880
❤️Please, support my work with like, thank you!❤️


AUDCHF - Wait For The Next Impulse!Hello TradingView Family / Fellow Traders. This is Richard, also known as theSignalyst.
📈 AUDCHF has been overall bullish, trading within the rising wedge in blue.
Currently, AUDCHF is undergoing a correction phase and it is currently approaching the lower bound of the wedge.
Moreover, it is retesting strong support zone marked in green.
🏹 Thus, the highlighted blue circle is a strong area to look for trend-following buy setups as it is the intersection of the green support zone and lower blue trendline acting as a non-horizontal support.
📚 As per my trading style:
As #AUDCHF approaches the blue circle zone, I will be looking for bullish reversal setups (like a double bottom pattern, trendline break , and so on...)
📚 Always follow your trading plan regarding entry, risk management, and trade management.
Good luck!
All Strategies Are Good; If Managed Properly!
~Rich

AUDCHF DAILY MARKET OUTLOOKPrice is gradually falling to daily support price of 0.58 price level. This price level could be a technical buy start point if bidding price is offered.

AUDCHF - SUPPORT BECOMES RESISTANCE !Hello Traders !
After the bearish double top,
The price broke the support level (0.59296 - 0.59514).
This key level becomes a new resistance level !
So, I expect a bearish move📉
--------------
TARGET: 0.58470🎯

AUDCHF BUY The market is currently testing the current 0.5 Fib structure which is forming a pattern on the daily TF. Based on price action , the market is showing signs of bulls on the 4HR TF.
We could see buyers coming in strong should the current level hold at the 0.5 FIB Level
Disclaimer:
Please be advised that the information presented on TradingView is solely intended for educational and informational purposes only.The analysis provided is based on my own view of the market. Please be reminded that you are solely responsible for the trading decisions on your account.
High-Risk Warning
Trading in foreign exchange on margin entails high risk and is not suitable for all investors. Past performance does not guarantee future results. In this case, the high degree of leverage can act both against you and in your favor.

AUDCHFFUNDAMENTAL ;SIDE WAY
SENTIMENTAL ;50/50
seasonality :from 20 June onward uptrend
TECHNICAL break out of bearish trend line with bullish divergence printed HH and retraced
can be a buy consideration


AUDCHF - CUP & HANDLE FORMATIONAUDCHF is in bullish trend. A cup and handle formation is a testimony for its bullish continuation. Hopefully previous bearish divergence has been diluted.

AUDCHF intraday long ideaAUDCHF is currently in an uptrend and formed a nice descending wedge pattern. For my entry it will be at the fib level/support level or when it breaksout from the pattern whichever comes first. Currently there are no rsi divergences to support a long at this point yet and im expecting price to go lower before the breakout.

AUDCHF giving technical sell direction, 2hrAUDCHF has been in an uptrend since February and has been buying ever since. The market changed direction with a double top showing that the sellers have the momentum.
The market sold to 1.59070 which is a strong support and formed an ascending triangle to break the resistance of our uptrend to form a downtrend. The market then came back to retest the support in 1.5907 giving us a double confirmation that the market is selling.


AUDCHF SWING LONGPlease ignore my previous post. I looked at higher time frame and found a 3 wave correction here. It bounced at rhe end of the correction above higher low. Im expecting a push up to higher higher highs tp at resistance

AUDCHF SELL IDEAGoing to sell AUDCHF targeting 0.59285. Price may go lower than that but that is my target for now.
Many resistant area's at and above where it is at. Lets stay patient...Usually these hit within 24 hours but can take up to a week (very rarely longer than that).
Keep an eye for any additional insight I may post.

AUDCHFThis Weekly FORECAST
Opportunity for AUDCHF. This setup trading idea is for swing. >> TAYOR
Risk Factors:
1. Market conditions, unexpected news, or external events could impact the trade.
2. Always use risk management strategies to protect your capital.
AUDCHF ShortPrice Action Trading
Daily Bias Bearish
H4 Bearish: There was a consolidation formed and breakout happened towards the downside. With fundamentals supporting double currency direction.
In H1 TF, I have set a short trade at the broken trendline with the resistance level targeting the next week low with R:R 1:5.

AUDCHF LONGAUDCHF long setup, 1h and 4h bullish div has printed and the strong 1d vertical support line bounce with a 4h hortizontal support area has s strong impact on buyers. so this will be a possible strong area to buy the audchf...

AUDCHF IS IN BULLISH TREND AUDCHF is in bullish trend it print bullish divergence
seasonality bullish
sentiment bullish
