Breakout signals bullish rise?NZD/CHF has broken out of the resistance level, which is a pullback resistance, and could potentially rise from this level to our take profit.
Entry: 0.4729
Why we like it:
There is a pullback resistance level.
Stop loss: 0.4690
Why we like it:
There is a pullback support level.
Take profit: 0.4794
Why we like it:
There is an overlap resistance that aligns with the 78.6% Fibonacci retracement.
Enjoying your TradingView experience? Review us!
Please be advised that the information presented on TradingView is provided to Vantage (‘Vantage Global Limited’, ‘we’) by a third-party provider (‘Everest Fortune Group’). Please be reminded that you are solely responsible for the trading decisions on your account. There is a very high degree of risk involved in trading. Any information and/or content is intended entirely for research, educational and informational purposes only and does not constitute investment or consultation advice or investment strategy. The information is not tailored to the investment needs of any specific person and therefore does not involve a consideration of any of the investment objectives, financial situation or needs of any viewer that may receive it. Kindly also note that past performance is not a reliable indicator of future results. Actual results may differ materially from those anticipated in forward-looking or past performance statements. We assume no liability as to the accuracy or completeness of any of the information and/or content provided herein and the Company cannot be held responsible for any omission, mistake nor for any loss or damage including without limitation to any loss of profit which may arise from reliance on any information supplied by Everest Fortune Group.
CHFNZD trade ideas


NZDCHF Sell IdeaNZDCHF looks bearish this week. As we head into the second half of the week, a bearish flag pattern is shown on the D timescale.

Sell NZDCHFNZDCHF Sell Idea. A continuation pattern is at display here. At the end of last week, we saw strong bearish movement. Price should continue down, judging from this bearish flag pattern

NZD/CHF SHORT FROM RESISTANCE
Hello, Friends!
NZD/CHF pair is trading in a local uptrend which we know by looking at the previous 1W candle which is green. On the 12H timeframe the pair is going up too. The pair is overbought because the price is close to the upper band of the BB indicator. So we are looking to sell the pair with the upper BB line acting as resistance. The next target is 0.473 area.
Disclosure: I am part of Trade Nation's Influencer program and receive a monthly fee for using their TradingView charts in my analysis.
✅LIKE AND COMMENT MY IDEAS✅

NZD-CAD Will Keep Falling! Sell!
Hello,Traders!
NZD-CAD has formed a
Bearish flag pattern
And the pair is trying
To breakout of the flag
So IF we the breakout
Is confirmed on Monday
We will be expecting
A further bearish move down
Sell!
Comment and subscribe to help us grow!
Check out other forecasts below too!
Disclosure: I am part of Trade Nation's Influencer program and receive a monthly fee for using their TradingView charts in my analysis.

Sell NZDCHFNZDCHF Bearish Idea. NZDCHF looks bearish this Friday afternoon. A bearish flag on the 1hr and 4hr chart helps us confirm this bearish trade.

NZDCHF SHORT Market structure bearish on HTFs 3
Entry at both Weekly and Daily AOi
Weekly Rejection at AOi
previous Weekly Structure Point
Daily Rejection at AOi
Previous Structure point Daily
Around Psych Level 0.47500
H4 Candlestick rejection
Rejection from Previous structure
Levels 3.36
Entry 115%
REMEMBER : Trading is a Game Of Probability
: Manage Your Risk
: Be Patient
: Every Moment Is Unique
: Rinse, Wash, Repeat!
: Christ is King.

NZD_CHF BEARISH FLAG|SHORT|
✅NZD_CHF is trading in a
Downtrend and the pair formed
A bearish flag pattern so IF we
See a bearish breakout then we
Will be expecting a further
Bearish continuation and
A move down
SHORT🔥
✅Like and subscribe to never miss a new idea!✅

NZD/CHF – Ready to Rebound?NZD/CHF – Ready to Rebound?
NZD/CHF recently touched 0.4670, which may have been the bottom—unless the SNB surprises the market again.
The pair is showing signs of a bullish reversal. The structure looks supportive of an upward move, and price is currently in extremely oversold territory.
If conditions hold, a short-term rise toward 0.4700–0.4720 seems likely. Despite some market instability, the setup looks favorable for further gains.
With volume still low, potential target zones could be around 0.4750 and 0.4790.
You may find more details in the chart!
Thank you and Good Luck!
❤️PS: Please support with a like or comment if you find this analysis useful for your trading day❤️

Bullish reversal in play?NZD/CHF is reacting off the pivot, which is a pullback support and could potentially rise to the 1st resistance.
Pivot: 0.47161
1st Support: 0.46757
1st Resistance: 0.47972
Risk Warning:
Trading Forex and CFDs carries a high level of risk to your capital and you should only trade with money you can afford to lose. Trading Forex and CFDs may not be suitable for all investors, so please ensure that you fully understand the risks involved and seek independent advice if necessary.
Disclaimer:
The above opinions given constitute general market commentary, and do not constitute the opinion or advice of IC Markets or any form of personal or investment advice.
Any opinions, news, research, analyses, prices, other information, or links to third-party sites contained on this website are provided on an "as-is" basis, are intended only to be informative, is not an advice nor a recommendation, nor research, or a record of our trading prices, or an offer of, or solicitation for a transaction in any financial instrument and thus should not be treated as such. The information provided does not involve any specific investment objectives, financial situation and needs of any specific person who may receive it. Please be aware, that past performance is not a reliable indicator of future performance and/or results. Past Performance or Forward-looking scenarios based upon the reasonable beliefs of the third-party provider are not a guarantee of future performance. Actual results may differ materially from those anticipated in forward-looking or past performance statements. IC Markets makes no representation or warranty and assumes no liability as to the accuracy or completeness of the information provided, nor any loss arising from any investment based on a recommendation, forecast or any information supplied by any third-party.

NZD/CHF SELLERS WILL DOMINATE THE MARKET|SHORT
Hello, Friends!
NZD/CHF pair is trading in a local uptrend which we know by looking at the previous 1W candle which is green. On the 9H timeframe the pair is going up too. The pair is overbought because the price is close to the upper band of the BB indicator. So we are looking to sell the pair with the upper BB line acting as resistance. The next target is 0.468 area.
Disclosure: I am part of Trade Nation's Influencer program and receive a monthly fee for using their TradingView charts in my analysis.
✅LIKE AND COMMENT MY IDEAS✅

NZDCHF BullishNZDCHF has broken resistance zone and is looking bullish as it comes down to retest and test the demand zone.
We are looking to take it long to the supply zone


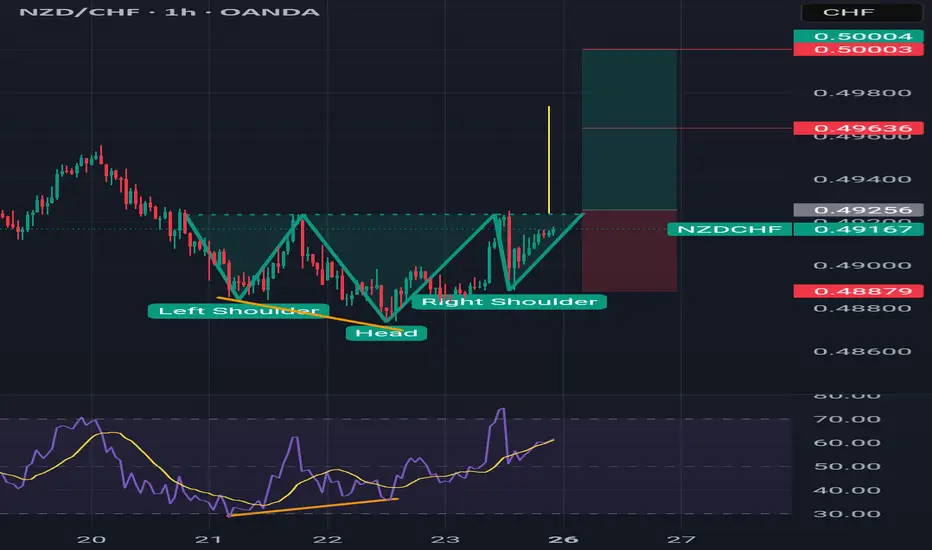
NZDCHF LONG 1HInverse Head and shoulder
Bullish Divergence
Found inverse Head and shoulder at bottomwith bullish divergence
Entry on neckline break
Bearish reversal off pullback resistance?NZD/CHF is rising towards the pivot, which is a pullback resistance that lines up with the 61.8% Fibonacci retracement and could reverse to the 1st support.
Pivot: 0.47599
1st Support: 0.46757
1st Resistance: 0.48168
Risk Warning:
Trading Forex and CFDs carries a high level of risk to your capital and you should only trade with money you can afford to lose. Trading Forex and CFDs may not be suitable for all investors, so please ensure that you fully understand the risks involved and seek independent advice if necessary.
Disclaimer:
The above opinions given constitute general market commentary, and do not constitute the opinion or advice of IC Markets or any form of personal or investment advice.
Any opinions, news, research, analyses, prices, other information, or links to third-party sites contained on this website are provided on an "as-is" basis, are intended only to be informative, is not an advice nor a recommendation, nor research, or a record of our trading prices, or an offer of, or solicitation for a transaction in any financial instrument and thus should not be treated as such. The information provided does not involve any specific investment objectives, financial situation and needs of any specific person who may receive it. Please be aware, that past performance is not a reliable indicator of future performance and/or results. Past Performance or Forward-looking scenarios based upon the reasonable beliefs of the third-party provider are not a guarantee of future performance. Actual results may differ materially from those anticipated in forward-looking or past performance statements. IC Markets makes no representation or warranty and assumes no liability as to the accuracy or completeness of the information provided, nor any loss arising from any investment based on a recommendation, forecast or any information supplied by any third-party.

NZDCHF SHORT!Market structure beariish on HTFs 3
Entry at both Weekly and Daily AOi
Weekly Rejection at AOi
Previous Weekly Structure Point
Daily Rejection at AOi
Previous Daily Structure Point
Around Psychological Level 0.47500
H4 EMA retest
H4 Candlestick rejection
Rejection from Previous structure
Levels 2.94
Entry 120%
REMEMBER : Trading is a Game Of Probability
: Manage Your Risk
: Be Patient
: Every Moment Is Unique
: Rinse, Wash, Repeat!
: Christ is King.

NZDCHF Trading Opportunity! BUY!
My dear followers,
I analysed this chart on NZDCHF and concluded the following:
The market is trading on 0.4695 pivot level.
Bias - Bullish
Technical Indicators: Both Super Trend & Pivot HL indicate a highly probable Bullish continuation.
Target - 0.4703
Safe Stop Loss - 0.4690
About Used Indicators:
A super-trend indicator is plotted on either above or below the closing price to signal a buy or sell. The indicator changes color, based on whether or not you should be buying. If the super-trend indicator moves below the closing price, the indicator turns green, and it signals an entry point or points to buy.
Disclosure: I am part of Trade Nation's Influencer program and receive a monthly fee for using their TradingView charts in my analysis.
———————————
WISH YOU ALL LUCK

NZDCHF can come to test the lowNZDCHF is in down trend it can bounce back from daily support after sweeping the liquidity, we can plan sell from CMP to Support Zone.

NZDCHF (SWING) - BEARISH TRADE IDEAHi there,
This pair has been bearish for a while and I expect it to continue.
Although I would like to see price trade into my zone of interest - I doubt it will happen before price gets to my target price as NZD has been very weak lately.
While other pairs like AUDCHF, CADCHF might give this retracement, NZDCHF might not.
That said, I'd be sharing my CADCHF analysis soon.
Follow if you'd like to see what I think of the markets.
Cheers,
Jabari

NZDCHF 25.08.2025~+ Dovish RBNZ (recent decision)
~- NZ Retail Sales Beat
* CHF stayed put while JPY declined on CPI and USD on Powell

NZDCHF: Downtrend MomentumSimilar to NZDCAD, there's a very similar signal on NZDCHF.
Daily Timeframe:
Unlike with NZDCAD, price broke through support very cleanly. It is currently holding below with no indication of a fakeout.
Likewise, EMA20 remains firmly below EMA60, which is the other indication that this is a downtrend.
Hourly Timeframe:
I use an ascending intraday trendline to indicate when the counter-trend movement is coming to an end. As price breaks below the intraday trendline, that's a good indication of confluence in the overall trend direction.
The EMA crossover is not great, which is a little bit of a concern to me. Will need to reduce risk and potential scale into a position depending on how this trade goes.

NZD/CHF Short Trade Plan: Sellers Waiting at 0.4760NZD/CHF forms a Volume Accumulation Setup on the 30-minute chart. Heavy volumes before strong trend activity highlight the key zone. The short level is at 0.4760, aligning with the start of a bearish Fair Value Gap. On a pullback, sellers should defend this area and push price lower.
