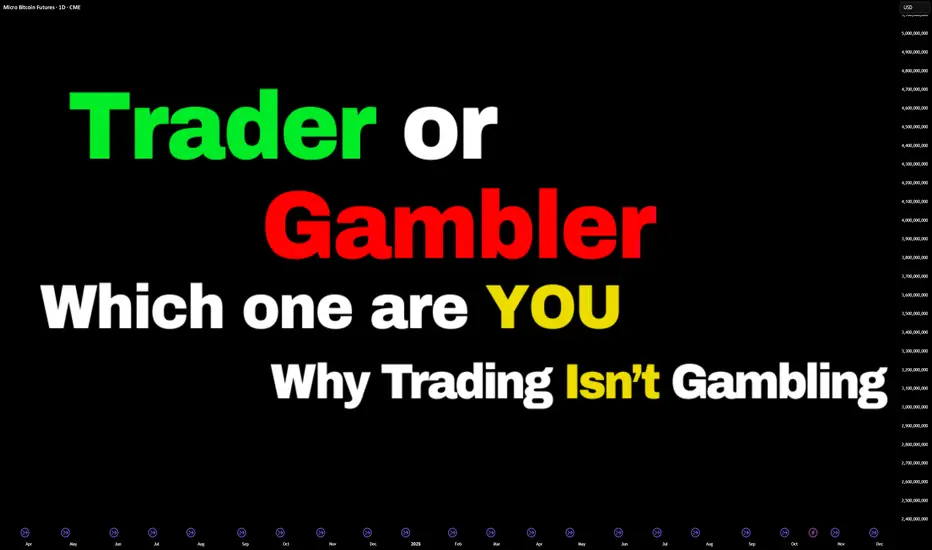
Trader vs Gambler: Why Trading Isn’t GamblingThe Trader vs The Gambler: Why Trading Isn’t Gambling
“Trading is gambling.”
You’ve probably heard it before — from friends, family, or strangers who’ve seen a few flashy headlines, red charts, and crypto hype videos and decided: “It’s all luck.”
To most outsiders, the markets look like chaos
Related futures
Bitcoin Bulls Eye Bounce, Though Bears Could Be Lurking AboveUsing correlations with Wall Street indices, I outline why I think Bitcoin could be in for a bounce - though its rally could be limited before new lows are seen.
Matt Simpson, Market Analyst at City Index and Forex.com

Leverage is a Double-edged SwordCME: Micro Bitcoin Futures ( CME:MBT1! )
On October 6th, Bitcoin spot price hit a new all-time-high record at $126,198.07. The King of Crypto seemed unstoppable. Just four days later, President Trump escalated trade tension with China by threatening 100% additional tariff. This sparked a broad mark

Bitcoin Futures ChannelBitcoin Futures Chart
- We have been respecting this channel all bull run and have once again bounced of thes support lines
- I think we have one more run up to the next upper line, or the one after that before the bull run tops
- The bull run will be over when we break the lowest trendline

Chart Pattern Analysis Of BTC.
K6 and K7 verified a fake up candle of K5,
The market here turned to be more neutral.
If K8 keep expanding down to close below the neckline and the uptrend line,
The three years bull market will be terminated here.
If not,
The market will consolidate around 108K area for more weeks.
Considered K

BTC FUTURES. CRYPTO PRIDE GOES 'COALESCE' INTO SOMETHING BIGGER BTC faces negative fundamental and technical perspectives due to escalating US-China tensions, which have sharply dampened investor sentiment and triggered risk-off behavior across global markets.
Fundamentally, renewed hostilities between the world's two largest economies - including tariff threat

Bitcoin Testing the $115K Level: What Traders Need to KnowBitcoin has been forming a complex trading range. Over the past three months, selling has improved. However, some short-term demand has appeared. The test of the $115K level will be key in revealing the quality of this latest buying.
After the deterioration by selling, there has been some preferred

Bitcoin BTC Bias - enroute to 115kBitcoin may be in route to 115k this week? This is just the Bias now that price is between 110K and 115k? We are looking for healthy pullbacks on the way. Will BTC use 110k as support for the ascent?

Dont get trapped chasing the Opening gap Bitcoin Hello and Welcome
Here I present to you a quick theory on the Bitcoin CME open in the event we gap down and open in the 112K range.
This idea is just something to consider in the week ahead, with many traders destroyed as a result of Fridays crash and emotions running high going into the week

A simple Introduction to Footprint charts
Welcome to this educational video on footprint charts .
I decided to do this introduction because I feel it would benefit so many traders who are unfamiliar with this chart type and once understood it can serve as a very powerful additional confluence in your day to day trading .
I hope I have

See all ideas
Summarizing what the indicators are suggesting.
Neutral
SellBuy
Strong sellStrong buy
Strong sellSellNeutralBuyStrong buy
Neutral
SellBuy
Strong sellStrong buy
Strong sellSellNeutralBuyStrong buy
Neutral
SellBuy
Strong sellStrong buy
Strong sellSellNeutralBuyStrong buy
A representation of what an asset is worth today and what the market thinks it will be worth in the future.
Frequently Asked Questions
The current price of Micro Bitcoin Futures (Feb 2026) is 114,665 USD — it has risen 0.92% in the past 24 hours. Watch Micro Bitcoin Futures (Feb 2026) price in more detail on the chart.
Track more important stats on the Micro Bitcoin Futures (Feb 2026) chart.
The nearest expiration date for Micro Bitcoin Futures (Feb 2026) is Feb 27, 2026.
Traders prefer to sell futures contracts when they've already made money on the investment, but still have plenty of time left before the expiration date. Thus, many consider it a good option to sell Micro Bitcoin Futures (Feb 2026) before Feb 27, 2026.
Buying or selling futures contracts depends on many factors: season, underlying commodity, your own trading strategy. So mostly it's up to you, but if you look for some certain calculations to take into account, you can study technical analysis for Micro Bitcoin Futures (Feb 2026). Today its technical rating is sell, but remember that market conditions change all the time, so it's always crucial to do your own research. See more of Micro Bitcoin Futures (Feb 2026) technicals for a more comprehensive analysis.