Why Every Trend Begins and Ends With LiquidityEvery trend in crypto begins and ends with liquidity. Before a trend can move with force, the market must collect the stop orders that provide the fuel for expansion. These orders sit above equal highs, below equal lows, inside inefficiencies, and around obvious retail breakout levels. Price does not trend because sentiment magically aligns.
It trends because the market clears liquidity at one side of the structure and then expands toward the next pool. The earliest phase of any trend usually starts with a sweep: price reaches beyond a key high or low, triggers stops, absorbs the resting orders, and immediately snaps back. This wick is the first sign that the breakout attempt failed and that larger participants have used the liquidity to take positions.
Once liquidity is taken, the market shifts into structural progression. Higher highs and higher lows form not because traders collectively decide to buy, but because the market now has trapped sellers below the sweep, providing momentum as price moves toward the next logical liquidity target.
Structure becomes the visible footprint of this process. Impulse legs show aggression after liquidity collection, and pullbacks tend to remain orderly because the directional objective has not yet been completed.
Every trend is essentially a journey from one liquidity pool to the next, with structure simply describing how that journey unfolds.
The end of a trend is equally tied to liquidity. A trend rarely dies from weakening momentum alone. Instead, it typically completes when price reaches a major pool of opposing liquidity, often equal highs in an uptrend or equal lows in a downtrend.
The final move into that level is usually fast and dramatic, designed to trigger breakout traders while simultaneously running the stops of those holding late in the trend. Once the liquidity is collected, the market loses incentive to continue and snaps back inside the level, exposing the sweep as a terminal event rather than a continuation. This reversal wick marks the end of one trend and the beginning of the liquidity cycle in the opposite direction.
From there, the process repeats. Liquidity is taken. Structure shifts. Displacement confirms intention. A retest provides the entry. And the new trend begins by targeting the next liquidity pool in line.
When traders understand this cycle, trends become far easier to read. Direction is no longer based on hope, indicators, or isolated candles. It is built on recognising how liquidity motivates movement and how structure validates that movement.
Liquidity shows where the market wants to travel, structure shows how it gets there, and together they form a practical framework for identifying when trends are forming, when they are maturing, and when they are preparing to reverse.
Market insights

Swing Failure Pattern (SFP): When Price ReversesThe swing failure pattern is a liquidity event, not a candle pattern. It marks the moment when the market reaches for obvious stops, absorbs them, and reveals true intent.
An SFP forms when price trades beyond a well-defined swing high or low and then fails to hold acceptance outside that level. The extension triggers breakout entries and stop losses. The immediate rejection back inside the range confirms that the move was used to collect liquidity rather than to continue.
What the structure tells you
The key information is not the wick itself, but the context around it. The prior high or low must be obvious and widely watched. Equal highs, range extremes, or clean swing points carry the most liquidity. When price briefly breaks that level and closes back inside, the market signals that opposing orders have been filled.
This failure traps late participants. Breakout traders are positioned in the wrong direction, while stop losses from earlier positions have already been taken. That imbalance becomes fuel for the next move.
Why SFPs matter
SFPs often appear at major range boundaries or after extended directional moves. In ranges, they define the edges where reversals are most likely. In trends, they frequently mark local distribution or accumulation before a deeper retracement or full reversal.
The move after the SFP is usually cleaner than the move into it. Once liquidity is taken, price no longer needs to revisit the level. Structure shifts, momentum changes, and expansion follows away from the failed breakout.
How to use SFPs correctly
An SFP is not a signal by itself. It requires confirmation through acceptance back inside the range and alignment with higher-timeframe context. When combined with structure, it provides precise locations where risk can be defined tightly and intent is clear.
The market does not reverse because price touched a level. It reverses because liquidity was collected and the objective at that level was completed. The swing failure pattern is the footprint of that process.

17/12/2025 $BTC - $DXY -$SPX - $NDX - $GOLD forecastGold and Bitcoin should be the sole indexes witnessing a correction tomorrow. overall bullish energy will keep accompaining Bitcoin until the next week, but for what concerns tomorrow the trend should be downwards oriented

BTC CME: Short Scenario Progressing, but Macro Context MattersBTC CME continues to follow the short scenario as planned and is approaching the first downside target at 84,000.
I expect further gradual downside continuation with a potential update of local lows.
However, today’s macro data must be taken into account.
US inflation came in significantly lower than expected, triggering a strong bullish reaction in the equity markets.
If Bitcoin also responds with upside momentum, the short scenario will be invalidated, and a potential flip to long would be considered on a breakout and firm consolidation above the weekly high.
Market remains technically bearish, but macro factors add volatility.
BTC1!Risked ~800 down for 4,000 - 8,000 up from high 85s yesterday, even from this current juncture it's an appealing R/R if risking 2,800 down (invalidated on new lows) for 7,000 (Yearly Open test) up. I believe 2025 closes very close to its open as that's probably the most ironic outcome despite the rollercoaster ride 2025 has been.

Tokenization Push by US Government Will Unleash a Demand ShockCME: Micro Bitcoin Futures ( CME:MBT1! ) and Micro Ether Futures ( CME:MET1! )
On December 8th, U.S. Commodity Futures Trading Commission (CFTC) announced the launch of a digital assets pilot program for certain digital assets, including BTC, ETH, and USDC, to be used as collateral in derivatives markets.
This announcement marks a significant milestone in expanding the adoption of digital assets in regulated markets with appropriate guardrails. In my opinion, the flood gate has just opened. It will let in organic growth of crypto demand in hundreds of billions of dollars.
Collateral Assets in Derivatives Markets
Unlike the fully-funded cash market trades, futures and options contracts are transacted using performance margins. This important feature allows investors to get large exposure (in contract notional value terms) with a smaller upfront deposit (initial margin). The built-in leverage improves capital efficiency and could help enhance returns.
Futures and options positions are marked-to-market on a daily basis. If a contract is not settled by the end of the day, the traders on both the long side and the short side of a trade are required to keep their margin account balance above the threshold set by the clearinghouse (maintenance margin). The Exchange’s clearinghouse manages client collateral assets. If the open interest is huge, this could amount to billions of dollars.
Take CME Group, the largest Derivatives Exchange holding company, as an example:
• Total combined Open Interest is 234,389,524 contracts on December 12, 2025, according the CME Group website.
• CME Group had performance bond assets at $149.0 billion on September 30, 2025, according to data released by CME Group in its 10Q report, October 24, 2025.
CME Clearing takes the following types of assets as acceptable collateral:
• US dollar
• Foreign currencies: subject to haircuts and caps
• US treasuries: bills, notes, and bonds, as well as TIPS
• Gold: COMEX gold warrants and London gold bullion
• Agency: selected U.S. government agencies and mortgage-backed securities
• Stocks and ETFs: blue-chip stocks, subject to a 25-30% haircut
• Corporate bonds: high rated bonds, subject to haircuts and caps
CME Clearing does not currently accept cryptocurrencies as collateral. With the CFTC-backed pilot program, BTC, ETH and USDC could likely be added to the menu.
In my November 3rd market commentary, “Bitcoin: from Pet Rock to Loan Collateral”, I discussed the significance of JPMorgan accepting crypto ETFs as stock lending collateral.
JPMorgan, being the largest US bank, could influence other banks with its action. The CFTC pilot program takes the matter to the next level. US regulators are issuing policies pushing for crypto adoption.
Trump Administration Pro-Crypto Policies
Since returning to the White House in January, the Trump Administration have brought about a series of pro-Crypto policies. These include President’s executive orders, laws passed by Congress, as well as new rules enacted by various federal agencies.
• Executive Orders: Trump signed executive orders to establish a presidential working group to propose a new federal regulatory framework and created the Strategic Bitcoin Reserve and a U.S. Digital Asset Stockpile.
• The GENIUS Act: This act, signed into law in July 2025, provides a regulatory framework for payment stablecoins, requiring 1:1 reserves and compliance with AML rules, and clarifies they are not securities or commodities.
• Securities and Exchange Commission (SEC): The SEC issued SAB 122 to facilitate crypto custody services by banks. It established a "Crypto Task Force" and issued statements clarifying that certain stablecoins are not securities.
• Department of Justice (DOJ): The DOJ now prioritizes cases involving clear financial harm and disbanded the National Cryptocurrency Enforcement Unit.
• Banking Regulators: FDIC and Federal Reserve rolled back previous guidance, allowing banks to engage in crypto-asset services without prior non-objection letters.
• IRS: The IRS is focusing on accurate record-keeping and disclosure for the 2025 tax year, while eliminating certain DeFi reporting rules.
• Department of Labor (DOL): In August 2025, DOL issued guidance to clear the way for 401K plan sponsors to offer digital assets as an investment option.
• Future Legislation: Bills under consideration include the CLARITY Act to define most digital assets as commodities and the Anti-CBDC Surveillance State Act to codify the ban on a U.S. CBDC.
Industry adoption may start slowly, but once core financial assets are tokenized, we will see huge crypto demand, specifically for Bitcoin and Ethereum.
• Strategic Bitcoin Reserve could grow to a trillion-dollar sovereignty fund.
• The $9 trillion U.S. 401K market: Even if only 5% of the retirement asset is held in cryptos, the new demand will be half a trillion dollars.
• If 10% of CME collateral assets gets tokenized, it will be $15 billion in BTC, ETH and USDC. Once other Exchanges and the OTC derivatives market follow suit, new crypto demand could grow to $100 billion.
Riding the ride with Micro Bitcoin and ETH Futures
Bitcoin has declined 30% in the last two months, while ETH suffered a 40% loss. Such pullbacks are common throughout the history of cryptocurrencies. If we take the long view, the crypto “gold” and “silver” could rise again on the back of new organic demand.
Traders who share the bullish view on Bitcoins and Ethereum could explore CME Micro Bitcoin Futures ( PSE:MBT ) and Micro ETH Futures ( NYSE:MET ).
The MBT contract has a notional value of 0.10 bitcoin, as defined by the CME CF Bitcoin Reference Rate (BRR). On December 12th, the January 2026 contract (MBTF6) is settled at $90,960. Each contract has a notional value of $9,096. To buy or sell one contract, CME Group requires an initial margin of $2,184. By design, this futures contract has a built-in leverage of 4.2-to-1. When bitcoin goes up, futures positions could enhance the return by four times compared to spot bitcoin positions.
MET has a notional value of 0.10 ETH. On December 12th, the January contract (METF6) is settled at $3,104, putting the contract value at $310.4. The initial margin is $100, implying a built-in leverage of 3.1-to-1. When Ethereum goes up, futures positions could enhance the return by three times compared to spot ETH positions.
What happens if Bitcoin or Ethereum drops? For price protection, traders could enter a buy order with a stoploss. For example:
• A long MBTF6 order at 91,000 with a stoploss of 85,000 limits the maximum loss to $600 (= (91000-85000) x 0.1).
• A long METF6 order at 3,100 with a stoploss of 2,800 limits the maximum loss to $30 (= (3100-2800) x 0.1).
In addition to margin (leverage) and stoploss (loss protection), both Micro Bitcoin and Micro ETH have a daily price limit at 10%. This feature is particularly helpful when the market is panicky. Price Limit or Circuit slows down the irrational price movements until cooler heads prevail.
Happy Trading.
Disclaimers
*Trade ideas cited above are for illustration only, as an integral part of a case study to demonstrate the fundamental concepts in risk management under the market scenarios being discussed. They shall not be construed as investment recommendations or advice. Nor are they used to promote any specific products, or services.
CME Real-time Market Data help identify trading set-ups and express my market views. If you have futures in your trading portfolio, you can check out on CME Group data plans available that suit your trading needs www.tradingview.com

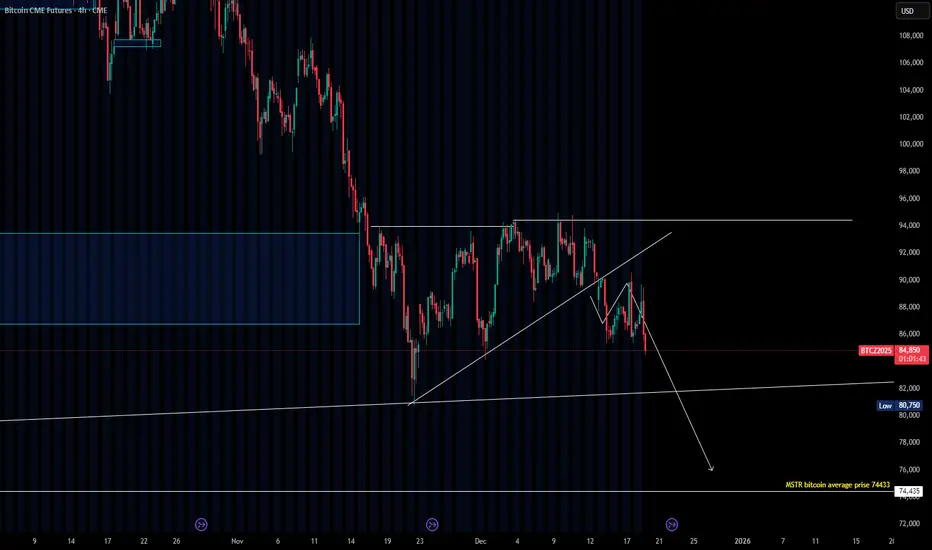
Bitcoin is waving a flag, but it's not the kind to saluteThe daily chart is indicating a textbook bear flag pattern breaking down.
A bear flag is a bearish continuation setup characterized by:
- Sharp sell-off (flagpole)
- Small upward/sideways consolidation (flag)
- Directional breakdown lower
This pattern often signals short-term downside momentum and can also appear intraday.
**How to Trade a Bear Flag:**
- **Entry:** Short when the price breaks below the lower trendline of the flag. Conservative traders may wait for a candle close below support.
- **Stop-Loss Placement:** Place above the interim high of the flag consolidation, specifically above 94,950 to protect against false breakouts.
- **Profit Target:** Measure the flagpole length and project it downward from the breakout point.
Bear flags are powerful when traded with discipline, emphasizing clear entry, tight risk management, and realistic targets. This is not investment advice.
Disclaimer:
The information posted on Trading View is for informative purposes and is not intended to constitute advice in any form, including but not limited to investment, accounting, tax, legal or regulatory advice. The information therefore has no regard to the specific investment objectives, financial situation or particular needs of any specific recipient. Opinions expressed are our current opinions as of the date appearing on Trading View only. All illustrations, forecasts or hypothetical data are for illustrative purposes only. The Society of Technical Analysts Ltd does not make representation that the information provided is appropriate for use in all jurisdictions or by all Investors or other potential Investors. Parties are therefore responsible for compliance with applicable local laws and regulations. The Society of Technical Analysts will not be held liable for any loss or damage resulting directly or indirectly from the use of any information on this site.

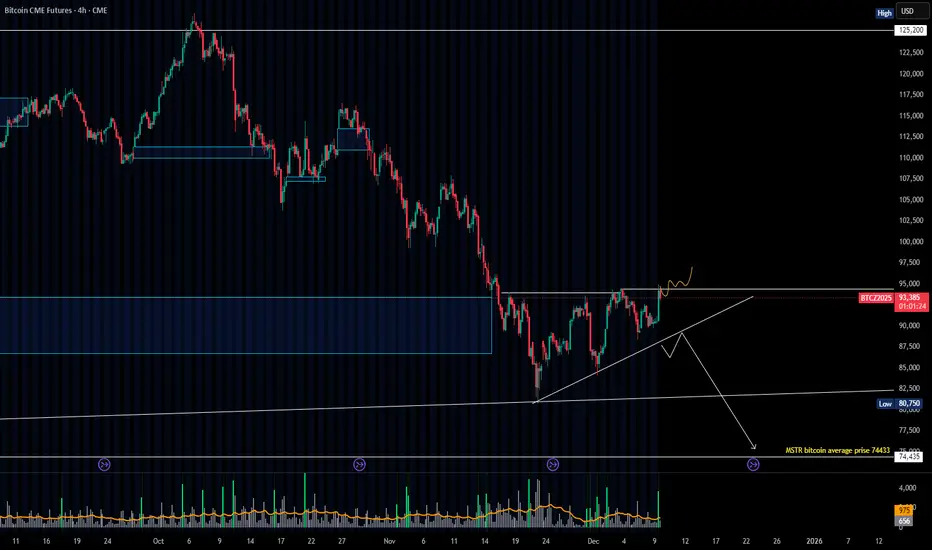
BTC CME: Sideways Structure and Key Levels AheadBTC CME continues to move within a sideways range, offering no clear trend direction at the moment.
As outlined earlier, the key zones remain unchanged:
Long confirmation: Break and consolidation above 95,000.
Short confirmation: Breakdown of the trendline below 90,000.
Currently, the asset is pressing toward the lower boundary of the range.
If the price breaks through and retests the trendline from below, I will expect further downside continuation with a move toward the previous month’s lows.
max pain in sight for the bullsgm,
i've been entertaining a few ideas on btc, and this one comes to mind today.
the possibility of 1 more leg down, to take the rest of the longs that fomoed into the rally this week, and the few who managed to survive the drop from ath by averaging down mindlessly.
---
the way we bounced is very reminiscent of a wave 4.
btc is teethering on the edge of a negative funding rate (our favorite contrarian indicator)
by creating one more low, we will for certain print a massive, multi-week negative funding reading, and that's when a proper buy could take place.
---
i have personally decided to fade the rally, and have de-risked quite substantially from the positions i managed to pick up near the lows.
---
in my opinion, the path of maximum pain is a sweep of that notorious 75k level that everyone keeps talking about.
---
---
🎯 - 75k

BTC CME: Key Level Retest and Liquidity SweepBTC CME demonstrated strong growth today on increased volume, reaching last week’s highs and sweeping liquidity.
Currently, the asset is trading directly inside last week’s high zone. I’m waiting for today’s daily close to define the next direction.
Bullish scenario: Daily close above the level with confirmation.
Neutral scenario: Daily close below the level and continued trading under it keeps the outlook at 50/50.
Market structure at this level remains critical — the daily close will set the tone.
BTC CME GAP (4H)Bitcoin has a CME gap in the $89,805 – $89,425 range
These gaps are usually filled before the price makes its next move.
Let’s see what happens.
For risk management, please don't forget stop loss and capital management
Comment if you have any questions
Thank You

2 corrective counts Invalidation lines will determine which count is correct.
Orange count: Above ~104.000
Yellow count: Below ~81.000
Both will lead to lower prices end of 2026.

18/12/2025 $BTC - $DXY -$SPX - $NDX - $GOLD forecastFollowing yesterday (a full DOWN day), we should see another attempt at the lows before midday UTC for $BTC. Ranging for all other indexes.

MBT - Futures – short 12.18.25Bias: Bearish on 1H
Context: Strong downside impulse followed by a corrective bounce.
Location: Short taken into EMA 20 / prior supply zone around ~89–91k.
Confirmation: Bounce failed to hold above EMA 20 and rolled over.
Entry: When 15min EMA 20 lost upward momentum above EMA 50, within the zone
Stop: Above the supply zone / EMA confluence (clean invalidation).
Target: Rotation back toward recent lows (~86k).
R:R: ~1:3 (realistic for a rotation continuation).
Session: Executed during RTH. Avoid first 5min of the market

2026 BTC Bir boşluk daha doldurabilir dikkatThe 30k gap that formed in October 2023 is progressing in line with a head and shoulders pattern, and if nothing changes, the 30k gap will be back in the latter months of 2026.

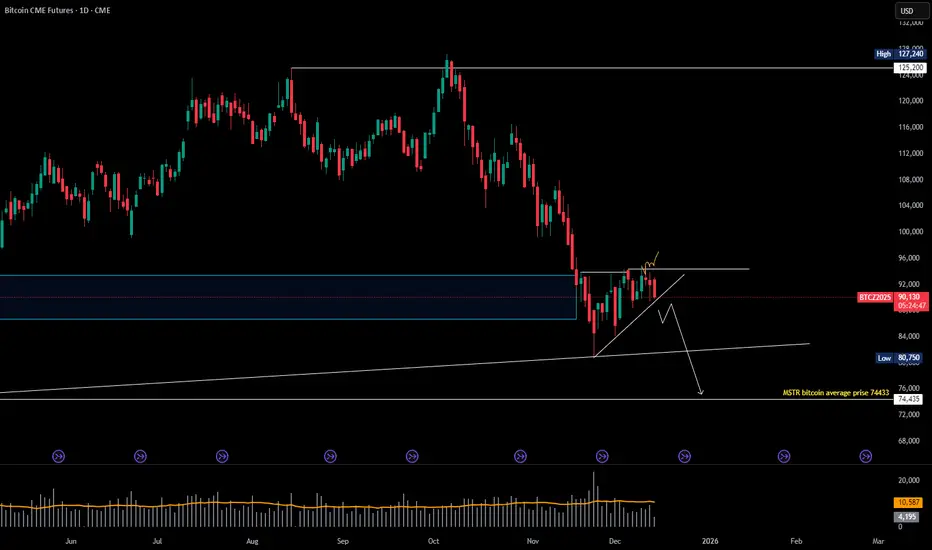
Bitcoin Alert: Bearish Flag in Play? 📉 Bitcoin is showing signs of near-term consolidation that could be forming a bearish flag pattern. If price closes below 88,000, this breakdown could trigger direct losses toward 87,500.
Key technical signals to watch:
• 55 & 200-day moving averages are above the market and look set to cross lower.
• Price remains capped between 103,000–104,000, keeping sentiment negative.
• On the weekly chart, support at 80,750 is critical. A failure here risks a rapid sell-off toward 74,445 (March 2024 highs).
⚠️ Disclaimer: This analysis is for educational purposes only and does not constitute financial advice. Always do your own research before making trading decisions.

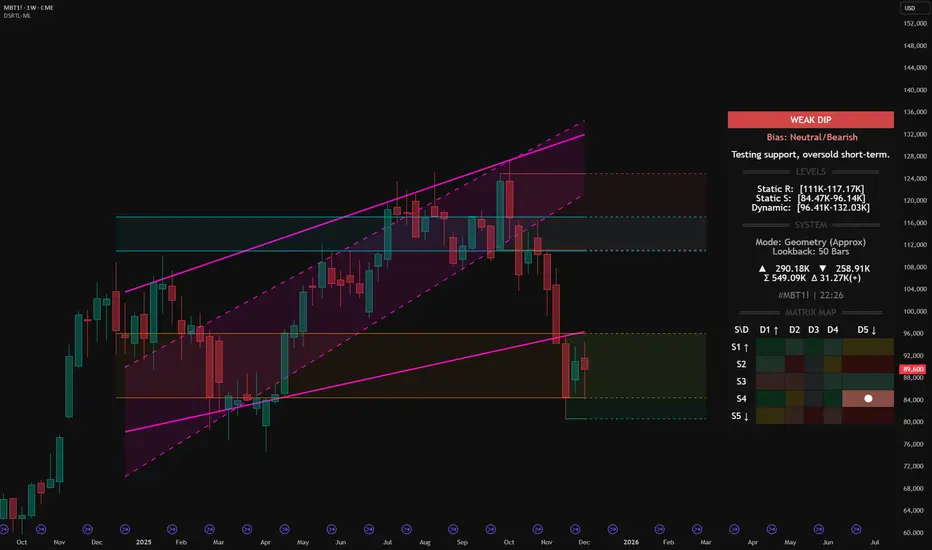
Micro Bitcoin Futures (MBT1!) – DSRTL‑ML Weak Dip at supportMicro Bitcoin Futures (MBT1!) – DSRTL‑ML Weak Dip at S4–D5 Support
We are analyzing the weekly structure of Micro Bitcoin Futures (MBT1!) using the institutional DSRTL‑ML support/resistance engine. On this bar the indicator classifies the state as WEAK DIP with a Neutral/Bearish bias and the system message:
Testing support, oversold short-term.
This reading comes from the current matrix position S4–D5 on the Matrix Map and defines the context for the price action inside this support zone.
1. DSRTL Matrix Diagnosis – State S4–D5
S4 – Static Support in Control
Price is trading inside the DSRTL Static Support band:
Static S: 84.47K – 96.14K
In the logic of DSRTL‑ML, this green support zone marks a historical high‑volume demand node where passive buy liquidity has previously absorbed aggressive selling. It behaves as a structural floor rather than a neutral price area.
D5 – Overshoot Below the Dynamic Channel
At the same time, price is positioned below the 5‑Point Dynamic Channel:
Dynamic Band: 96.41K – 132.03K
State D5 describes a downside extension beneath the lower boundary of the dynamic channel. Within this framework, that move is read as an oversold displacement away from the equilibrium path of the trend geometry, not as a fully confirmed new downtrend on its own.
Combined Reading – WEAK DIP with Neutral/Bearish Bias
The overlap of:
price sitting inside Static Support S4, and
price being oversold relative to the Dynamic Channel (D5)
produces the WEAK DIP classification. The Neutral/Bearish bias tells us that the dominant leg into this area is still downward, but the current candle represents a weaker phase of that dip occurring directly into a pre‑defined demand floor.
2. Key DSRTL Levels on This Chart
From the Levels and System panels on the chart:
Static Resistance (Supply Block): 111K – 117.17K
Upper structural ceiling derived from the DSRTL matrix of historical volume and price interaction.
Static Support (Demand Block): 84.47K – 96.14K
The active S4 floor where the current weekly bar is developing.
Dynamic Channel (Trend Geometry): 96.41K – 132.03K
The 5‑Point trend channel that defines the dynamic path of price; its lower edge around 96.41K is the first mean‑reversion checkpoint above the market.
Volume Metrics on This Bar:
Buying volume (▲): 290.18K
Selling volume (▼): 258.91K
Total volume (Σ): 549.09K
Delta volume (Δ): +31.27K
The positive delta together with the WEAK DIP label supports the idea that, inside S4, aggressive selling is meeting responsive buying rather than progressing as a fresh impulsive breakdown.
3. My Structural View Based on DSRTL‑ML
From a structural perspective, I read this configuration as follows:
Context of the Trend
The Neutral/Bearish bias confirms that the larger move into this zone is still a downward leg. The market is not flagged by DSRTL‑ML as a confirmed bullish reversal; instead, we are in a weak phase of the decline, pressing into defined support while the geometry is stretched.
Support Floor and Invalidation
As long as weekly closes remain above roughly 84.5K – the lower boundary of the S4 block – I consider this area a working demand floor for the current sequence. A decisive weekly close below that level would invalidate the weak‑dip narrative and shift the focus to a more developed breakdown of support.
Primary Path While S4 Holds
If S4 continues to hold, my expectation is that the oversold S4–D5 state will tend to resolve through mean reversion back toward the lower edge of the Dynamic Channel around 96.41K. In DSRTL terms, that is the first structural magnet above price once an overshoot has occurred.
Next Reference Above the Channel
Should price manage to re‑enter and hold inside the Dynamic Channel, the next major reference becomes the Static Resistance block at 111K – 117.17K. In my view, that zone represents the upper boundary of the current weekly structure and the area where I would expect supply and volatility to increase again.
In short, DSRTL‑ML currently maps MBT1! as a weak dip into S4 support with a still‑bearish background trend. My directional view is that, while this support holds, the structure favors a corrective mean‑reversion phase toward the dynamic band rather than an immediate continuation breakdown, with any weekly close below the S4 floor acting as a clear structural invalidation.
Indicator used for this analysis: DSRTL‑ML (Dynamic Support & Resistance Trend Logic).
Disclaimer: This publication expresses my personal opinion on the MBT1! chart based solely on the DSRTL‑ML indicator and standard price/volume analysis. It is not financial or investment advice and does not constitute a recommendation to buy or sell any instrument.
BTC Update (3 hr)MFI oversold on 3 hr, RSI probably hits it too. Then we get another bounce, but daily MFI is getting close to overbought, so I didn't play it.
So far it looks like it;s just drifting sideways.

BTC UpdateLooks like MFI is headed back up on the 3hr chart so it probably gets a Friday pump. Silver (SI) and NASDAQ:NDX (NQ) futures went oversold Thu afternoon, there were better option plays than BTC.
(I posted the plots)
IBIT (BTC ETF) is on my tracking list, but I'll only trade it when it makes sense to do so. The one to play was silver, lol. I substituted gold for silver which was probably a mistake, but it's looking like I'll make some money.

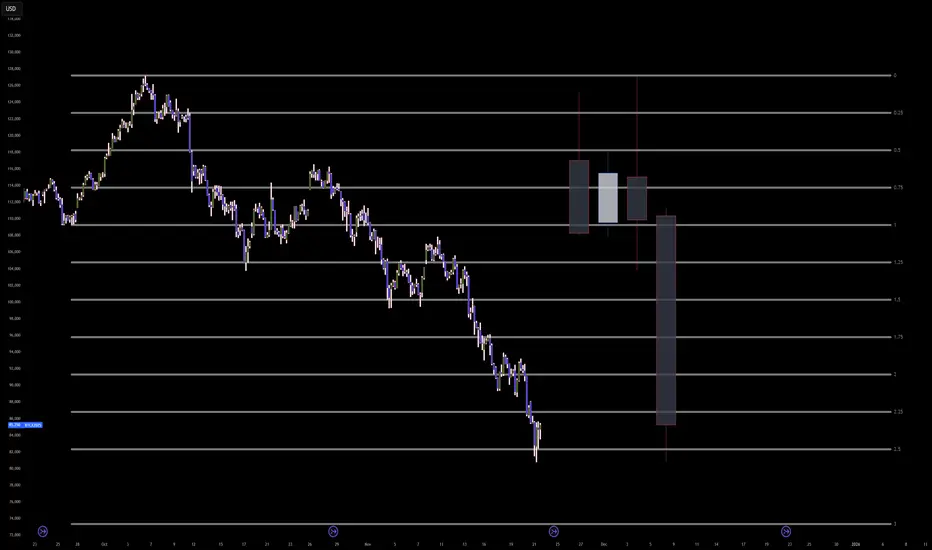
BTC CME Futures: The Capitulation Buy SetupSimply:
The logic here is simple.
Bitcoin has dropped too far and too fast.
We are currently hitting a major mathematical exhaustion point (the 2.5 Standard Deviation line).
At the same time, we are entering that big blue support box between 78k and 82k where the massive rally started earlier this year.
This is not a crash anymore; it is a bear trap.
Retail traders are panic selling right at the bottom, which provides the liquidity for big players to buy.
We are setting a limit order to catch the final wick down before the bounce.
Entry: 81,250 (Buy Limit)
Stop Loss: 77,500 (If it goes below here, the setup is wrong)
Target: 94,000 (The bounce back to equilibrium)
Don't chase the red candles.
Let the price come to you, fill the order, and wait for the squeeze.
____
Advanced:
The algorithm is currently executing a terminal volatility expansion into the 2.5 Standard Deviation extremity to finalize the Macro Sell Model and engineer a generational Smart Money Reversal.
The present liquidation cascade is not a crash but a precise, mathematically ordained delivery of price into the deep discount 'Blue Box' accumulation array to harvest the final sell-side liquidity before the grand repricing event.
Entry: 81,250.00 (Limit Order - 4,000 points below market)
Stop loss: 77,500.00 (3,750 points)
Take profit: 94,000.00 (12,750 points)
Risk to reward ratio: 3.40R
The Opportunity
The Bitcoin algorithm has been running a high-velocity sell program from the 126,000.00 highs, systematically dismantling every bullish PD Array.
However, we have now breached the Event Horizon. The price is magnetically drawn to the confluence of the 2.5 Standard Deviation projection and the historical Accumulation Block (78k-82k) originating from the early 2025 impulse.
This zone represents the 'Algorithmic Floor'—a region of maximum discount where institutional order flow must pivot from distribution to accumulation to close massive short positions and defend the macro bull trend.
The Entry
Do not chase the current candle. The algorithm demands a touch of the 2.5 Standard Deviation level at approximately 80,800.00 - 81,200.00 to complete the fractal expansion.
We place our limit order at 81,250.00 to front-run the absolute mathematical bottom, capitalizing on the 'Capitulation Wick' that will clear the final trailing stops.
This entry is timed for the CME close/open gap or the weekend volatility injection, which often targets these extreme deviation levels to trap late bears before a violent Monday reversal.
The Invalidation
The reversal thesis is ontologically corrupted if price displaces below the 3.0 Standard Deviation level and the bottom of the accumulation block at 74,000.00.
A sustained closure below this level signifies a total failure of the macro structure and a transition into a secular bear market, invalidating the accumulation narrative.
This would shift the probability manifold to the Primary Antithetical Chain, targeting the 60,000.00 liquidity void.
Key Trajectory Waypoints
Target 1: 86,000.00 | Type: Immediate Rebalance (2.25 SD) | Probability: 90% | ETA: 24 Hours
Target 2: 90,500.00 | Type: Internal Bearish Breaker | Probability: 75% | ETA: 3-5 Days
Target 3: 94,000.00 | Type: Equilibrium / FVG Fill | Probability: 60% | ETA: 1-2 Weeks
The Shadow Reality
A 25% probability exists for the antithetical reality: The Abyss Cascade.
In this scenario, the 2.5 SD level fails to provide a reaction, and the algorithm enters a 'Free Fall' discovery mode targeting the 3.0 SD at 74,000.00 immediately.
This reality is confirmed if price slices through 80,000.00 with no wick response.
___
tags: BITSTAMP:BTCUSD COINBASE:BTCUSD INDEX:BTCUSD BINANCE:BTCUSD
BTC at a Crossroad: Head & Shoulders or Moonshot? Analyzing the CME Bitcoin Futures chart, we can clearly see confirmation of the price gap between $92K and $94K, which significantly increases the probability of a Head & Shoulders (H&S) formation.
✅ Key Scenarios to Watch
Scenario 1 – H&S Confirmed:
Potential retracement toward $52K–$62K based on the right shoulder's depth
Scenario 2 – Failure H&S Confirmed:
Bullish breakout could push BTC toward $140K–$150K. based on the right shoulder's depth
🔍 Technical Insight
The left shoulde r formed near the Fibonacci 0.618 / 0.382 leve ls. Based on these Fib zones, the right shoulder could develop within a similar range—critical for validating the pattern if weekly closure occurs over 94K .
Disclaimer: This analysis is for educational purposes only and does not constitute financial advice. Always do your own research and manage risk appropriately before making any trading decisions.

$BTCLooking at this BTC/USD (Bitcoin futures) daily chart, we see price action that screams caution for bulls. Bitcoin has been grinding higher in a choppy uptrend since late October, but it's now testing a critical resistance cluster around $98,000–$100,000. Volume is tapering off on the upside, suggesting waning momentum. Also the RSI (14) is hovering at 72—deep into overbought territory without divergence yet, but that's often the calm before the storm.

BITCOIN AL ALZA
The chart shows a trough area, where the price dropped very quickly. Theory indicates that it will rise again rapidly in the next few hours.
