ES (SPX, SPY) Analysis, Key Levels, Setups for (Nov 11th)S (Dec) Plan for Tue, Nov 11 — Level-KZ Protocol (15/5/1).
Bias is constructive while trading above the 6,838–6,845 range; the first test into 6,880–6,900 serves as a decision point. Thinner liquidity is expected around the U.S. holiday, so execute trades only within NY kill zones.
Setups (trade the level → next level; 15m→5m→1m sequence)
Long — Bounce at 6,838–6,845: sweep/quick-reclaim → 5m re-close → 1m HL entry. Hard SL below 6,830 wick. TP1 6,872–6,880, TP2 6,900, TP3 6,930. Viability gate: TP1 ≥ 2.0R.
Long — Acceptance above 6,900: full 15m body close >6,900 → hold the retest → 1m HL. SL below trigger wick. TP1 6,930, TP2 6,955–6,970, runner eyes weak-high cleanup.
Short — Rejection fade 6,900–6,930: wick through → 15m close back below 6,895 → 5m LH. SL above session high. TP1 6,872, TP2 6,845, TP3 6,805; lose 6,805 and momentum can slide toward 6,770 then 6,733.
News & session conditions (ET)
U.S. Veterans Day — equities open; U.S. bond market closed; U.S. macro slate is light. Overnight focus: NZ inflation expectations (evening ET), U.K. Labour Market (pre-London), Germany ZEW (pre-NY). Expect patchy liquidity around the holiday; be strict with the 2R viability gate and trade only inside NY AM/PM kill-zones.
S&P 500 E-mini Futures
No trades
Market insights

S&P 500 (ES1!): Is This The Dip We Were Waiting For? Yes!Welcome back to the Weekly Forex Forecast or the week of Nov. 10-14th.
In this video, we will analyze the following FX market: S&P 500 (ES1!)
The S&P500 is respecting the Weekly +FVG... barely! Friday's rally may indicate the pullback is over and the resumption of the bullish momentum is upon us.
Look for valid buy setups only! Sells are not valid unless there is a bearish break of structure!
Enjoy!
May profits be upon you.
Leave any questions or comments in the comment section.
I appreciate any feedback from my viewers!
Like and/or subscribe if you want more accurate analysis.
Thank you so much.
Disclaimer:
I do not provide personal investment advice and I am not a qualified licensed investment advisor.
All information found here, including any ideas, opinions, views, predictions, forecasts, commentaries, suggestions, expressed or implied herein, are for informational, entertainment or educational purposes only and should not be construed as personal investment advice. While the information provided is believed to be accurate, it may include errors or inaccuracies.
I will not and cannot be held liable for any actions you take as a result of anything you read here.
Conduct your own due diligence, or consult a licensed financial advisor or broker before making any and all investment decisions. Any investments, trades, speculations, or decisions made on the basis of any information found on this channel, expressed or implied herein, are committed at your own risk, financial or otherwise.

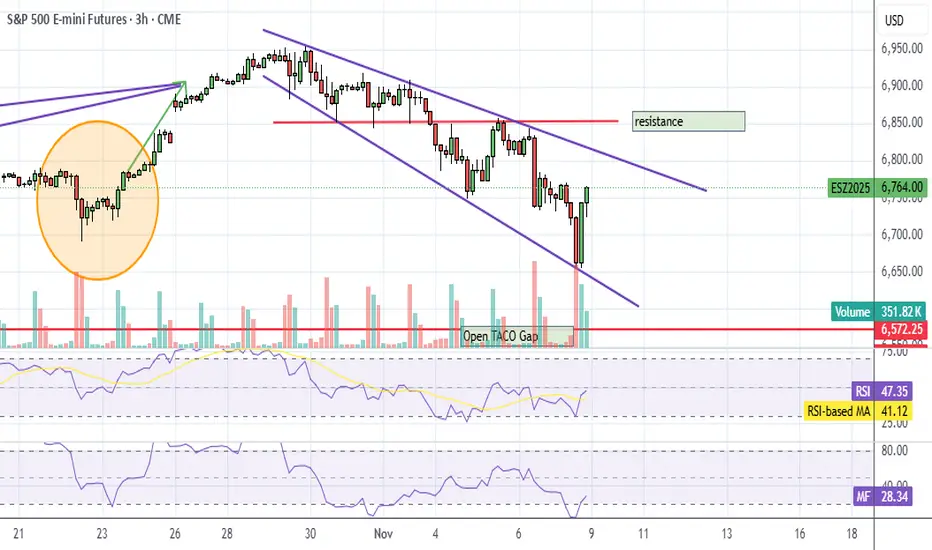
ES UpdateTrying to break through the resistance line, not sure what's gonna happen tonight.
Open gap always makes me bearish, so I did not go long again after I dumped my calls on open. Just waiting for MFI to get overbought so I can buy puts. Guessing that will happen by Wed open.
Not sure why foreign markets gapped up because of the shutdown ending, and the market didn't tank because of the shutdown so there's really no reason for it to rally now that it's ending..... so I'm expecting a pump and dump.
Sorry, no arrows today.

ES1 technical trade ideas for this week11/10/25-ES1 technical trade ideas for this week11/10/25
well be looking forward to a short pull back in the 6900-6920 range has a high selling pressure in those lv

Long ESLong ES, try to time the entry and you should get a good RR.
Also cut your position in half if the price touches the blue line.
If you have a spesific request about certain instrument that you want me to analyize, just let me know.
Goodluck everyone!!

S&P500/ES Intraday Trade Idea VideoThoday I see a potential trade setting up in the S&P500 Futures.
My overall thesis is to the upside, so no Shorts today. Unless we come up to the first resistance level, or even beter, the 1/4 line. From there I'll be willing to risk some of my money.
Long option 2:
From the CIB or Centerline, after a pullback to these lower levels.
Happy Monday all §8-)

Investing in the World Market (Global Investing)🌍 1. What Is the World Market?
The world market refers to all financial markets across the globe where people trade assets such as stocks, bonds, currencies, commodities, and real estate. When you invest globally, you are participating in this large network of financial activities happening in different regions and time zones.
It includes:
Developed markets like the U.S., U.K., Japan, Germany, and France.
Emerging markets like India, Brazil, China, and Indonesia.
Frontier markets, which are smaller and less developed, like Vietnam or Nigeria.
Each region has its own economic drivers, growth opportunities, and risks. Together, they form the world market.
💡 2. Why Invest in the World Market?
Here are the main reasons why global investing makes sense:
a. Diversification of Risk
When you invest only in your home country, your money depends heavily on one economy. But global investing spreads your risk across multiple countries.
If one market underperforms—say, the Indian market slows down—the U.S. or Japanese markets might still perform well, balancing your returns.
b. Access to Global Growth
Different parts of the world lead in different industries.
For example:
The U.S. dominates technology (Apple, Microsoft, Google).
Europe leads in luxury goods (LVMH, Ferrari).
Asia excels in manufacturing and electronics (Samsung, TSMC).
By investing globally, you gain exposure to all these growth stories.
c. Currency Advantage
If your home currency weakens compared to others, your foreign investments may gain in value when converted back. For instance, if you invest in U.S. stocks and the U.S. dollar strengthens, your returns increase when converted to Indian rupees.
d. Inflation Hedge
Global assets, especially commodities or foreign real estate, can protect against inflation. When local inflation rises, global investments may provide a cushion.
🏗️ 3. How to Start Investing in the World Market
Here’s a step-by-step guide that’s easy to follow:
Step 1: Understand Your Goals and Risk
Decide why you want to invest globally.
Are you seeking growth opportunities abroad?
Do you want to hedge against domestic risks?
Or do you just want to diversify your portfolio?
Your goal determines where and how much you should invest. For example, a conservative investor may prefer global mutual funds or ETFs, while an aggressive investor might buy foreign stocks directly.
Step 2: Choose the Right Route
There are several ways to invest globally:
Global Mutual Funds:
These are mutual funds in your country that invest in international markets. You don’t need a foreign trading account. Examples include funds focused on U.S. technology or global healthcare sectors.
Exchange-Traded Funds (ETFs):
ETFs are like mutual funds but trade on stock exchanges. You can buy global ETFs that track indexes like:
S&P 500 (U.S.)
MSCI World Index (global developed markets)
MSCI Emerging Markets Index
Direct International Stocks:
You can buy shares of global companies such as Apple, Google, or Toyota through platforms that allow cross-border trading.
Foreign Index Funds:
These funds track international indexes. They’re low-cost and simple for beginners.
Alternative Assets:
You can even invest globally in commodities (like gold, oil), real estate, or startups through specialized funds.
Step 3: Understand Costs
Global investing involves certain costs, such as:
Currency conversion fees
Brokerage charges
Tax implications
Expense ratios in global funds
Before investing, compare these costs to your potential returns.
Step 4: Learn About Tax Rules
Different countries have different tax laws. For instance, U.S. dividends are taxed for foreign investors, and you might need to declare them in your home country too. Always check Double Taxation Avoidance Agreements (DTAA) to avoid paying tax twice.
Step 5: Stay Updated
Global markets react to different economic events—like U.S. Federal Reserve rate changes, European inflation, or China’s manufacturing output.
Keep track of global trends, news, and currency movements that can impact your portfolio.
📊 4. Examples of Global Investment Options
Here are some easy examples to understand where people commonly invest globally:
Investment Type Example Region Focus
U.S. Stocks Apple, Microsoft, Amazon USA Tech innovation
European Stocks Nestlé, BMW, LVMH Europe Consumer goods & luxury
Asian Stocks Samsung, Toyota, TSMC Asia Manufacturing & electronics
ETFs S&P 500 ETF, MSCI World ETF Global Broad diversification
Global Mutual Funds Franklin Global Equity Fund Global Mixed assets
🌐 5. Understanding Global Market Risks
Just like domestic investing, global investing has risks. Here are key ones to know:
a. Currency Risk
When foreign exchange rates move against you, returns can drop. For instance, if the dollar weakens after you invest in U.S. stocks, your profits may reduce in your home currency.
b. Political and Economic Risk
Every country faces unique challenges—like wars, elections, policy changes, or recessions—that can affect its market.
c. Liquidity Risk
Some foreign markets may not have as many buyers and sellers, making it harder to sell your investments quickly.
d. Regulatory Differences
Different countries have different rules and reporting standards, which may affect transparency.
📈 6. Strategies for Success in Global Investing
Here are a few simple strategies that can help:
1. Start Small
You don’t need to move all your money abroad. Start with 10–20% of your total portfolio in global assets.
2. Diversify Across Regions
Avoid putting everything into one country. Instead, mix developed markets (like the U.S.) with emerging markets (like India or Brazil).
3. Use Global Index Funds
If you’re unsure which countries or stocks to pick, use broad index funds that automatically diversify your investments.
4. Focus on Long-Term Growth
Global investments might fluctuate in the short term but tend to deliver solid returns over time. Patience is key.
5. Rebalance Regularly
Revisit your portfolio every 6–12 months. Adjust if one region becomes overweight or underperforming.
🌎 7. The Future of Global Investing
Global investing is becoming easier and more digital. With the rise of fintech platforms, fractional investing, and ETFs, even small investors can own global assets.
Emerging themes include:
Sustainable investing (ESG) – investing in companies with environmental and social responsibility.
Artificial Intelligence (AI) and Tech – global funds focusing on innovation.
Renewable Energy – a growing global sector as the world moves toward clean energy.
Healthcare and Biotech – driven by aging populations and new medical breakthroughs.
As economies become more connected, global investing will no longer be an “option”—it’ll be a necessity for building wealth.
💬 Final Thoughts
Investing in the world market opens doors to immense opportunities beyond your borders. It allows you to benefit from global innovation, economic growth, and diversification. But it also requires understanding of currency risks, market differences, and long-term patience.
Start small, choose the right instruments, and gradually expand your exposure. With a disciplined and informed approach, global investing can transform your portfolio into a balanced, future-ready powerhouse that grows with the world economy.
In short — think global, invest wisely, and stay patient. 🌍💰
ES1This Pair has given us enough clues in the past to take trades based on Technicals , i am not prdicting the future but hope this will be a guide line for me to follow as Price continues it's path

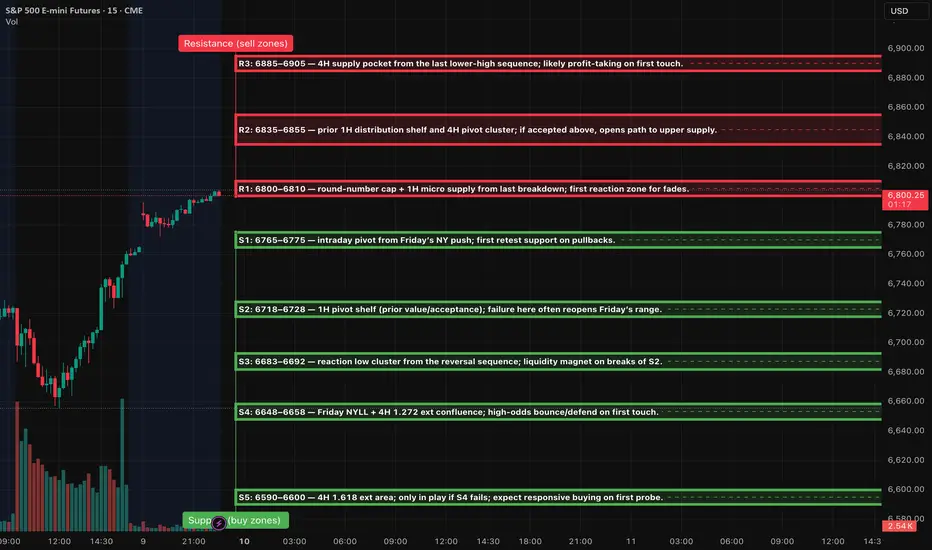
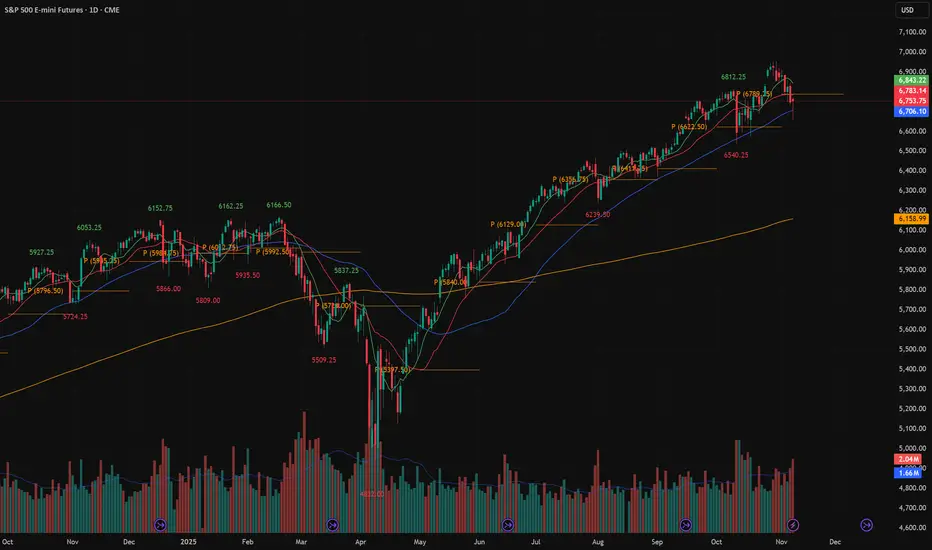
ES (SPX, SPY) Week Ahead Analysis, Levels (Nov 10th - 14th)Context (HTF)
Price action has shown a notable rebound from the 6655 level, currently approaching the 6800 to 6810 range, which is characterized by recent supply identified on the 1-hour and 4-hour charts. Despite the ongoing lower-highs structure observed on the 4-hour timeframe, momentum appears to be shifting positively following Friday’s significant low. Traders should anticipate a period of two-way trading early in the week, likely within the 6650 to 6850 corridor, until mid-week economic data provides clearer direction.
Setups (Level-KZ Protocol 15/5/1)
1) Rejection Fade @ 6800–6810 (Tier-1 if first touch)
15m rejection back inside → 5m re-close below with LH → 1m first pullback fail.
Entry: 6798–6808 on 1m fail. SL: 15m wick-high +0.25–0.50.
TP1: 6768–6775 (S1). TP2: 6723 (S2). Viability gate: TP1 ≥ 2.0R using the 15m-wick stop.
2) Acceptance Continuation > 6810
15m full-body close above → 5m pullback holds 6805–6810 → 1m HL entry.
Entry: 6808–6812. SL: 6794–6798 (15m wick).
TP1: 6838–6848 (R2). TP2: 6885–6905 (R3). No trailing before TP2; at TP1 close ~70%, set runner to BE.
3) Quick-Reclaim Bounce @ 6765–6775 (Tier-2)
Sweep S1 → instant reclaim on 5m → 1m HL.
Entry: 6767–6774. SL: 6756–6759.
TP1: 6798–6810. TP2: 6835–6845.
4) Exhaustion Flush Bounce @ 6648–6658 (Tier-3)
Capitulation wick into S4 → 5m reversal signal → 1m HL.
Entry: 6651–6657. SL: 6639–6642.
TP1: 6686–6692. TP2: 6718–6728.
What can move ES this week (keep risk light around release windows)
• Tue (Nov 11): Veterans Day — equities open, U.S. bond market closed; liquidity can be thinner.
• Thu (Nov 13, 8:30 ET): October CPI.
• Thu (Nov 13, 8:30 ET): Initial jobless claims (weekly).
• Fri (Nov 14, 8:30 ET): October PPI and Advance Retail Sales.
• Fed speakers/boards: See the Fed’s official calendar for any added talks this week.
• Earnings of note: Several large caps report mid-week (e.g., Cisco; Disney). Expect single-name volatility spillover.
Notes for execution: mark the zones on 15m; wait for your 15→5→1 confirmation sequence; enforce the 2.0R viability gate using the 15m wick stop; no partials before TP1; max two tries per level.
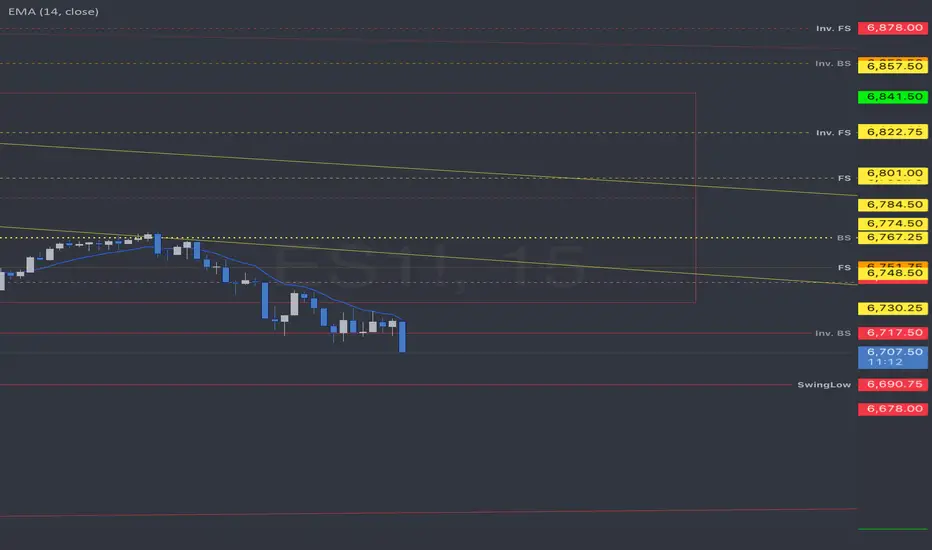
Amy5 min for set up and one minute for entry
Volume shelf is white dotted line, and two blue lines are GEX Walls, so you have Confluence on the 5-minute chart. Go to one minute for entry, look for buyside imbalance for entry and use latest swing low as stop loss.

ES Open GapFutures gapped up this afternoon, and that gap will eventually have to fill. Not sure when. Probably when MFI hits overbought, I don't see it going back and filling quickly.
I'll post an update in the morning if I have time.

Sp500We just hit important trend line and bounce inverting a 4H with not resistance so if we can return to this 4H OB/ FVG staying above the 50% of the daily wick above 6725. Taking a long set up pushing away from PDA is a high probability trade targeting 6800s. If this level fail consolidation and lower prices are more likely.
Note: Watch for Gap up or Gap down. They can alter the set up.

SP500We just hit important trend line and bounce inverting a 4H with not resistance so if we can return to this 4H OB/ FVG staying above the 50% of the daily wick above 6725. Taking a long set up pushing away from PDA is a high probability trade targeting 6800s. If this level fail consolidation and lower prices are more likely.
Note: Watch for Gap up or Gap down. They can alter the set up.

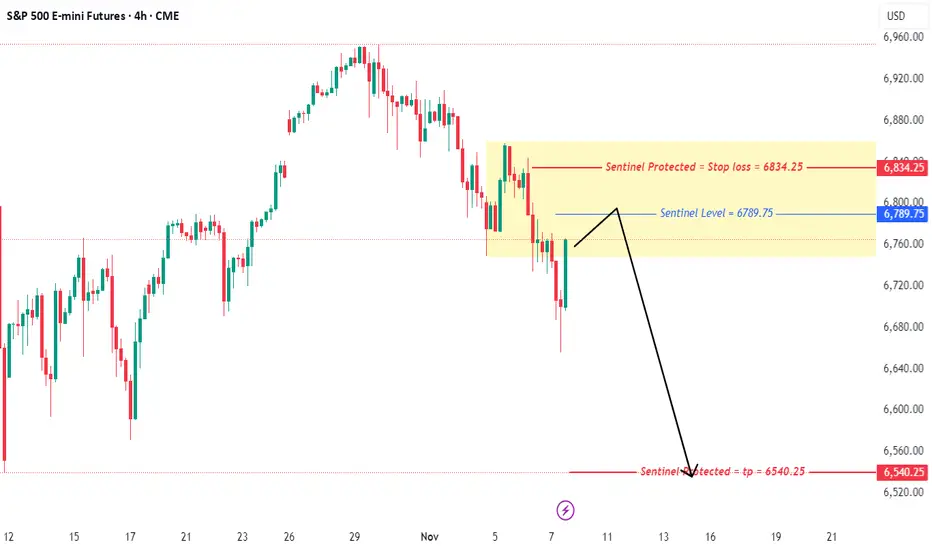
ES QuantSignals V3 Futures 2025-11-08ES QuantSignals V3 Futures 2025-11-08
ES Futures Signal | 2025-11-08
• Direction: SELL | Confidence: 68%
• Type: Index Futures | Timeframe: 1H
• Entry Range: $6757.50
• Target 1: $6665.00
• Stop Loss: $6810.00
• Volume vs Avg: 1.0×
• Recent Move: -1.34%
• ⚠️ MODERATE RISK WARNING: Consider reducing position size due to moderate confidence level.
⚖️ Compliance: Educational futures commentary for QS Premium. Not financial advice.
🚀 QS V3 ELITE FUTURES ANALYSIS
Generated: 2025-11-08 16:18:07 ET
Instrument: ES ($6753.75)
Type: Index Futures
Trend: BEARISH
Confidence: 67.7%
Timeframe: 1H
Model: QS + Katy AI
Strictness: MEDIUM
🎯 TRADE RECOMMENDATION
Direction: SELL
Confidence: 68%
Conviction Level: MEDIUM
🧠 ANALYSIS SUMMARY
Katy AI Signal: Bearish with 67.7% confidence, predicting decline to $6662.98 (-1.34%)
Technical Analysis: Current price $6753.75 showing immediate weakness after -1.34% drop. Katy's prediction shows initial choppy action with clear bearish trajectory emerging from November 12th, accelerating downward through November 13-14. Key resistance at $6780-6800 zone, support levels at $6700 then $6650.
Macro & News: Light news flow with mostly energy sector specifics. Market appears to be driven by technical positioning rather than major catalysts. Normal VIX at 19.08 suggests orderly selling pressure.
Flow & Positioning: Volume at average levels indicates normal participation. Options flow data appears incomplete/unreliable. Katy's prediction shows consistent selling pressure building over the 120-period horizon.
Risk Level: MODERATE - Primary risk is initial choppiness before bearish trend establishes. Stop must account for potential false breakdowns.
💰 TRADE SETUP
Contract: ES
Entry Price: $6750 - $6765
Take Profit 1: $6665
Take Profit 2: $6590
Stop Loss: $6810
Position Size: 2 contracts (moderate conviction with proper risk management)
⚡
Image
QS Analyst
APP
— Yesterday at 4:18 PM
COMPETITIVE EDGE
Why This Trade: Katy AI provides high-confidence bearish signal with detailed time-series validation showing clear downward trajectory after initial consolidation
Timing Advantage: Entry during Globex session allows positioning before potential acceleration of selling pressure during regular hours
Risk Mitigation: Wide stop-loss accounts for initial volatility, while tiered take-profits capture momentum at key support levels
🚨 IMPORTANT NOTES
Monitor for any unexpected bullish catalysts that could reverse the technical bearish setup
Be prepared for choppy price action between November 9-11 before clearer bearish trend establishes
Position size should be reduced if market shows unexpected strength above $6780 resistance
Trade Validation: Katy AI's bearish prediction aligns perfectly with current technical weakness and normal volatility environment, providing strong directional conviction for short positions.
📊 TRADE DETAILS 📊
🎯 Instrument: ES
🔀 Direction:
💵 Entry Price: 6757.50
🎯 Profit Target: 6665.00
🛑 Stop Loss: 6810.00
📏 Size: N/A
📈 Confidence: 68%
⏰ Entry Timing: N/A
🕒 Signal Time: 2025-11-08 19:18:04 EST
⚠️ MODERATE RISK WARNING: Consider reducing position size due to moderate confidence level.
---
QS V3 Futures Strategy System - Professional futures trading with Katy AI intelligence.

Analysis of the ES for the week of November 10 to 14, 2025Analysis based on a deep mathematical and scientific understanding of price action, particularly for my two markets NQ & ES. Looking forward to reading your comments.
Major Global Stock Exchanges1. Understanding Stock Exchanges
A stock exchange is an organized marketplace where securities—like stocks, bonds, and derivatives—are issued and traded. It provides liquidity to investors, transparency in pricing, and regulatory oversight to ensure fair practices. Each major exchange operates under a national financial authority but impacts global markets through interconnected trading systems and investor participation.
Stock exchanges help channel savings into productive investments and play a crucial role in economic development by enabling companies to raise capital for growth. The performance of major exchanges often mirrors the strength or weakness of their respective economies.
2. The New York Stock Exchange (NYSE)
The New York Stock Exchange, located on Wall Street, is the largest and most prestigious stock exchange in the world by market capitalization. Established in 1792 under the Buttonwood Agreement, the NYSE has been a symbol of American capitalism and financial power for more than two centuries.
Market Capitalization: Over $25 trillion (as of 2025).
Listed Companies: Around 2,400 from diverse sectors.
Index: The Dow Jones Industrial Average (DJIA) and the S&P 500 track major NYSE-listed stocks.
The NYSE operates under the Intercontinental Exchange (ICE) and uses both an electronic trading system and a physical trading floor. Its hybrid model ensures transparency, liquidity, and efficient execution of trades. Companies like Apple, Microsoft, Coca-Cola, and Johnson & Johnson are part of its listings.
The NYSE’s stability, regulatory standards, and investor confidence make it a global benchmark for equity trading and corporate governance.
3. NASDAQ (National Association of Securities Dealers Automated Quotations)
The NASDAQ is the second-largest stock exchange globally, established in 1971 as the world’s first electronic stock market. Unlike the NYSE, NASDAQ has no physical trading floor—it operates entirely electronically.
Market Capitalization: Around $22 trillion.
Focus: Technology-driven companies.
Major Index: NASDAQ Composite Index and NASDAQ-100.
NASDAQ is home to global technology giants such as Apple, Amazon, Google (Alphabet), Meta (Facebook), and Tesla. It revolutionized trading by introducing automation and electronic order matching, which reduced transaction costs and improved efficiency. Its success represents the digital transformation of global finance.
The NASDAQ’s role in nurturing high-growth tech companies has made it synonymous with innovation and modern capitalism.
4. London Stock Exchange (LSE)
The London Stock Exchange, one of the oldest exchanges, traces its roots to 1773. Located in the financial district of London, it is the primary market for securities in the United Kingdom and a vital global financial hub.
Market Capitalization: About $4 trillion.
Listed Companies: Over 1,900 from more than 60 countries.
Main Index: FTSE 100 (Financial Times Stock Exchange 100 Index).
The LSE operates under the London Stock Exchange Group (LSEG), which also owns other financial institutions like Refinitiv and Borsa Italiana. It plays a major role in global capital markets due to its international listings and strategic time zone, bridging Asian and American trading hours.
The LSE’s reputation for transparency, international participation, and regulatory integrity makes it a cornerstone of global finance.
5. Tokyo Stock Exchange (TSE)
The Tokyo Stock Exchange is Japan’s largest and Asia’s most influential exchange. Established in 1878, it is operated by the Japan Exchange Group (JPX).
Market Capitalization: Around $6 trillion.
Listed Companies: More than 3,700.
Major Index: Nikkei 225 and TOPIX (Tokyo Price Index).
The TSE has driven Japan’s post-war economic rise and continues to be a center for corporate excellence and technological innovation. Companies like Toyota, Sony, Honda, and SoftBank are major components of the exchange.
Japan’s exchange is known for its efficiency, advanced technology, and global investor participation. Its performance reflects not only Japan’s economy but also broader Asian market trends.
6. Shanghai Stock Exchange (SSE)
The Shanghai Stock Exchange, established in 1990, is one of the largest exchanges in the world and a crucial part of China’s rapidly expanding financial system.
Market Capitalization: Over $7 trillion.
Listed Companies: About 2,200.
Main Indices: SSE Composite Index and SSE 50.
The SSE is state-regulated and plays a vital role in China’s economic reforms and modernization. It lists large state-owned enterprises such as PetroChina, Industrial and Commercial Bank of China (ICBC), and China Mobile.
While foreign investor access was limited in the past, recent policy reforms have opened Chinese markets to global investors through programs like Stock Connect with Hong Kong. The SSE’s growth signifies China’s transition into a global financial superpower.
7. Hong Kong Stock Exchange (HKEX)
The Hong Kong Stock Exchange, founded in 1891, serves as a bridge between Mainland China and global investors.
Market Capitalization: Around $5 trillion.
Listed Companies: Over 2,500.
Main Index: Hang Seng Index (HSI).
HKEX has become one of the world’s leading fundraising platforms, particularly for Chinese companies seeking international exposure. It plays a strategic role by connecting Western capital with Asian corporations through its Stock Connect system with Shanghai and Shenzhen exchanges.
Its global connectivity, regulatory stability, and location make HKEX a powerful player in the global financial landscape.
8. Euronext
Euronext is a pan-European exchange, established in 2000 through the merger of exchanges in Amsterdam, Brussels, and Paris, later expanding to other European cities.
Market Capitalization: Over $7 trillion.
Listed Companies: Around 1,900.
Main Index: Euronext 100 Index.
Euronext operates in multiple countries, including France, the Netherlands, Belgium, Ireland, Portugal, and Norway. It provides a unified platform for European capital markets and promotes integration within the EU financial system. Its diversity and cross-border listings strengthen Europe’s position in the global economy.
9. Bombay Stock Exchange (BSE) and National Stock Exchange (NSE)
India hosts two major exchanges: BSE and NSE.
Bombay Stock Exchange (BSE): Established in 1875, it is Asia’s oldest stock exchange.
National Stock Exchange (NSE): Founded in 1992, it introduced electronic trading in India.
Market Capitalization: Combined over $5 trillion.
Main Indices: BSE Sensex and NSE Nifty 50.
These exchanges are key players in the emerging market landscape, attracting domestic and global investors. India’s robust regulatory framework under SEBI and its growing economy have made BSE and NSE vital centers for global investment.
10. The Role and Global Impact of Stock Exchanges
Major global stock exchanges are interconnected through technology and investor participation. Events in one market—such as policy changes, interest rate adjustments, or geopolitical crises—can cause ripple effects across others.
They influence foreign investment flows, exchange rates, and commodity prices. For instance, a market correction in the U.S. can affect investor sentiment in Europe and Asia. Similarly, innovations like cross-border listings, exchange-traded funds (ETFs), and derivative trading have deepened global financial integration.
Conclusion
The world’s major stock exchanges form the backbone of the international financial system. From the historical legacy of the NYSE and LSE to the technological dynamism of NASDAQ, TSE, and SSE, each plays a unique role in shaping global capital markets. They serve as economic indicators, facilitate investment, and foster innovation across industries.
In an era of globalization, technological transformation, and cross-border finance, these exchanges are more connected than ever—driving not just national economies but also the financial pulse of the entire world.
Screener SystemThe Gabriel Quantitative Screener Series transforms the way traders approach technical and fundamental confluence.
Each filter was designed not just to identify market opportunities but to model institutional behavior, where volume, efficiency, and volatility compression merge into repeatable, high-conviction setups.
By mastering these tools, traders can adapt dynamically across multiple environments:
From high-growth rotations and momentum squeezes to value recoveries and fundamental leadership trends.
From swing trades that capture early rotations to short-term intra-day bursts driven by liquidity spikes.
Each screener operates independently, but together they provide a panoramic framework of market rhythm and capital flow dynamics—helping you trade in harmony with institutional footprints rather than noise.
⚙️ 1. Gabriel’s TTM Squeeze—Volatility Compression and Momentum Ignition
Credit to John Carter from Simpler Trading.
Concept:
The TTM Squeeze identifies moments when volatility contracts to its tightest levels, signaling a buildup of market energy before a potential breakout. Gabriel’s version refines this principle by combining EMA structure alignment, Stochastic crossovers, liquidity thresholds, and volatility gating to isolate high-probability expansion phases.
Core Technical Framework:
EMA (8), EMA (21), EMA (34), EMA (55), and EMA (89) create a layered exponential trend structure that reveals directional stacking.
Bullish alignment: EMAs stacked upward (momentum acceleration).
Bearish alignment: EMAs inverted (momentum exhaustion).
Bollinger Bands (20) within Keltner Channels (20)—defines volatility compression and the "squeeze" zone.
Stochastic (5,3,3), (8,3.3), (14,3,3)—ensures that it's ready and primed.
ADR > 2% & ATR (14) ≥ 0.5—ensures range expansion potential.
Volume ≥ 500K—confirms institutional-grade activity.
Market Cap ≥ $2B—eliminates illiquid small caps.
How It Works:
Detects volatility contraction as BBs narrow inside KCs.
Confirms directional alignment using multi-EMA structure and R.A.F. proxy.
Screens for expansion-ready setups where energy release often follows compression.
Ideal Use Case:
Perfect for swing and intraday traders who capitalize on volatility transitions. Best applied before earnings or major news catalysts when institutional positioning drives breakout volatility.
🚦2. Gabriel’s TRW Squeeze—Trend Rotation Wave Screener
Credit to Aayush Sharma from Stock Campus.
Description:
The Gabriel’s TRW Squeeze screener identifies trend rotation wave setups using volatility compression signals combined with multi-SMA alignment. It is designed to detect the moment when price, volatility, and structure synchronize—signaling a potential momentum release after a quiet consolidation phase.
While Gabriel’s TTM Squeeze focuses on exponential momentum acceleration, the TRW Squeeze emphasizes smoothed trend strength, ideal for swing traders and portfolio rotations.
Core Framework
🔹 Moving Average Structure
SMA(9), SMA(21), SMA(50), SMA(200) define the multi-horizon trend.
Alignment of these SMAs reveals institutional rotation and trend maturity.
Bullish Bias: price above SMA(9) > SMA(21) > SMA(50) > SMA(200).
Bearish Bias: reverse order or price below all SMAs.
🔹 Volatility Compression
Bollinger Bands (20) contracting inside Keltner Channels (20) marks the volatility “squeeze.”
This condition reflects a market equilibrium about to shift—the “coiling spring” pattern.
Once Bollinger Bands expand beyond the Keltner Channel, momentum is likely to surge.
🔹 Liquidity & Volatility Filters
Market Cap ≥ 2 B USD—avoids microcaps and ensures institutional-grade volume.
Volume ≥ 500 K—screens only actively traded stocks.
ATR(14) ≥ 0.5—ensures sufficient daily range for tradeable volatility.
ADR ≤ 2%—filters excessive overnight risk.
How It Works
Compression Detection—The screener finds assets where Bollinger Bands are inside the Keltner Channel, signaling low volatility.
Trend Alignment—SMA structure confirms the directional bias of the underlying trend.
Expansion Trigger—A breakout from the squeeze with aligned SMAs marks a high-probability trend continuation or reversal wave (TRW).
⚡ 3. Gabriel’s Low Float Mover—High-Volatility Momentum Screener
Credit to Ross Cameron from Warrior Trading.
Description:
Gabriel’s Low Float Mover is engineered to detect high-momentum, low-float stocks exhibiting abnormal volume surges, strong pre-market strength, and breakout behavior. It filters for equities within the $2.5–$25 range, making it ideal for traders targeting parabolic intraday and swing moves driven by speculative rotation, news catalysts, or short squeezes.
Core Filters
⚙️ Liquidity & Market Cap
Price: $2.50–$25 Focuses on the sweet spot for retail and small-float momentum plays.
Market Cap: $300M–$2B Captures low- to mid-float tickers with enough liquidity to run but small enough to move violently on volume.
🔥 Momentum & Volume Criteria
Relative Volume ≥ 5× Ensures today’s activity is at least 5× higher than normal—confirming crowd participation or news-based rotation.
New High (1 Month) Filters for fresh breakouts or stocks reclaiming momentum from consolidation.
Pre-Market Change ≥ 2%— Detects early strength before the open, a key tell for potential runners.
⚖️ Risk Control
ADR ≥ 2% Limits overnight tracking error and ADR volatility, focusing on domestic tickers with cleaner price action.
How It Works
Identifies low-float, mid-cap stocks within the preferred retail volatility range.
Confirms momentum ignition using relative volume, recent highs, and pre-market confirmation.
Highlights tickers most likely to experience intraday breakouts, halts, or squeezes.
Use Case
Built for day traders, momentum scalpers, and swing traders who thrive in fast-moving markets. The screener surfaces potential runners before market open, allowing early preparation and pre-market watchlist building.
⚖️ 4. Gabriel’s VPC—Value-to-Price Compression Screener
Credit to Mark Minervini.
Concept:
The Value-to-Price Compression (VPC) model identifies stocks transitioning from deep value recovery to early momentum, trading between their 52-week extremes.
It captures the “middle zone” where institutional accumulation typically begins—not too oversold, not too overbought.
Core Framework:
Price ≥ 30% above 52W Low—signals strength recovery from a value base; the more the better, preferably higher than 100%.
Price ≤ 30% below 52W High—leaves headroom for continued upside; the closer to the 52-week high, the better.
SMA (50), SMA (150), and SMA (200) measure long-term compression and potential golden-cross structure.
Market Cap ≥ $300M, Volume ≥ 2M, ATR ≥ 0.5, ADR ≤ 2%—ensure clean, tradeable liquidity profiles.
How It Works:
Detects stocks recovering from lows but not yet overextended.
Confirms trend compression via SMA alignment.
Highlights candidates basing or consolidating before major continuation.
Ideal Use Case:
Best for swing and position traders aiming for sustained mid-cycle entries—the sweet spot between growth investing and technical momentum.
💹 5. Gabriel’s CANSLIM—Fundamental Growth & Institutional Leadership Screener
Credit to William O'Neil.
Description:
Gabriel’s CANSLIM identifies elite growth stocks that exhibit accelerating earnings, strong sales expansion, operational efficiency, and improving institutional interest—while still trading within 30% of their 52-week highs.
This screener merges O’Neil’s original CANSLIM principles with modern quantitative filters, designed to surface leaders emerging from consolidations with robust fundamentals and liquidity.
Core Framework
📈 C – Current Quarterly & Annual Earnings
EPS Growth (Quarterly YoY ≥ 25%)—highlights recent earnings acceleration.
EPS Growth (TTM YoY ≥ 15%)—confirms consistency across annual cycles.
Operating Margin (TTM ≥ 4.25%)—ensures profitable, scalable business models.
💰 A – Annual Earnings Growth
Revenue Growth (TTM YoY ≥ 25%)—sustained top-line expansion validates structural growth.
Net Margin (TTM ≥ 3%)—filters out low-quality revenue growth with poor conversion efficiency.
🧭 N – New Highs, Products, or Market Leadership
Price ≤ 30% below 52-week high—positions within breakout range of institutional accumulation.
ROCE (TTM ≥ 12%)—indicates strong capital efficiency and competitive advantage.
🏦 S / L / I / M – Supply, Leadership, Institutional Demand, Market Direction
Market Cap ≥ $300 M USD—ensures institutional-grade tradability.
Volume ≥ 5 M—screens for active institutional participation, the RS indicator.
Net Debt / EBITDA ≤ 17—avoids over-leveraged names that can’t scale efficiently.
ATR (14) ≥ 0.5 & ADR ≤ 2%—ensures both volatility for momentum and manageable risk.
How It Works
Filters fundamentally strong companies growing earnings and sales ≥ 20 % with efficient capital allocation.
Targets those near technical breakout zones—above institutional support but below euphoria.
Surfaces leaders capable of multi-quarter momentum continuation during strong market cycles.
💬 6. Gabriel’s Zulu Principle — Undervalued Growth with Technical Precision
Description:
Gabriel’s Zulu Principle is inspired by Jim Slater’s legendary small-cap investment philosophy — focusing on “niche growth at a reasonable price.” This screener merges the value discipline of fundamental analysis with technical alignment, surfacing emerging growth companies before institutional recognition.
It’s designed to identify small- and mid-cap stocks that are growing earnings rapidly yet remain undervalued by traditional metrics, sitting quietly in volatility contraction zones — the perfect setup for asymmetric upside.
🔥7. Stocks In Play, ORB — Opening Range Breakout Momentum Screener
Description:
“Stocks In Play, ORB” is a high-momentum liquidity screener built to identify intraday breakout candidates showing explosive activity around the Opening Range Breakout (ORB) window.
It focuses on high relative volume, strong ATR expansion, and clean volatility structure to surface equities with enough participation and range for active day trading.
This is your go-to pre-market and intraday watchlist generator for finding the tickers that matter today.
I Made $911 Trading S&P Futures | Day 65 Market BreakdownI made $911 today trading S&P Futures.
It didn’t come easy — I barely slept last night, and my overnight orders failed around 3 AM.
So I reset, stepped back, and waited for the one setup I’ve been tracking all week — the 6666 support bounce.
Here’s how it played out, and what the VX Algo system showed me before the move.
Pre-market sentiment was mixed. We had lingering shutdown headlines and low liquidity early in the session.
But structurally, the market was leaning bullish on higher timeframes — meaning any deep dip would likely get bought.
I had my eye on 6666 since last Friday as a key level.
That’s where gamma support, 5-min MOB, and prior structure all aligned — a textbook reversal zone.
When we got the VXAlgo ES X1 and NQ X3 buy signals near that level, I went long.
Used smaller sizing at first, added into strength, and locked profits using a trailing stop.
The bounce hit perfectly, and I was able to walk away green.
Even though I made money, I caught myself getting a bit greedy lately.
It’s a reminder — consistency comes from execution, not expectation.
The market will give you what it gives — your job is to wait for alignment and trade clean.
3 out of 4 signals worked today for at least 5 points each.
Tomorrow’s levels: Above 6822 bullish, below 6782 bearish.

A big kick in volatility is possibleThe large shadow on the bottom of Friday's daily chart and the S&P 500 implies the possibility of a move to the upside, if there is a resolution to the government shutdown.

ES UpdateMy 3 hr indicator worked perfectly today. MFI was oversold so I flipped all of my puts on open, then I bought calls in the afternoon. I waited a bit longer than I needed to, I wanted to confirm that MFI was moving back up which indicates that the algos are going to pump futures.
This selloff has a strange downward megaphone pattern, if we break through the purple line Monday then the selloff is over. I still expect a midweek dip when MFI gets overbought.