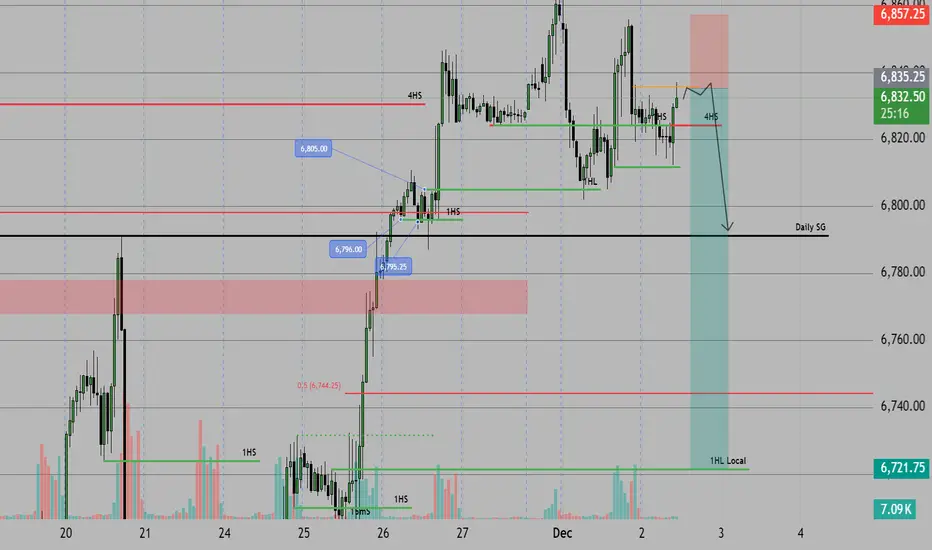
ES the big fall day ?Looking to short ES today to 6720 area.
based on yesterday movement that weren't able to make new local HOD => assuming today we will go lower .
SL close above 6855
S&P 500 E-mini Futures
No trades
Market insights
ESZ2025 Sellsi'm looking for price to start respecting that 1h.ifvg lower, then i will join in with a 5m -OB. But overall i'm bullish. this is not a financial advice

ES - 30 min SHORT term view - Trading in balance !ES - 30 min SHORT term view - Trading in balance !; Overnite trade is totally mechanical short term hands to note. let the value build for tomorrow to check in.

S&P Futures Trading Day 77 — Locking Gains in a Scary MarketEnded the day +$247.39 trading S&P Futures. I came into the session with a bullish bias thanks to the market structure, and initially, things looked great as I caught a nice move breaking over the 1-minute MOB. However, the market had some tricks up its sleeve—I got stop-hunted trying to play the breakout zone at 6828, giving back some profits. I didn't let that rattle me, though; I went long again at support off the 11:10 signal, made the money back, and hit my ~$250 goal. With how "scary" and fragile everything feels lately, I decided to just lock in the smaller gains and call it a day.
📰 News Highlights
*BITCOIN TUMBLES 5% TO $86K AMID CRYPTO SELLOFF
🔔 VX Algo Signals
9:00 AM — MES Market Structure flipped bullish (X3) ✅
11:10 AM — VXAlgo NQ X1DP Buy Signal ✅
2 out of 2 signals worked — 100% accuracy today.
🔑 Key Levels for Tomorrow
Above 6830 = Bullish Below 6800 = Bearish

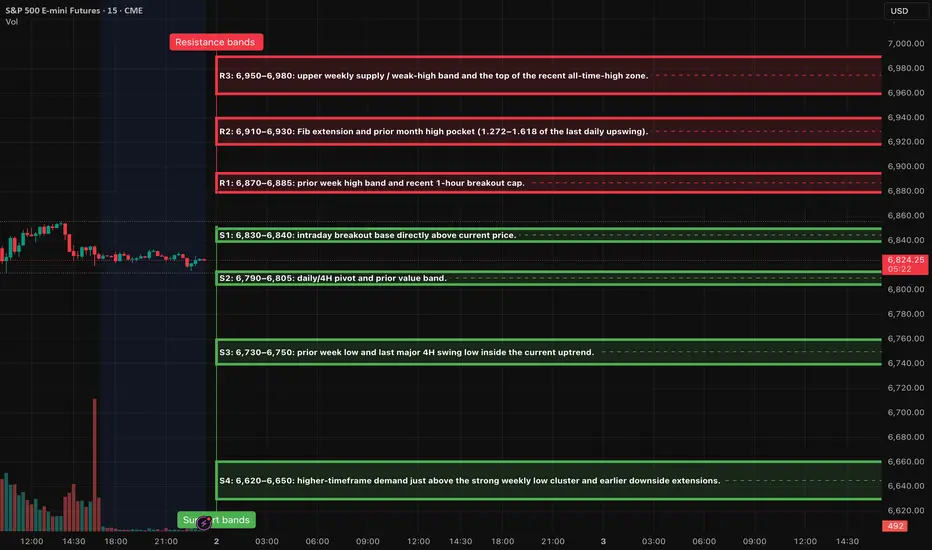
ES (SPX, SPY) Analysis, Levels, Setups for Tue (Dec 2nd)The market structure remains optimistic on the higher timeframes, bolstered by a significant rebound from the 6,520 levels. Currently, prices are fluctuating in the upper range of this move, consolidating between the intraday support and the previous weekly high. Although momentum indicators are stretched, they have yet to indicate a reversal, suggesting a potential continuation toward resistance levels R1 and possibly R2, provided that buyers can uphold the nearest support zones. Conversely, a failure to maintain support at S1 and S2 could pave the way for a deeper corrective phase targeting S3.
The levels are remain the same from yesterday analysis.
A++ SETUP 1 - LONG FROM S2 RELOAD BAND (6,790-6,805)
look for an overnight or early NY flush into 6,800 ± 10 points, followed by a strong rejection: wick below S2 on 15m, close back inside the band, plus a higher low on 5m.
Entry zone: 6,800-6,795 (inside S2 once rejection shows).
Hard stop: 6,780 (below the lower edge of S2 and recent wick structure).
TP1: 6,845-6,855 (back through S1 into the middle of the current range).
TP2: 6,870-6,885 (R1 test).
A++ SETUP 2 - SHORT LIQUIDITY SWEEP INTO R1 (6,870-6,885)
during London or NY AM, price spikes through 6,870 into the 6,870-6,885 band, takes out prior highs, but then prints a rejection: 15m candle with an upper wick and close back below about 6,875, plus a lower high on 5m.
Entry zone: 6,875-6,880 after the rejection is confirmed, not on the first blind touch.
Hard stop: 6,895 (above the top of R1; acceptance above there suggests a push toward R2).
TP1: 6,835-6,840 (back into S1).
TP2: 6,800-6,795 (retest of S2).
Key Events and Data to Watch on Tuesday
Tomorrow's U.S. session will be pivotal, focusing on key indicators of manufacturing and construction. The final S&P Global U.S. Manufacturing PMI will be released at 9:45 a.m. ET, followed closely by the ISM Manufacturing Index at 10:00 a.m. ET—both crucial for assessing factory activity and the momentum of economic growth. Concurrently, the Commerce Department will unveil October Construction Spending figures, a vital metric for understanding demand in infrastructure and housing sectors. Additionally, domestic vehicle sales data will be published, providing further insight into consumer strength.
Moreover, the OECD's latest Economic Outlook will present updated global growth projections, which could significantly influence market risk appetite. As markets remain attuned to indicators of decelerating economic activity, any surprises in these reports could lead to notable shifts between support levels (S2) and resistance levels (R1/R2), potentially reinforcing expectations for a rate cut from the Fed in December.
ES UpdateIs the melt up over? I dunno, probably staying out at least another day. Trying to avoid the whipsaw.
The problem with a melt up is that indicators won't tell you when it's gonna be over. What I can tell you is that the gap from last week filled, as expected.
I don;t think I want to go long until FDAX goes oversold anyways.


Sideways move is expectedSellers returned to the daily chart in the S&P 500 but a dramatic drop from these levels is not expected. The current expectation is an inside and only slightly lower movement in this market.

S&P 500 (ES1!): Bullish! Look For Valid Buys!Welcome back to the Weekly Forex Forecast or the week of Dec. 1-5th.
In this video, we will analyze the following FX market: S&P 500 (ES1!)
The S&P500 rallied last week, closing strong! Look for follow through going into this week.
Go with the overall bullish trend until there is a bearish market structure break.
Enjoy!
May profits be upon you.
Leave any questions or comments in the comment section.
I appreciate any feedback from my viewers!
Like and/or subscribe if you want more accurate analysis.
Thank you so much.
Disclaimer:
I do not provide personal investment advice and I am not a qualified licensed investment advisor.
All information found here, including any ideas, opinions, views, predictions, forecasts, commentaries, suggestions, expressed or implied herein, are for informational, entertainment or educational purposes only and should not be construed as personal investment advice. While the information provided is believed to be accurate, it may include errors or inaccuracies.
I will not and cannot be held liable for any actions you take as a result of anything you read here.
Conduct your own due diligence, or consult a licensed financial advisor or broker before making any and all investment decisions. Any investments, trades, speculations, or decisions made on the basis of any information found on this channel, expressed or implied herein, are committed at your own risk, financial or otherwise.

ID: 2025 - 0188.18.2025
Trade #18 of 2025 executed.
Trade entry at 140 DTE (days to expiration).
Excellent fills this morning, well under mid, and I suspect we could see SPX drop in the coming days. Typically when my fills are better than mid, these trades take some heat at the beginning. ZERO risk to the upside, no imminent danger until 6000 gets disrespected.
Working GTC orders in place.
Happy Trading!
-kevin

ID: 2025 - 0168.18.2025
Trade #16 of 2025 executed.
Trade entry at 151 DTE (days to expiration).
Excellent fills this morning, well under mid, and I suspect we could see SPX drop in the coming days. Typically when my fills are better than mid, these trades take some heat at the beginning. ZERO risk to the upside, no imminent danger until 6000 gets disrespected.
Working GTC orders for target profit of 5% ROI.
Happy Trading!
-kevin

ES LONGES long trade.
target 6900
SL close below 6790.
we have support loss at 4h and 1h but its fake as all Higher TF are bullish.
go long

Stair stepping up for the past 5 years now...1. Valuations are stretched and market is heavily concentrated
2. Economic growth is slowing, inflation remains sticky, and interest-rate risks persist
3. Macroeconomic & structural risks: debt burdens, global uncertainty, trade & policy
5. Rising probability of volatility, corrections, or a bear-market “reset”
I’m sensing a major shift happening and social media is amplifying every bit of the frustration.
Today people are more informed, more vocal, and more aware of corruption, pollution, and broken promises. What used to stay hidden now spreads instantly, creating pressure for immediate change or conflict.
Overdevelopment + environmental strain are pushing communities to the edge.
People everywhere are watching their forests disappear, farmland paved over, water quality decline, toxins and PFAS rise, and massive data centers suck up land and energy.
These aren’t distant, political issues anymore and people are waking up...
What I see coming:
Massive grassroots movements, legal upheavals, community organizing, rapid political realignment, disruptive protests, environmental activism, and a shift toward local, sustainable, practical solutions
People want control of their communities again, not top-down decisions that ignore sustainability.
What are your thoughts?

AI Stocks Weakness Could Spoil this Year’s Santa RallyAs December begins, traders worldwide are dusting off the same old question: Will we get a Santa Claus rally this year?
But 2025’s setup looks a little different. The market’s cheer seems to depend heavily on whether AI-related stocks can keep delivering miracles—and lately, the charts are suggesting they may be running out of steam.
When Tech Sneezes, the Market Catches a Cold
A quick look across U.S. equity futures shows a revealing pattern.
The E-mini NASDAQ 100 Futures (NQ), home to most AI and semiconductor giants, has posted a significantly lower monthly low compared to the prior month.
Meanwhile, the E-mini S&P 500 Futures (ES) declined much less, hinting at relative resilience, but also possible lagging weakness.
This divergence—NQ leading down while ES holds up—is a subtle warning. When the market’s growth engine (tech) loses traction, broader indices often follow with a delay. That’s the tension December traders are staring at: are we seeing the early signs of exhaustion before the holidays, or just a healthy pause?
Bearish Divergences Whisper “Caution”
The technicals are backing that cautious tone.
On the ES chart, the Commodity Channel Index (CCI) has been carving lower highs even as prices printed higher highs. This is a textbook bearish divergence, often an early sign that bullish momentum is fading.
The MACD histogram echoes the same message: momentum has been contracting through November despite new price highs, suggesting that underlying strength is eroding. Such divergences don’t predict direction on their own, but they do raise the probability of a short-term correction—or at least a choppy path into year-end.
The Price Map: Three Levels that Could Define December
Let’s outline the key technical zones traders are watching:
6,525.00: the prior monthly low—this is the first line of defense for the Santa Rally narrative. A break below this level would likely shift sentiment fast, especially if NQ continues under pressure.
6,239.50: the floor of a relevant UFO (UnFilled Orders) support zone. If ES dips below the prior low, this zone may become a “bear trap.” Many traders might short aggressively once 6,525.00 gives way, but those unfilled buy orders could absorb supply and trigger a sharp bounce. If the rally emerges from here, Santa might still make his visit.
4,430.50: a deeper UFO support cluster roughly 35% below current prices. If price were to cut through 6,239.50 and stay below it, the market would be entering a different regime altogether—likely accompanied by broken trendlines, volatility spikes, and a more defensive tone.
Reading Between the Lines: What the Divergence Means
Historically, the Santa Rally is powered by optimism, lighter volumes, and portfolio rebalancing. But this time, AI and semiconductor names—the champions of the current bull leg—are leading weakness.
That doesn’t mean doom; it means fragility.
The ES market may still rebound, but it’s doing so under reduced participation from the very sectors that drove prior gains.
Sizing the Trade Without Crossing the Line
For traders eyeing this setup through ES (E-mini S&P 500 futures) or MES (Micro E-mini S&P 500) futures, here’s a compliant, educational way to think about risk and position sizing:
Identify the Setup Zone: e.g., around 6,525.00 as potential demand, or below 6,239.50 as short-term breakdown.
Define Your Stop: the level where the technical picture is invalidated.
Set a Dollar Risk Limit: for instance, risking 1% of total account equity.
Derive Position Size: Divide your dollar risk by the price distance between entry and stop (converted into points). Then choose between the standard E-mini (ES) or Micro E-mini (MES) to match your risk tolerance and account size.
This framework lets traders adapt leverage responsibly—without needing the specific contract specs or margin figures, which vary by broker and time.
Risk Management: December Can Be a Trap
December is famous for emotional trading. The combination of holiday expectations, thinner liquidity, and year-end positioning can turn routine pullbacks into exaggerated moves.
That’s why focusing on risk before reward is critical.
The UFO support levels serve as reference zones where institutional activity might reappear, but they’re not guarantees. Managing stops, scaling out partial profits, and staying flexible matters more than trying to guess the market’s next headline.
ES and MES: Same Story, Different Scale
The Micro E-mini (MES) contract is a smaller version of the E-mini (ES), designed for traders who want the same price exposure but with lower notional size.
Both track the same index, tick for tick.
For traders exploring this December setup, the MES allows participation while controlling exposure more granularly—especially useful if volatility picks up and margin requirements shift.
Key Contracts Specs and Margins:
E-mini S&P 500 Futures (ES) with a point value = $50 per point.
Micro E-mini S&P 500 Futures (MES) with a point value = $5 per point.
As of the current date, the margin requirements for E-mini S&P 500 Futures and for the Micro E-mini S&P 500 Futures are approximately $22,400 and $2,240 per contract respectively.
Always verify the latest margin schedules and specifications directly with your broker or the exchange before entering trades, as those details update regularly and depend on market conditions.
Santa’s Setup: Scenarios to Watch
Scenario A — Santa Delivers: Price tests or slightly breaks the 6,525.00 low, finds support near 6,239.5, and rebounds into late December. Bearish divergences resolve sideways, and risk assets stabilize.
Scenario B — The Grinch Arrives: The 6,239.50 zone fails to hold, breaking trendline supports. The market slides toward 4,430.50, shaking off complacent longs and erasing part of the 2024-5 rally.
Both paths are technically valid. The difference will come from whether AI-heavy sectors regain strength—or confirm that this bull leg has indeed lost its engine.
Educational Takeaway
Divergences (CCI and MACD) highlight when momentum and price disagree—a sign of fatigue.
Intermarket analysis (ES vs. NQ) reveals where weakness may originate.
UFO levels identify potential institutional footprints—where traps or reversals often occur.
Discipline and risk control matter more than predicting whether Santa shows up.
Final Thought
Whether December brings gifts or grief may depend less on seasonal hope and more on how traders interpret these divergences.
If AI stocks can find footing again, the rally could revive. But if they keep sliding, this might be the year Santa takes a break.
When charting futures, the data provided could be delayed. Traders working with the ticker symbols discussed in this idea may prefer to use CME Group real-time data plan on TradingView: www.tradingview.com - This consideration is particularly important for shorter-term traders, whereas it may be less critical for those focused on longer-term trading strategies.
General Disclaimer:
The trade ideas presented herein are solely for illustrative purposes forming a part of a case study intended to demonstrate key principles in risk management within the context of the specific market scenarios discussed. These ideas are not to be interpreted as investment recommendations or financial advice. They do not endorse or promote any specific trading strategies, financial products, or services. The information provided is based on data believed to be reliable; however, its accuracy or completeness cannot be guaranteed. Trading in financial markets involves risks, including the potential loss of principal. Each individual should conduct their own research and consult with professional financial advisors before making any investment decisions. The author or publisher of this content bears no responsibility for any actions taken based on the information provided or for any resultant financial or other losses.

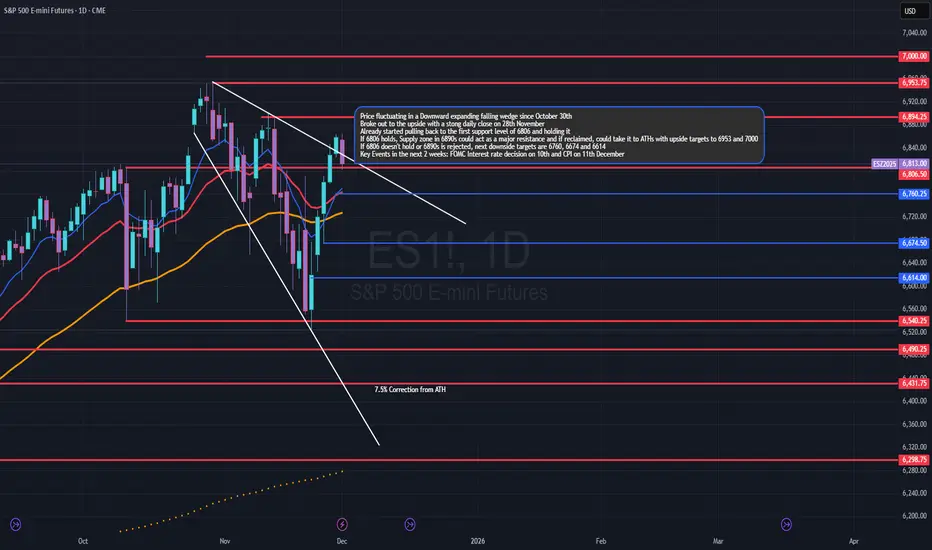
Monthly ES Futures Outlook – DecemberHappy Thanksgiving!
This is the second post in my series of monthly outlooks for ES futures. The first one, published in mid-October, covered the remainder of October and the outlook for November.
Since the end of October, price had been moving inside a downward-expanding falling wedge channel. On Friday, 28 November, ES finally broke out with a strong bullish daily close above the structure—although on lower volume due to the Thanksgiving week.
From here, two primary scenarios can unfold:
________________________________________
Scenario 1: Bullish Continuation Toward 6895+
Price remains bullish by successfully retesting the 4-hour 200 SMA (~6780) and advancing toward the next major supply zone around 6895. A few confluences support this scenario:
• The 200 SMA aligns with the 23.6% Fibonacci retracement from the 21 November low to the current swing high.
• This area also overlaps with the zone where the 10 October sell-off originated.
If this zone holds on the retest, ES could potentially push to new all-time highs by month-end, with intermediate upside targets at:
• 6894
• 6953
• 7000
________________________________________
Scenario 2: Rejection From 6890s Supply Zone
Price fails to break through the 6890s supply, rejects sharply, and continues lower—forming a third lower high below 6900.
Key downside levels under this scenario include:
• 6760
• 6674
• 6614
The major demand zone to watch is 6432 (the 7.5% correction level), which served as a strong bounce area multiple times in August and September.
________________________________________
Probability Tilt: Slight Edge to Scenario 1
From a probability standpoint, Scenario 1 currently has a slightly higher chance of playing out. Reasons:
• Price is trading above all three short-term EMAs: 9, 21, and 50.
• The 9 EMA is about to cross above the 21 EMA, a setup that historically leads more often to sideways consolidation followed by continuation to the upside, rather than a breakdown.
________________________________________
Institutional Buying Zones: Impact of % Corrections
When ES hits a new ATH and begins to retrace, certain correction percentages tend to attract institutional bids. These are typically:
• 5%
• 7.5%
• 10%
The current ATH is 6953.75, giving the following key correction levels:
• 5% correction: 6606
• 7.5% correction: 6432
• 10% correction: 6258
Recent examples support this pattern:
• The latest ATH (30 October) saw a 5% correction on 18 November, which led to a rally to 6790—about a 190-point bounce before the 20 November sell-off.
• The August 2024 low was roughly a 10% pullback from that era’s ATH.
• The December 2024 sell-off following the Fed meeting was roughly a 5% correction.
If Scenario 2 plays out, I will be watching 6432 very closely, given the confluence of the 7.5% correction and a historically strong demand zone.
________________________________________
ATR & Volatility Outlook:
For the past 9 consecutive weeks, the weekly ATR has exceeded 200 points, meaning ES has moved 200+ points on average per week.
Given that price rallied 300+ points from the 21 November low of 6525 within a single week, a period of consolidation next week is likely.
Volatility should return during the second week of December due to:
• FOMC interest rate decision — 10 December
• CPI data — 11 December
Given this macro calendar, I expect either a new ATH or a move toward 6674 within the next two weeks.
Hope this analysis helps. Open to feedback, discussion, and improvements. Happy trading.
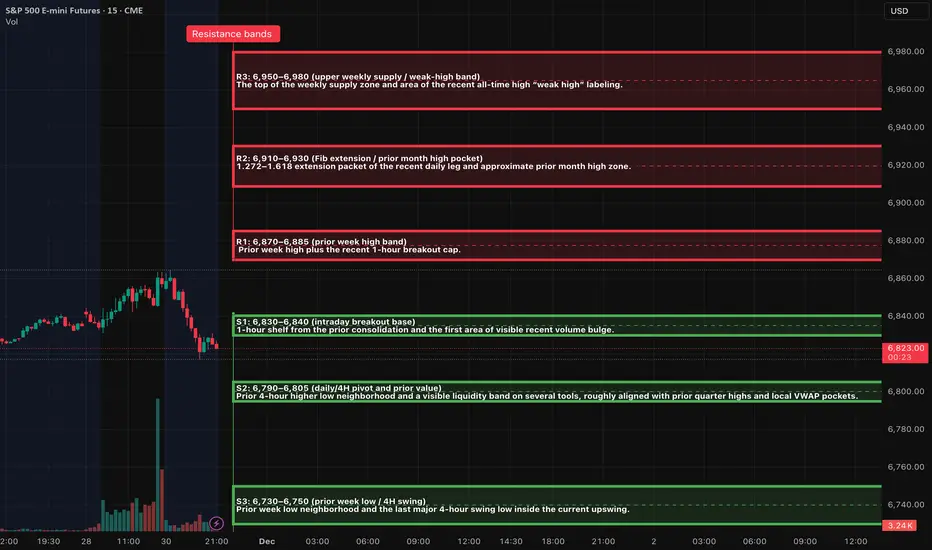
ES (SPX, SPY) Deep Analyses for Upcoming Week (Dec 1st - 5th)Multi-Timeframe Market Structure Analysis
Weekly Trend Overview
The E-mini S&P 500 (ES) continues to reflect a robust bullish trend on the weekly chart, characterized by a series of higher highs and higher lows. The most recent swing low is situated in the mid-6,500s, while prices are currently testing the previous weekly high zone around the high-6,800s, accompanied by a labeled weak high band overhead.
In terms of market positioning, prices reside firmly in the upper half of the annual range, trading within a premium supply band rather than at a discount. Momentum indicators are showing signs of a slowdown, with the weekly oscillator retreating from overbought conditions and gently sloping downward, even as prices hold near their highs. This situation exemplifies early-stage negative momentum divergence, suggesting that while the overarching trend remains intact, any upside progress is now slower and increasingly susceptible to pullbacks.
The structural bull market on the weekly timeframe is still valid, but the current price action falls into a costly zone, placing the onus on buyers to maintain upward momentum.
Daily Trend Analysis
Following a notable decline in November from the all-time high, ES established a higher low around the mid-6,500s, coinciding with a key extension bundle. Subsequently, it rebounded through the mid-6,700s, successfully reclaiming the essential daily midrange. The latest price action reflects a sequence of lower lows (LL), higher lows (HL), and a higher high, signaling a short-term bullish trend within a broader sideways pattern just beneath the recent highs.
The active daily range is delineated between 6,650 and 6,900, with current trading situated in the upper third. The daily momentum oscillator has sharply ascended from oversold territory and sits comfortably in the 60s—nearing overbought conditions but not quite there yet.
The daily trend indicates an uptrend initiated from a higher low, now testing resistance levels. Trend-following participants are positioned long, though late entrants may find themselves crowded near the upper edge of the trading range.
Four-Hour Structural Insights
The 4-hour chart reveals a strong reversal from a low around 6,525, where price structure has formed a clean stair-step of higher highs and higher lows. The latest 4-hour higher low rests in the high-6,700s. The recent impulse leg from this higher low has driven prices into the prior week's high and supply band near the high-6,800s. Observations indicate that candles are narrowing while wicks are extending, typically signaling an impending maturation of the current price leg.
While this remains largely an impulse move rather than a complete correction, the risk-to-reward ratio for entering fresh long positions at these levels appears unfavorable without a corrective pullback.
The 4-hour trend is decidedly bullish, yet this leg is maturing. A retracement toward the last observed higher low band in the high-6,700s would be both typical and healthy for the ongoing progression.
One-Hour Intraday Context
The 1-hour chart indicates a prolonged consolidation phase in the low-to-mid-6,800s, succeeded by a breakout thrust toward the prior week’s high. Recent micro-structural developments show small higher highs with diminished follow-through into the resistance zone. The emergence of upper wicks on the 1-hour candles suggests we're in the later stages of this move which originated from Friday’s New York low.
For intraday traders, entering new positions at this stage carries poor asymmetry. Strategies may involve either capitalizing on a potential exhaustion spike higher or considering buys only after a reset lower.
The intraday price leg is nearing maturity; anticipate either a minor mean reversion back into the breakout base or a final overshoot into the overhead extension band, followed by a more substantial pause.
Oscillator Insights on Weekly and Daily Timeframes
On the weekly front, the oscillator is rolling over from overbought levels, keeping prices near previous highs. While this in itself does not constitute a sell signal, it does imply that any additional advances will likely become increasingly challenging and volatile. Conversely, the daily oscillator remains robust, exhibiting positive momentum and trending upwards, although already sitting at mid-to-high levels. While there remains potential for one more uptick toward resistance, the risk of a sharp downturn looms larger should market news or flows fail to meet expectations.
Bottom Line: The primary timeframe indicators (weekly/daily) maintain a bullish outlook, while the active swings on the 4-hour and 1-hour charts are showing maturity and extension into resistance. The upcoming trading week will likely focus on navigating this late-stage upswing, either through fading exhaustion at the range's peak or by purchasing on controlled dips into well-defined demand zones.
Market Overview: Key Levels and Dynamics
Trend Boundary Analysis: 6,780 Area
The pivotal threshold for discerning between a healthy pullback and a significant trend reversal lies around the 6,780 mark. A sustained daily close below this level—specifically under S2 and near the last daily higher low—would signal a transition from what appears to be a “healthy pullback in an uptrend” to a more pronounced “daily correction.” In contrast, remaining above 6,780 allows for the interpretation of pullbacks as buyable dips into existing demand. However, should the market close below this threshold with consistent acceptance evidenced by multiple 4-hour closes and significant volume, the prevailing sentiment would shift towards anticipating a larger trading range or an early trend change.
Volatility Metrics Overview
The volatility index (VIX) closed at approximately 16.35 on Friday, a considerable drop from the mid-20s earlier in the month, indicating a low-to-moderate equity volatility regime. The options market appears relaxed rather than panicked. The VIX term structure has returned to contango, with the front month trading cheaper than the back month, supporting a risk-on environment without veering into euphoria. On the treasury front, the MOVE index remains elevated at around 69, having retreated from mid-80s spikes earlier in November, signaling that rate volatility has cooled yet remains high compared to pre-2022 standards.
The recent readings suggest that the fear that overshadowed the mid-month selloff has largely been priced out. Both equity and rate volatility have begun to mean-revert, typically favoring range trading and a more orderly trend rather than severe sell-offs. However, it’s important to note that the current state makes protective measures inexpensive, hinting that abrupt corrections could emerge unexpectedly.
Options Positioning Dynamics
The total put/call ratio is hovering around 0.70 for the latest session, suggesting a slight tilt towards puts relative to longer-term averages. The equity put/call ratio stands at about 0.44, indicating a bullish, call-heavy sentiment among traders, predominantly in single-name options. The 10-day moving average of the put/call ratio is roughly 0.92, slightly below neutral, indicating some short-term complacency, although not excessively stretched.
The SKEW index has stabilized around 143, down from the 160s a year ago but still above the traditional baseline of 120-130. This points to an inclination for tail hedging that is present but not extreme. Given the mid-teen VIX levels and a neutral total put/call ratio combined with a low equity put/call ratio, it is reasonable to deduce that dealers are likely not heavily short gamma at current spots. They may be positioned closer to long or flat gamma within the 6,750-6,900 range, which generally dampens intraday volatility and suggests a tendency toward mean-reversion. Conversely, movement outside this band—specifically above 6,950 or below 6,730—could alter the gamma positioning and pave the way for more significant directional shifts.
Market Breadth and Internal Strength
The S&P 500 concluded the week with a modest 0.5% gain on Friday, reflecting small gains throughout the month, while the Nasdaq faced a 1.5% decline, primarily driven by weakness in large technology stocks. The S&P 500 remains above both its 50-day and 200-day moving averages, having reclaimed the 50-day line last week after an earlier dip, suggesting renewed market participation beyond just a few mega-cap stocks.
Sector performance varied notably, with technology facing headwinds throughout November—most notably from AI-linked companies—while sectors such as energy, consumer cyclicals, and certain areas of healthcare and financials saw positive movements towards month-end. Despite an earlier warning from indicators like the McClellan Oscillator suggesting internal weaknesses, the recent rebound has begun to improve breadth. However, concerns linger that this rally might be more fragile than typical broad-based advances, given its rotational and choppy nature.
Credit and Funding Landscape
The high-yield index (HYG) hovers around 81, near recent highs, indicating generally favorable credit conditions as it has progressively climbed through November. High-yield spreads are tightening relative to recent standards, reinforcing a “risk-on” attitude within credit markets. There are no apparent signs of acute funding stress; previous operational disruptions in futures markets were not indicative of systemic issues.
Currently, credit markets are not signaling alarms. As long as HYG remains above approximately 79, equity dips are more likely to be viewed as buying opportunities rather than triggers for widespread liquidation.
Sentiment and Investor Positioning
In the latest AAII survey, the bull-bear spread stands at around -11%, indicating a modest bearish sentiment, with bears outnumbering bulls by approximately 11 percentage points—below the historical mean of +6%. Conversely, the low equity put/call ratio suggests that traders are actively pursuing upside positions in individual equities.
In summary, while survey data points to cautious investor sentiment, options markets illustrate a preference for call buying and a diminishment of fear. This dichotomy often results in uneven uptrends with the potential for sudden pullbacks when complacency is inevitably challenged.
Global Risk Sentiment and Cross-Asset Overview
In the cryptocurrency sector, Bitcoin has stabilized around 90-91k following a significant correction earlier in the month, with modest recovery observed in the past week. This development underscores a risk-on atmosphere among investors.
Macro and data-calendar context
• The coming week (Dec 1–5) is busy but not as pivotal as the mid-December CPI/Payrolls
• Key events:
• Monday: ISM Manufacturing and construction spending.
• Tuesday: JOLTS job openings.
• Wednesday: ADP employment and ISM Services, plus several PMI and industrial-production figures.
• Thursday: Challenger job cuts, weekly jobless claims, and trade balance.
• Friday: Critically, the delayed PCE and core PCE inflation data for September, pushed back by the recent government shutdown.
• Fed communication: The Fed is effectively entering its pre-meeting quiet period; Powell’s upcoming speech is one of the last major remarks before the December meeting.
Macro narrative: Markets are leaning heavily toward another Fed rate cut in December and a benign inflation path.  Given that, negative surprises in PCE or labor data could trigger a sharp repricing.
The late-November rally appears to be a recalibration of positioning and sentiment following a mid-month scare within the tech sector, rather than a direct response to any significant data shock. This week's major macroeconomic event is Friday's PCE report; other data releases are expected to influence intraday fluctuations rather than alter the overarching trend.
Scenario Analysis and Probabilities
These scenarios represent probabilistic outcomes rather than certainties.
Primary Path — “Controlled Grind with Dip-Buying” (Approximately 50%)
As we enter Monday, expect a modest pullback from Friday's late gains, with overnight Globex trading projected to fluctuate between 6,820 and 6,880. Early in the week, the market may test support levels S1 (6,830–6,840) or potentially S2 (6,790–6,805), ultimately leading to renewed attempts to breach resistance at R1 and possibly R2. By the week’s end, prices are anticipated to oscillate within a broad range of 6,790–6,930 ahead of Friday's PCE announcement, with only temporary moves outside this zone.
Confirmation Criteria: This path will be validated if we observe rejections below the 6,780 level holding firm on a closing basis, accompanied by repeated failures of sellers to maintain downward pressure beneath S2.
Bear-Extension Path — “Deeper Reset Before Year-End” (Approximately 30%)
This scenario is triggered by a failed breakout above R1/R2 early in the week, coupled with a significant intraday reversal and a decisive 4-hour close beneath S2 and potentially S3. Initial price action may feature a spike into the 6,910–6,930 range followed by swift sell-offs, leading to a rapid retreat back through S1 and S2, particularly if the PCE data comes in above expectations or labor statistics surprise on the upside, prompting a re-assessment of potential Fed rate cuts.
Target Area: The initial aim would be the 6,650–6,700 region (near S4), with the possibility of a complete reversal down toward the more robust 6,620–6,650 band.
Confirmation Criteria: Continuous acceptance below approximately 6,730 on a 4-hour basis, combined with a daily close under the 6,780 threshold, would indicate a return to the narrative of a higher low for November.
Bull-Surprise Path — “Breakaway Into New Highs” (Approximately 20%)
This scenario is set in motion by a clear 4-hour and subsequent daily close above R2 and R3, driven by exceptionally benign PCE numbers and a supportive stance from the Federal Reserve. Initial price action should reflect minimal pullback in the early part of the week, steadily climbing past R1 and R2, ultimately resulting in a trend day that aggressively squeezes shorts above the 6,950 mark.
Target Area: The market will likely gravitate toward the extension zone of 7,050–7,100.
Confirmation Criteria: Sustained trading above 6,930 without significant reversals, robust market breadth, and a VIX that remains comfortably anchored in the mid-teens or lower will serve as key indicators for this bullish outlook.
Two A++ setups for the week
A++ Setup 1: Rejection short from R2
Fade spike into 6,910-6,930; Entries, SL, TPs
Entry zone: 6,890–6,900 on the first clean 1-minute pullback after the 5-minute lower high.
Initial stop: Above the rejection high plus a small buffer; planning number ~6,935. That is about 35-45 points of risk if filled near 6,895-6,900; refine to the actual 15-minute wick when it forms.
TP1: 6,830-6,840 (S1 / breakout base). From a 6,895 entry, that is roughly 55–65 points, giving at least 1.3-1.5R with the conservative stop and significantly more if the wick is tighter.
TP2: 6,790-6,805 (S2 demand pocket).
TP3 (runner): 6,730-6,750 (S3), only if tape is heavy (e.g., PCE or data shock).
A++ Setup 2: Continuation long from S2
ES Long (A++) - Buy reclaim of 6,790–6,805; Entries, SL, TPs
Entry zone: 6,805-6,815 on the first 1-minute higher-low after the 5-minute confirmation.
Initial stop: A few points below the spike low; planning number ~6,780, which gives about 25–35 points of risk.
TP1: 6,870-6,885 (R1 / prior week high band). From a 6,810 entry, that is roughly 60–75 points, delivering comfortably more than 2R with the planned stop.
TP2: 6,910-6,930 (R2 extension band).
TP3 (runner): 6,950-6,980 (R3 / upper weekly supply) if PCE and flows are supportive.
Good Luck !!!
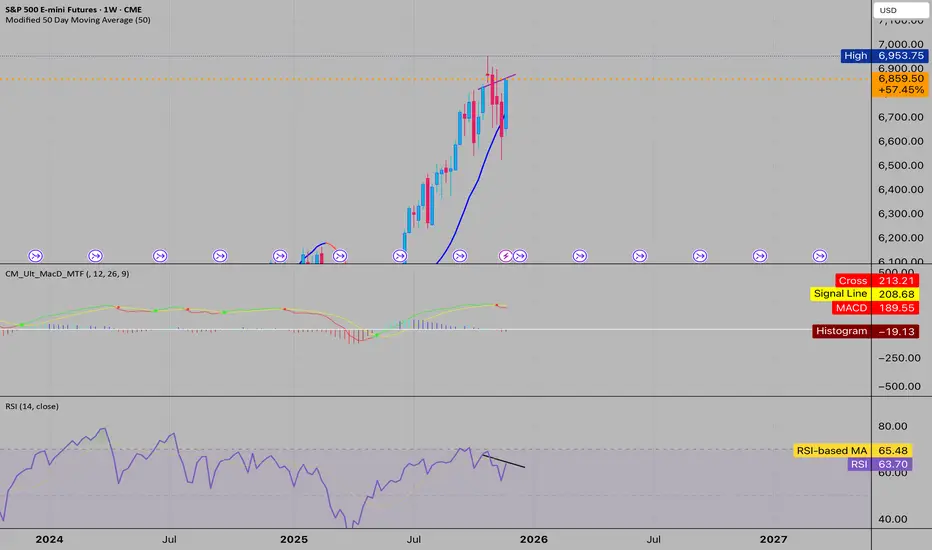
S&P 500 FuturesThe S&P 500 futures over the past month, as we predicted, tested the 6500 support level before it turning upward. Likely, it appears to be targeting its historical high around 6950. We remind that the 4th quarter and December are seasonally strong for the equity market, so, further stock market growth is expected.
Long-term trend: Up
Resistance level: 7000
Support level: 6200; 6500

The Global Trade Market Superpower1. What Defines a Global Trade Superpower?
A global trade superpower is a country (or group such as the EU) that:
✔ Dominates global exports and imports
The ability to supply goods at scale—manufactured, agricultural, technological—creates massive global impact.
✔ Controls key global supply chains
Superpowers are deeply embedded in or outright control production lines, energy routes, shipping, logistics, and commodity flows.
✔ Influences global financial systems
Trade superpowers usually have strong currencies, major stock exchanges, and banking systems that shape global capital movement.
✔ Sets global standards and rules
From trade agreements to environmental norms, superpowers shape what the world must follow.
✔ Maintains military and diplomatic dominance
Economic power is supported by defense capabilities, alliances, and diplomatic networks that protect trade interests.
Countries like the United States, China, and the European Union are prime examples of trade superpowers, while emerging economies like India, South Korea, and ASEAN nations are rapidly rising.
2. Historical Evolution of Trade Superpowers
a. Age of Exploration (1500–1800)
European powers—Portugal, Spain, Netherlands, France, and Britain—dominated global trade through:
Maritime exploration
Colonization
Monopoly control over spices, textiles, gold, and silver
This era established the foundations of global shipping routes and international markets.
b. Industrial Revolution (1800–1950)
Britain was the first global trade superpower driven by:
Mechanized manufacturing
Steamships and railways
Massive colonial markets
Later, the United States and Germany joined as industrial giants.
c. Post–World War II Era (1950–2000)
The United States emerged as the world’s leading trade superpower due to:
Dollar becoming the global reserve currency
Strong manufacturing and innovation
Control over global institutions like IMF and World Bank
Japan and Europe also became major export-driven economies.
d. Rise of China (2000–Present)
China transformed into the “Factory of the World” by:
Massive low-cost manufacturing
Export-oriented economic strategy
Investment in ports, shipping, and global infrastructure
China now rivals the United States in global trade influence.
3. Key Elements That Build a Trade Superpower
1. Industrial Capacity
Large production capability allows superpowers to dominate global markets.
China: electronics, machinery, textiles
United States: high-tech, aerospace, pharmaceuticals
EU: luxury goods, machinery, chemicals
Countries without strong industrial bases cannot gain global influence.
2. Control of Supply Chains
From microchips to crude oil, controlling supply chains decides global power.
Trade superpowers invest heavily in:
Ports and logistics
Manufacturing hubs
Rare earth minerals
Energy pipelines
Shipping fleets
For example, China’s Belt and Road Initiative strengthens its global supply chain control.
3. Strong Currency and Financial Power
A trade superpower’s currency becomes widely used in international transactions.
USD dominates global trade payments.
Euro is second in trade invoicing.
China’s yuan is expanding rapidly through global trade partnerships.
Financial power also helps these nations dictate global economic rules.
4. Technology and Innovation
Trade superpowers lead in:
Artificial intelligence
Semiconductors
Aerospace
Biotechnology
Green energy
Technology ensures long-term global competitiveness.
5. Strategic Trade Agreements
A superpower uses diplomacy to secure favorable trade networks:
Free trade agreements
Regional partnerships
Security alliances
Maritime control
The US-led alliances and China’s RCEP advantage demonstrate how diplomacy supports trade dominance.
4. Current Global Trade Superpowers
1. China
China is now the world’s largest exporter and a major importer of technology, energy, and food. Its strengths include:
Manufacturing scale unmatched globally
Strong logistics network
Belt and Road infrastructure
Dominance in rare earth minerals
Increasing influence in Asia, Africa, and Europe
China’s growth has reshaped global supply chains.
2. United States
The US remains a powerful trade superpower due to:
Dollar dominance
Technological leadership (Apple, Microsoft, Tesla, Boeing)
Agricultural exports
Strong domestic demand
Global financial and defense alliances
Even without being the largest exporter, its innovation and capital markets give it unmatched global leverage.
3. European Union
As a combined economy, the EU is a trade powerhouse:
World’s largest trading bloc
Major exporter of machinery, automobiles, pharmaceuticals
Highly regulated market influencing global standards
EU’s strength lies in quality manufacturing and a unified market.
4. Rising Powers
Countries like India, Japan, South Korea, Brazil, and ASEAN nations are gaining influence through:
Tech innovation
Young workforce
Regional trade agreements
Strategic resource control
India, for example, is becoming a major global service exporter and manufacturing hub.
5. How Trade Superpowers Influence Global Markets
a. Price Setting Power
Superpowers influence global prices of:
Oil and gas
Metals
Electronics
Food commodities
Their policies can cause global price shifts.
b. Sanctions and Trade Restrictions
Trade superpowers can impose sanctions that affect entire industries or nations.
Examples:
US sanctions disrupting global semiconductor trade
EU carbon tariffs influencing manufacturing norms
China’s export controls on rare earth elements
c. Shipping and Logistics Control
Major superpowers operate:
Key global ports
World’s largest shipping fleets
Global air cargo networks
This ensures they can move goods faster and cheaper than others.
d. Standard-Setting Power
From food safety to digital privacy, superpowers write rules the world must follow.
6. Future of Global Trade Power: Who Leads Next?
The global trade landscape is changing rapidly:
China is strong, but faces challenges like geopolitical tensions and shrinking demographics.
The United States remains influential, particularly in technology and finance.
India is the fastest-rising contender, driven by:
Rapid economic growth
Large workforce
Expanding manufacturing
Strong technology sector
India could become the next major trade superpower by 2035.
Regional blocs like ASEAN and Africa are also emerging as significant players.
Conclusion
A global trade superpower is not defined by exports alone, but by the ability to shape global markets, rules, supply chains, technology, and finance. Today, China, the United States, and the European Union dominate the trade landscape, while emerging economies like India are rapidly rising.
Global trade superpowers determine the flow of goods, capital, technology, and influence—ultimately shaping the direction of the world economy.

Weekly and Daily Bearish DivergenceSPX is starting to show the bearish divergence everyone has been anticipating. Let’s see how this plays out with Treasury tight liquidity, over night funding rates going up. I think we are going to see a Red 12/01 though the week.
OB + RSI + MSS = WIN CME_MINI:MES1!
Today, I will present a large part of my strategy using three excellent example trades. It consists of various (SMC) concepts that I have combined.
Entry:
First, I look for an OB, BB, hidden divergence or liquidity sweep on the 1-hour chart. Then I go to the 15-minute and 5-minute TF and look for further RSI divergences, SMT divergences or OBs as confirmation and wait for an MSS.
(Important for hidden divergence: only enter after confirmation and leaving the divergence zone)
Take profit:
I set my take profit depending on the situation. Either just before a liquidity pool or on the Fibonacci extension zone 1 or just before zone 1.618.
Stop loss:
I set my stop loss just behind the OB or the candles of the RSI divergence zone, whereby I must achieve a CRV of at least 3 for each trade.
Feel free to give me feedback on my system and ask me questions!
Shoutouts to @Sirc255 through who I came upon RSI!

Exchange Rates: The Pulse of Global Trade1. What Are Exchange Rates?
An exchange rate is the price at which one currency can be exchanged for another. For example, if 1 US Dollar equals 83 Indian Rupees, this rate governs how American imports from India are priced and how Indian exports to the US are valued. Exchange rates are determined by the supply and demand for currencies in the foreign exchange (Forex) market, which is the largest and most liquid financial market in the world, with daily trading exceeding $6 trillion.
2. Types of Exchange Rates
There are two main types of exchange rates:
Floating Exchange Rates: Determined by market forces of supply and demand. Most major currencies like the US Dollar (USD), Euro (EUR), and Japanese Yen (JPY) operate on this system.
Fixed or Pegged Exchange Rates: Set and maintained by governments or central banks. For example, the Hong Kong Dollar is pegged to the US Dollar within a narrow band.
Additionally, there are managed floats, where central banks intervene to stabilize currency volatility without fully fixing it.
3. How Exchange Rates Influence Global Trade
Exchange rates play a pivotal role in determining trade flows:
Export Competitiveness: A weaker domestic currency makes exports cheaper for foreign buyers. For example, if the Indian Rupee weakens against the US Dollar, Indian goods become cheaper in the US, boosting export demand.
Import Costs: Conversely, a stronger domestic currency makes imports cheaper, reducing costs for businesses reliant on foreign raw materials or technology.
Profit Margins: Multinational corporations must account for currency fluctuations in their pricing strategies. Unhedged currency risks can erode profits.
4. The Hidden Secrets Behind Exchange Rate Movements
While exchange rates are publicly quoted, the underlying forces often remain opaque to casual observers. Some key “secrets” include:
Interest Rate Differentials: Countries with higher interest rates attract foreign capital seeking better returns. This capital inflow increases demand for the domestic currency, strengthening it. Traders monitor central bank policies closely because even minor rate changes can trigger significant currency moves.
Trade Balances vs. Capital Flows: Many assume trade balances alone dictate currency value, but capital flows—investments in stocks, bonds, and real estate—often have a larger impact. For instance, even a country running a trade deficit may see its currency appreciate if foreign investors are pouring money into its financial markets.
Speculative Forces: The Forex market is dominated by large banks, hedge funds, and institutional investors. Speculators can create short-term volatility by betting on expected currency movements, sometimes disconnecting exchange rates from economic fundamentals temporarily.
Political Risk Premiums: Exchange rates embed expectations of political stability. Elections, policy changes, trade wars, or geopolitical tensions can prompt sudden currency swings. For example, uncertainty about Brexit led to dramatic fluctuations in the British Pound.
Central Bank Interventions: Some central banks actively buy or sell their currency to stabilize trade competitiveness or control inflation. These interventions are often discreet, making their influence seem almost magical to outsiders. For example, Japan’s Bank of Japan has a long history of intervening in currency markets to maintain export competitiveness.
Currency Pegging Strategies: Some nations deliberately maintain undervalued currencies to promote exports. China’s historical management of the Yuan is a classic case; by keeping the currency artificially low, Chinese exports became cheaper globally, boosting economic growth.
5. Exchange Rate Risks in Global Trade
For companies involved in cross-border trade, exchange rates are a double-edged sword:
Transaction Risk: Deals agreed upon in foreign currencies may lose value if the exchange rate moves unfavorably before payment.
Translation Risk: Multinationals converting foreign earnings back to the home currency may see profits shrink due to adverse currency movements.
Economic Risk: Long-term currency trends can affect market competitiveness and strategic planning.
Businesses often use hedging instruments such as forward contracts, options, and swaps to mitigate these risks, but hedging itself requires careful timing and analysis.
6. The Role of Exchange Rates in Trade Policies
Governments and policymakers closely monitor exchange rates as they influence trade balances, inflation, and economic growth. Some subtle but powerful strategies include:
Devaluation: Intentionally lowering a currency’s value to make exports cheaper and stimulate economic growth.
Revaluation: Increasing a currency’s value to reduce inflationary pressures from imports.
Capital Controls: Restricting foreign investment flows to prevent excessive volatility in the domestic currency.
These strategies are sometimes opaque and subject to sudden changes, making the currency markets an arena of both economic and political strategy.
7. Global Trade Patterns and Currency Movements
Currency trends often shape global trade flows in ways that are not obvious:
Commodity Prices: Commodities like oil are priced in US Dollars. Countries dependent on these imports face a hidden “currency tax” if their own currency depreciates.
Regional Trade Blocs: Exchange rates influence regional competitiveness. For instance, the Euro affects intra-European trade and external trade with non-Euro countries.
Supply Chain Costs: Multinational companies adjust sourcing and production locations based on currency trends to optimize costs.
8. Long-Term Insights
Understanding exchange rates requires more than just watching daily quotes. Savvy traders and policymakers analyze:
Purchasing Power Parity (PPP): Long-term equilibrium exchange rates based on relative price levels.
Real Effective Exchange Rate (REER): Adjusted for inflation and trade weight, giving a more realistic measure of competitiveness.
Global Reserve Currencies: US Dollar dominance impacts how other currencies behave in trade. Countries holding large dollar reserves can stabilize their exchange rates and trade flows.
9. Technology and Algorithmic Influence
Modern currency markets are heavily influenced by technology:
Algorithmic Trading: Sophisticated algorithms detect tiny market inefficiencies, executing trades within milliseconds, which can amplify short-term currency volatility.
High-Frequency Trading (HFT): Small price differentials are exploited across different exchanges globally, subtly affecting exchange rates and market liquidity.
10. Key Takeaways
Exchange rates are central to global trade, influencing prices, demand, and competitiveness.
Beyond obvious supply and demand, factors like capital flows, speculation, political stability, and central bank strategies profoundly affect currency movements.
Businesses, investors, and governments must actively manage exchange rate risks to protect profits and economic stability.
Understanding long-term fundamentals like PPP, REER, and reserve currencies helps anticipate shifts in global trade patterns.
In short, exchange rates are both a reflection and a driver of global economic dynamics. Mastering their complexities offers a competitive edge in international business and investment—often a “hidden secret” that separates average market participants from those who profit consistently in global trade.
Hey traders, it's Lord MEDZ here! In today's videoI'm excited to walk you through a fantastic trade I executed earlier on the Micro Nasdaq Futures (MNQ). Utilizing the ICT Fair Value Gap (FVG), Order Block (OB), and Market Structure Shift (MSS) strategies, I managed to achieve an impressive 11:1 risk-reward ratio within just 20 minutes, all during the New York power hour. We'll dive deep into the 15-second timeframe to break down every detail of this trade. Stay tuned to see how I leveraged these powerful tools to maximize my gains. Let's get into it!

Positive close to the monthWas a positive close for the month and the S&P 500 daily chart. This indicates that buyers are willing to hold onto their positions going into the weekend as well as month-end.
