ES (SPX, SPY) Analysis, Key-Zones, Setups for Thu (Nov 20th)Market Bias Analysis
The current short-term bias is constructively bullish, yet it remains contingent on upcoming events. Recent momentum has been bolstered by Nvidia's exceptional earnings report and a significant intraday reversal in the E-mini S&P 500 (ES). As long as the 6,670–6,680 range holds during any pullbacks, the path of least resistance appears to be upward. It is important to note that the broader daily trend is still bullish, unless we see a decisive breach below the key demand zone of 6,520–6,510 in the ES.
Market Overview
In a notable shift following a four-day decline, today's trading session exhibited a renewed bullish sentiment. The E-Mini S&P 500 (ES) printed a robust green daily candle, bouncing off a low of approximately 6,622.00 yesterday to close near 6,740.
From a technical perspective, the daily chart reveals that the recent selloff has established a lower high without breaking the prior significant higher low. The reaction low remains comfortably above the daily 1.272 extension cluster situated around 6,521.25. On the 4-hour chart, the price action has transitioned from a pattern of lower lows to a new higher low, currently pushing into the Price Quotient Median (PQM) and Price Quotient High (PQH) band, just below previous 4-hour supply levels. Observing the 1-hour chart, today's trading reflected a definitive trend day upward, characterized by a consistent series of higher lows and higher highs, culminating the session near the 1-hour 1.272 Fibonacci extension at 6,743.75.
Macroeconomic factors played a crucial role in this market turnaround, particularly after Nvidia reported stunning Q3 earnings that exceeded expectations, generating approximately $57 billion in revenue. The company’s strong AI-driven outlook and positive after-hours performance alleviated concerns that the recent downturn in technology stocks signified the onset of a broader unwinding of the AI bubble. This development contributed to a rally in index futures as the session drew to a close.
Nonetheless, the overarching theme remains one of valuation pressures and interest rate concerns. Despite breaking a four-session losing streak, market participants are poised for tomorrow’s data, which will be pivotal in shaping the Federal Reserve's policy trajectory moving forward.
Scheduled Events (Tomorrow – Thursday, Nov. 20, 2025)
Tomorrow’s docket is heavy and directly relevant for ES:
• 8:30 a.m. ET – September Employment Situation (delayed jobs report)
The September nonfarm payrolls and unemployment rate, postponed by the government shutdown, are finally released. This is the only full jobs report the Fed will have before its December meeting, and markets are treating it as a major verdict on the labour market.
• Other U.S. data (during the morning/early afternoon)
Various calendars flag building permits / housing data, regional manufacturing (e.g., Philadelphia Fed), and existing home sales clustered through the U.S. session – all secondary to the jobs report but able to add fuel if they confirm or contradict the labour story.
• Fed speakers / meetings
• Chicago Fed President Austan Goolsbee has a scheduled fireside chat around midday (12:40 p.m. ET).
• The Fed also has a closed Board meeting at 1:15 p.m. ET and a two-day Cleveland Fed financial-stability conference that can generate headlines.
Net: the jobs report is the main event; Fed comments will colour the move rather than drive it on their own.
Setups (A++ Concepts)
These are two high-conviction, rule-style ideas you can plug into your own framework. Price levels are exact from your charts.
A++ Setup 1 – Continuation Long from Value Pocket
Entry trigger concept:
Look for a sweep into the chosen band (e.g., wick into 6,690–6,695 or down into 6,663–6,668) followed by a strong 15m/5m bullish close back above 6,700. That shows buyers defending value and rejecting a deeper rotation into S3.
Risk / invalidation:
Structural invalidation if ES closes the hour below 6,652.50 (Y-POC) and cannot reclaim 6,668. In practice, a tight stop can sit just under 6,652.00 if entering from 6,690–6,705, or under 6,645.00 if using the deeper S2 pocket.
Targets:
• TP1: 6,743.75 (1H 1.272)
• TP2: 6,777.00 (1H 1.618)
• TP3: 6,813.50 (1H 2.0)
---
A++ Setup 2 – Short Fade from 1H Extension Cluster
Entry zone:
Primary sell pocket: 6,777.00–6,813.50
(1H 1.618 to 2.0 extension cluster.)
Risk / invalidation:
Structural invalidation above 6,825–6,830 (clear 1H/4H acceptance beyond the 2.0 extension).
A practical stop can sit around 6,828.00 if entering inside the band.
Targets:
• TP1: 6,743.75 (1H 1.272 / prior extension)
• TP2: 6,683.50–6,690.00 (NYPM high / S1 top)
• TP3: 6,659.00–6,664.75 (VWAP/value pocket S2)
Narrative:
If Nvidia’s beat triggers a euphoric push straight into the upper fib level but the tape immediately rejects that strength, the market is saying “good news already in the price.” This setup expresses the view that the real gravity is lower, back toward value and potentially into S3 if macro data disappoint.
S&P 500 E-mini Futures
No trades
Market insights

Momentum on the buy sideThere is by side momentum to the upside in the S&P 500 daily chart. Continuation is expected with the next objective to the upside of 6770.

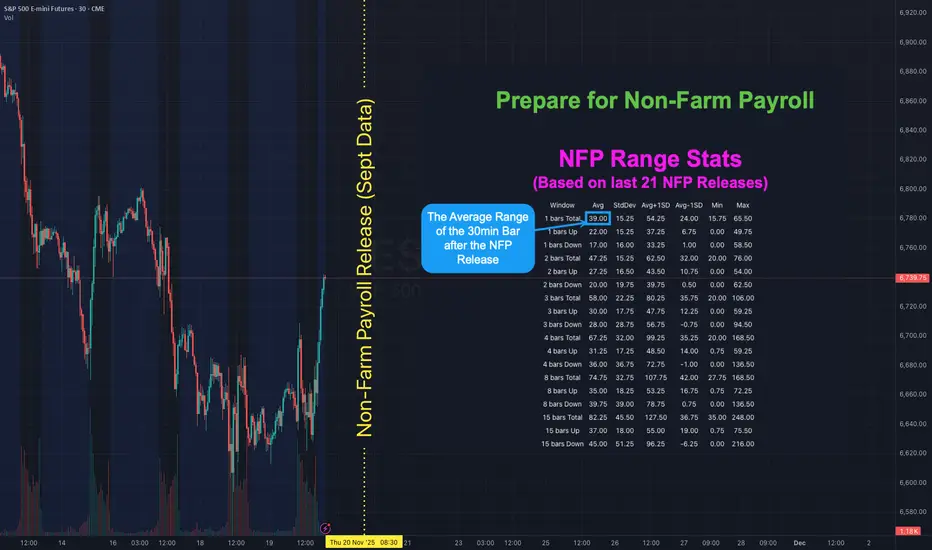
NFP is Back! Here's how to map out your playbook with statsHOW TO USE NFP RANGE STATS TO PREPARE YOUR PLAYBOOK
There has not been a Non-Farm Payroll release since Friday 5 September 2025 . Due to the government shutdown the September report that was originally set for Friday 3 October was postponed. It will finally be released on Thursday 20 November - a 48 day delay. With uncertainty around the labour data higher than usual it helps to know what “normal” looks like for ES S&P Futures. The table shows historical ranges after the 08:30 ET release on a 30-minute chart: 1 bar (30mins), 2 bars (60mins) 3 bars (90mins), 4 bars (2hrs), 8 bars (4hrs) and 15 bars (up to ~16:00 ET). The stats are based on the last 21 NFP releases (approx 2-years).
👉 If you think this would be useful as a script you can run yourself let me know (boost and drop a comment) and if there's enough interest I'll see if I can publish something.
WHAT THE COLUMNS MEAN
Avg - the typical move for that window based on past NFPs
StdDev - the variability around that average
Avg + 1 StdDev and Avg - 1 StdDev - quick upper and lower guardrails for a “normal” day
Min / Max - historical extremes in the sample
WAYS TO USE IT
1) Set guardrails for price discovery
Use Avg + 1 StdDev as a first “stretch” expectation for the window you trade. If price pushes beyond that level early you know we are outside normal and can adapt position size and expectations.
2) Pre-plan targets and emergency exits
Before 08:30 ET map a base scenario. Example for ES: if the 30m Avg post-release is X then a first take-profit can sit near X and a stretch target near Avg + 1 StdDev . Place an emergency stop beyond the Avg - 1 StdDev line if fading the first move.
3) Size positions to volatility
Translate the Avg 30m range into ticks or points and size so that a typical NFP bar does not exceed your defined risk. If your stats say the first 30m averages 9 points on ES do not run a size that cannot survive a 9-12 point swing.
4) Choose a playbook by window
1 bar (30m) - breakout or first-reaction mean-reversion
2-4 bars (60-120m) - continuation or reversal probabilities stabilise around the Avg envelope
8-15 bars - when the full session range is already at or beyond Avg + 1 StdDev be cautious chasing late moves
With the report 48 days late the probability of surprise is elevated. Go into the print with your ranges pre-mapped and your position sizing tied to those Avg and Avg ± StdDev bands. Clarity beats adrenaline.
👉 REMINDER:
If you think this would be useful as a script you can run yourself let me know (boost and drop a comment) and if there's enough interest I'll see if I can publish something.
ES UpdateQuite the pump on NVDA earnings especially considering the stock is up only 5% AH.
Appears the algos are on and pumping, so I expect to go overbought, but that depends on jobs report (Sept data) and Fed meeting minutes tomorrow.
I'm guessing we get a 3 day rally like the last pump (overlay is the early Nov pump), then the selloff resumes next Tuesday. There is a potential of a Thanksgiving holiday melt up though.
I think I'll wait until the Fed meeting minutes before deciding what to do. No positions, I dumped my GM calls this morning. Did not enter into any trades, because of NVDA, jobs report, and Fed minutes.

The Truth About Timeframe Analysis (No One Wants to Tell You)*You’re not confused because the market is chaotic.
You’re confused because your framework is garbage.*
🔥 Timeframes Don’t Lie — But Traders Do
Let’s be real:
You jump between timeframes looking for “confirmation,”
but all you’re really doing is collecting excuses.
1H looks bullish
15M looks like a breakout
4H is pulling back
5M is breaking structure in the opposite direction
Now you have five different opinions in your head
and exactly zero conviction.
You hesitate.
You enter late.
You get trapped.
You flip bias like a rookie.
This isn’t “market randomness.”
It’s simply a lack of hierarchy.
⚡ The Market Isn’t Messy. YOUR PROCESS Is Messy.
Every timeframe gives you a “mini truth.”
Without structure, you mix them together into something that feels like analysis…
but is actually noise dressed as logic.
That’s why you keep:
❌ trading micro signals against macro structure
❌ believing every candle is a reversal
❌ ignoring invalidations because you “like the setup”
❌ frying your brain before you’ve even risked a dollar
You don’t need another indicator.
You need a logic system that crushes noise and exposes REAL probabilities.
🔥 The 3 Variables (The Part Traders Think They Understand… But Don’t)
Most traders “kind of” know what trend, zones, and candles are.
And “kind of” is exactly why they lose.
In this model, each variable has a precise definition, variations, and probability weights that change depending on the context.
You’re not reacting emotionally — you’re measuring.
That’s what makes the system mechanical.
1️⃣ Trend — The Market’s Actual Intent (Not Your Guess)
Definition:
The structural direction defined by higher timeframes — not the last 3 candles on 5M.
Variations:
Strong trend
Weak/aging trend
Neutral compression
Context impact:
A strong trend entering a strong zone with a confirming candle = high probability.
A tired trend hitting a counter zone = danger.
👉 Trend isn’t “up or down.”
It’s how mature and healthy that direction is.
2️⃣ Zone — Where the Real Decisions Are Made
Definition:
Price areas that actually matter: supply, demand, break/retests, major SR.
Variations:
Fresh zone (strongest)
Retested zone (usable)
Overused zone (dead)
Context impact:
Zones inside dominant trend → continuation setups
Zones against dominant trend → only valid with strong multi-timeframe alignment
Zones broken on mid-timeframes → bias must be re-evaluated
👉 Zones aren’t lines.
They’re probability clusters.
3️⃣ Candle — The Signal That Confirms… or Invalidates Everything
Definition:
The micro-expression of intent: rejection, displacement, absorption, continuation.
Variations:
Rejection wick
Displacement/imbalance
Compression
Fake strength traps
Context impact:
A “strong candle” in a weak zone means NOTHING.
A clean rejection + structure shift inside a strong zone + aligned trend = top-tier entry.
👉 Candles are not signals by themselves.
They’re filters.
💥 The Edge Isn’t the Variables — It’s Their Alignment
Anyone can draw zones and identify candles.
Losing traders do it every day.
The real edge comes from understanding:
how each variable shifts with context
how its probability weight changes
how alignment creates high-probability setups
how misalignment warns you to STOP IMMEDIATELY
Once each variable has a precise meaning
and precise behavior inside each context…
The system becomes mechanical.
No more emotional gambling.
No more “I think this is a reversal.”
No more overthinking.
Just one rule:
If the variables align → execute.
If they don’t → wait.
📶 The Only Timeframe Hierarchy That Makes Sense
📌 High Timeframes (4H / 1H)
→ Define true market bias
→ Only overridden by strong opposite confluence
📌 Mid Timeframes (30M / 15M)
→ Confirm or challenge the bias
→ Can create valid setups if rules align
📌 Entry Timeframes (10M / 5M / 2M)
→ Execution only
→ No bias allowed here
This structure kills FOMO, kills hesitation, and kills the “I changed my mind” syndrome.
🚀 The Two Setups That Actually Pay
1️⃣ Precision Setups (Low-Risk / High-Accuracy)
1:1 to 1:2
Clean, frequent, reliable.
2️⃣ Momentum Setups (When Everything Aligns)
1:3+
Rare — but violent and highly profitable.
If you’ve ever seen the market move exactly as you forecasted…
That was confluence.
You just didn’t know how to replicate it.
💀 Stop Trading Noise. Start Trading Probability.
This model does NOT eliminate all losses.
It eliminates the avoidable, stupid ones caused by emotional reactions and inconsistent bias.
Give me 10 trades executed under true confluence,
and the results explain everything.
📣 Want Chapter 2?
I’ll break down the full confluence model and the exact rules that make it repeatable.
Follow me here on TradingView,
save this idea,
and comment “CH2” if you want the next release.
More coming soon —
but only for the people actually paying attention.
Day 73 — Perfect Rejection at the 2-Hour MOB | S&P Futures TradiEnded the day +$529.40 trading S&P Futures. Today was a solid bounce back, with the morning analysis playing out almost perfectly. I managed to catch the top of the day and ride the momentum down right as we rejected the 2-hour MOB. It felt good to be in sync with the market structure, especially with the volatility leading up to the Nvidia earnings release. The signals were clean, the execution was sharp, and it was just one of those days where the plan came together.
🔑 Key Levels for Tomorrow
Above 6725 = Bullish Below 6710 = Bearish
📰 News Highlights
NVIDIA SHARES JUMP 5% AFTER 4Q REVENUE OUTLOOK TOPS ESTIMATE

ES 4h TF, LongAlright, here’s the call. I’m expecting a retracement sooner or later.
On the 1-hour timeframe, the ideal day-trading entry has already passed, so for now, I’m anticipating the price to tap or slightly extend beyond the blue line before pulling back toward one of the yellow zones.
Now, this is where it gets interesting. Both yellow zones offer potential long setups:
The first zone aligns with the VWAP, which often acts as strong dynamic support.
The second zone sits just below a price gap, meaning the market might fill that imbalance before continuing higher.
As long as the fundamentals remain stable, I’ll be watching for confirmation to go long from either of those two areas.
If I decide to take this trade, I’ll update and specify the exact entry point — but for now, patience is key. Let’s wait for that retracement first.

ES Supply-Demand Long TradeTook a small position on buying the ES 15-minute level of demand.
Technicals = bullish/ mixed depending on outlook
Fundamentals = bullish
Sentiment = mixed
FED/News will impact this event.

ES - November 19th - Daily Trade PlanNovember 19th- Daily Trade Plan - 7:50am
*Before reading this trade plan, IF, you did not read yesterdays, or the Weekly Trade Plan take the time to read it first! (You can see both posts in the related publication section) *
If my posts provide quality information that has helped you with your trading journey. Feel free to boost it for others to find and learn, also!
My daily trade plan and real-time notes that I post are intended for myself to easily be able to go back and review my plan and how I did from an execution perspective.
--------------------------------------------------------------------------------------------------------
Quick recap of yesterday - Loss of 6635 and reclaim
We lost 6635 at the open and it was a pretty big solid red candle. We then had buyers' step in around 6603 and we had a battle between 6603-6635. We never reclaimed the 6635 level until 11:30am (15 min) candle and that was a great flush below 6603 and reclaim and that was the entry as we can see that price lost a key level (In this case it was weekly and session low) that when reclaimed rallied and you could have entered at any of the key levels above to rally into the 6684 resistance.
---------------------------------------------------------------------------------------------------------
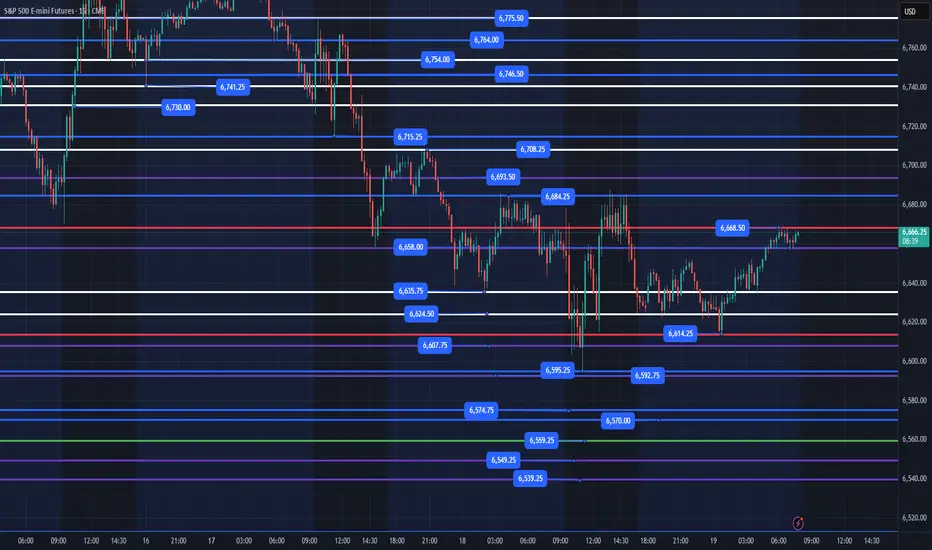
Overnight low is 6614 and overnight high is 6668. As I type this trade plan, price is coming into the 6668 level and is trying to stay above 6658. This should be pretty straightforward today.
Key Levels Today
1. 6614 - We should get one more flush and reclaim of this level before we have to retest yesterday's low at 6595.
2. 6635 - This is the Bull/Bear line in this choppy range between 6684 - 6595. IF we can lose this level and reclaim it should be good for a bounce.
3. 6607 - Any loss and recovery of this level should give us some points.
4. 6595 - Highest Quality level that a loss down to 6581 and recovery should be a good level for points.
Below there and we do not have much of interest until 6570 with 6550 & 6539 the highest quality levels to engage in.
NVIDIA earnings are out after the bell, and my general lean is that price will not do too much today and should continue to chop in this range and overnight could have a sell off down to the 6540 level and then rally and put in the weekly low tomorrow. (This is not information I am trading on, just an observation of how price could react). I will be trading only the flush and reclaim of the levels I have outlined. Remember, we have Thanksgiving next week and I would not be surprised if price tests the 6540 level by Friday and we rally end of the week as retail and sentiment becomes more bearish.
I will post an update around 10am EST
----------------------------------------------------------------------------------------------------------------
Couple of things about how I color code my levels.
1. Purple shows the weekly Low
2. Red shows the current overnight session High/Low (time of post)
3. Blue shows the previous day's session Low (also other previous day's lows)
4. Yellow Levels are levels that show support and resistance levels of interest.
5. White Levels are previous day's session High/Low
NY SESSION STRUCTURE UPDATEES continues to hold an inside-day structure, with price contained inside yesterday’s range.
This keeps the market in a balancing regime under MSM — compression, not trend.
The key level today is the inside-day break.
Until price resolves either side of the range, there is no confirmed directional intent.
The behaviour is straightforward:
– Liquidity is building at both edges
– Momentum remains muted
– No side is showing initiative
– Structure is coiling, not expanding
Operator approach:
Ignore early movement.
The valid move only appears once the inside-day resolves and behaviour confirms expansion.
— CORE5DAN
Institutional Logic. Modern Technology. Real Freedom.

S&P 500: At a Technical CrossroadsThe S&P 500 index (the S&P 500 futures contract in this analysis) is currently at a decisive technical inflection point. After several months of sustained progress since the March/April decline, prices are now retesting a key area where several dynamic supports converge: the daily Ichimoku cloud, the 50-day moving average (SMA 50) and, lower down, the 200-day moving average (SMA 200), which meets the former all-time high of 6,150 points. This confluence of indicators makes the current period a true moment of technical truth for the U.S. equity market and the GAFAM stocks.
The first element to monitor is the holding of the Ichimoku cloud on the daily timeframe, which has so far acted as a support zone during consolidations. A clear break below this structure would be significant: it would indicate the loss of medium-term bullish momentum and open the door to a deeper correction, similar to the technical scenario that occurred at the end of last February.
In the event of a breakdown, a pullback toward 6,200 points appears plausible. This corresponds to the area of the former all-time high of the S&P 500 — now a major support — and represents the most coherent technical pivot for a correction lasting several sessions. At this stage, this support has not been broken, so its breach should not be anticipated; only the daily close matters.
The current configuration is also accompanied by weakening momentum indicators: the Relative Strength Index (RSI) has been declining for several weeks, confirming a classic bearish divergence at the end of a trend.
All this occurs in a context of very high valuations for the S&P 500, with multiples leaving little room for error and making the index more vulnerable to technical adjustments. When fundamentals are stretched, chart levels play a pivotal role: a bearish technical signal can trigger a rapid realignment of prices toward more fundamentally sustainable levels.
For now, buyers remain in control as long as the price stays above the cloud and the SMA 50. But the zone being tested right now potentially represents the last line of defense before a more pronounced correction.
The market is therefore truly at a crossroads: either a valid rebound resumes the bullish trend, or a breakdown opens the way for a return toward 6,200 points, a major level for the underlying long-term uptrend.
DISCLAIMER:
This content is intended for individuals who are familiar with financial markets and instruments and is for information purposes only. The presented idea (including market commentary, market data and observations) is not a work product of any research department of Swissquote or its affiliates. This material is intended to highlight market action and does not constitute investment, legal or tax advice. If you are a retail investor or lack experience in trading complex financial products, it is advisable to seek professional advice from licensed advisor before making any financial decisions.
This content is not intended to manipulate the market or encourage any specific financial behavior.
Swissquote makes no representation or warranty as to the quality, completeness, accuracy, comprehensiveness or non-infringement of such content. The views expressed are those of the consultant and are provided for educational purposes only. Any information provided relating to a product or market should not be construed as recommending an investment strategy or transaction. Past performance is not a guarantee of future results.
Swissquote and its employees and representatives shall in no event be held liable for any damages or losses arising directly or indirectly from decisions made on the basis of this content.
The use of any third-party brands or trademarks is for information only and does not imply endorsement by Swissquote, or that the trademark owner has authorised Swissquote to promote its products or services.
Swissquote is the marketing brand for the activities of Swissquote Bank Ltd (Switzerland) regulated by FINMA, Swissquote Capital Markets Limited regulated by CySEC (Cyprus), Swissquote Bank Europe SA (Luxembourg) regulated by the CSSF, Swissquote Ltd (UK) regulated by the FCA, Swissquote Financial Services (Malta) Ltd regulated by the Malta Financial Services Authority, Swissquote MEA Ltd. (UAE) regulated by the Dubai Financial Services Authority, Swissquote Pte Ltd (Singapore) regulated by the Monetary Authority of Singapore, Swissquote Asia Limited (Hong Kong) licensed by the Hong Kong Securities and Futures Commission (SFC) and Swissquote South Africa (Pty) Ltd supervised by the FSCA.
Products and services of Swissquote are only intended for those permitted to receive them under local law.
All investments carry a degree of risk. The risk of loss in trading or holding financial instruments can be substantial. The value of financial instruments, including but not limited to stocks, bonds, cryptocurrencies, and other assets, can fluctuate both upwards and downwards. There is a significant risk of financial loss when buying, selling, holding, staking, or investing in these instruments. SQBE makes no recommendations regarding any specific investment, transaction, or the use of any particular investment strategy.
CFDs are complex instruments and come with a high risk of losing money rapidly due to leverage. The vast majority of retail client accounts suffer capital losses when trading in CFDs. You should consider whether you understand how CFDs work and whether you can afford to take the high risk of losing your money.
Digital Assets are unregulated in most countries and consumer protection rules may not apply. As highly volatile speculative investments, Digital Assets are not suitable for investors without a high-risk tolerance. Make sure you understand each Digital Asset before you trade.
Cryptocurrencies are not considered legal tender in some jurisdictions and are subject to regulatory uncertainties.
The use of Internet-based systems can involve high risks, including, but not limited to, fraud, cyber-attacks, network and communication failures, as well as identity theft and phishing attacks related to crypto-assets.

Day 72 — AI Bubble Fears Hit the Market | S&P Futures RecapStarting to get a bit worried about the stock market. Everything feels tied to NVDA earnings this week, and we’re starting to lose major support levels across multiple timeframes. I took a few losses overnight, so I went into the morning a bit more hesitant and wanted to wait until the market slowed down before committing.
I made some small profits trading off Bia's order and took a few scalp trades off the 1-minute MOB, which helped stabilize the day. This wasn’t a high-conviction environment for me, so I stayed defensive and focused on execution.
📈 Key Levels for Tomorrow
🔼 Bullish Above: 6725
🔽 Bearish Below: 6710
These are the two main pivot levels I’m watching.
Above 6725 we may see buyers regain control.
Below 6710 the bearish wave accelerates.

ES (SPX, SPY) Analyses, Key Zones, Setups for Wed (Nov 19th)Market Analysis: A Shift in Momentum for ES
In today's market, the daily chart for the E-mini S&P 500 (ES) reveals a notable shift in momentum, characterized by a sequence of price action that signals a potential downtrend. Previously, we observed a high, followed by a lower high, and today's movement has decisively broken through the last remaining support at the higher-low shelf. This change comes after a rejection from the recent lower-high zone, situated just below the 6,900 mark, followed by a retreat through the crucial 6,700 threshold. What initially appeared to be a bullish uptick is now consolidating into a corrective downswing.
Today's significant drop marks the continuation of this emerging downward trajectory. Prices breached intraday support around 6,675 to 6,700, slid past the prior higher-low region near 6,635, and ultimately settled atop the initial daily demand zone. Notably, the selling volume during this decline expanded compared to previous sessions, underscoring that this movement reflects genuine market participation rather than mere fluctuations.
While the longer-term outlook remains bullish, reflected in the weekly trend, the daily and four-hour charts currently indicate a pronounced short-term downtrend. Key indicators include the formation of a lower high, the breach of the previous higher-low, and a liquidity run to the downside toward the extension cluster. As we move forward, this developing bearish scenario suggests potential for further declines in the coming sessions, though we are positioned within local demand territory, indicating that bounces and two-directional trading are likely in the near term.
Key Resistance Zones
Resistance 1: 6,637
This level represents today’s late-session swing high on the 30-minute chart, denoted as the S-session high (S.H 6,637). It serves as the initial resistance point above the current market price.
Resistance 2: 6,679.75 – 6,687.50
A cluster of highs, with NYAM.H marked at 6,679.75, LO.H at 6,685.75, and NYPM.H at 6,687.50, forms a critical intraday supply pocket. This region represents the primary A++ short zone should the price experience a bounce.
Resistance 3: 6,700 – 6,720
Above the NY session high band, the 4-hour chart highlights a previously broken support shelf and local supply just below 6,720. Any movement back into this area would likely be corrective within the ongoing downswing unless the E-mini S&P can close and hold a daily candle above this range.
Higher-Timeframe Cap:
Any price action remaining below the recent daily lower-high zone—situated near the last significant LH before the drop—maintains a bearish bias for the larger swing. A definitive daily close above this lower-high would be necessary to negate the current short-term downtrend.
---
Key Support Zones
Support 1: 6,627.50 and 6,614.75
The AS.L level is printed at 6,627.50, with the NL.L around 6,614.75 on the 30-minute chart. Together, these levels form the initial local support shelf just beneath the current price.
Support 2: 6,606.50 – 6,603.25
Marked by NYPM.L at 6,606.50 and NYAM.L at 6,603.25, this band serves as the next area of resting liquidity from today’s trading sessions. A clean break and sustained move below this range could pave the way for the Fibonacci targets below.
Support 3 (Major Fibonacci Cluster): 6,541.50 – 6,509.00
On the 1-hour chart, the 1.272 Fibonacci level is found at 6,541.50, while the 4-hour chart places it at 6,509.00. The daily chart marks the 1.272 at 6,521.25, creating a significant demand box from approximately 6,541 down to 6,509, with 6,521 serving as a mid-pivot. This is the pivotal "bounce or break" zone.
Support 4 (Deeper Extension Pocket): 6,501.75 – 6,458.00
The 1-hour chart identifies the 1.618 Fibonacci extension at 6,501.75 and the 2.0 extension at 6,458.00. The 4-hour chart aligns the 1.618 at 6,429.25 and the 2.0 at 6,341.50, with the daily chart placing the 1.618 at 6,418.00 and the 2.0 around 6,304.00. The initial focus for tomorrow is the 6,502–6,458 region. Should the 6,541–6,509 band fail, this area becomes a strong magnet where a more pronounced short-covering bounce is likely.
The definitive structural line on the downside is the cumulative daily 1.618–2.0 cluster, ranging from approximately 6,418 down to 6,304. A decline to this range could signify a major correction leg rather than a mere shallow pullback.
A++ SETUP 1 — REJECTION SHORT FROM NY HIGH BAND
Trigger:
15m: candle wicks into 6,680–6,688 and closes back below about 6,675.
5m/1m: a failed attempt to push higher (lower high) after that rejection.
Entry:
Aggressive: enter short 6,678–6,682 after the 15m rejection close and 1m fails to make new highs.
Conservative: limit sell in 6,680–6,685 on a controlled retest from below.
Stop (hard invalidation):
Around 6,698.00 above the band and intraday highs (about 16–20 points of risk if filled 6,678–6,682).
Targets:
TP1: 6,637.00 (session swing high). From 6,680 entry with 6,698 stop ≈ 2.3R.
TP2: 6,606.50 – 6,603.25 (NYPM.L / NYAM.L shelf), ≈ 4R from 6,680 entry.
TP3: 6,541.50 – 6,521.25 (top of fib demand cluster), campaign-style extension.
A++ SETUP 2 — EXHAUSTION LONG FROM FIB CLUSTER DEMAND
Trigger:
15m: price trades below 6,530, tags 6,521–6,509, then closes back above about 6,530 (wick through, body back up).
5m/1m: a higher low forms above roughly 6,520 after that reclaim; sellers fail to push back below the cluster.
Entry:
Aggressive: 6,525–6,535 on the first higher low on 1m/5m after the 15m reclaim of 6,530.
Conservative: limit buy near 6,525 on a controlled retest into the top of the cluster after the first reaction.
Stop (hard invalidation):
Around 6,497.00 under the bottom of the cluster and recent swing low (≈ 30–38 points of risk if entered 6,525–6,535).
Targets:
TP1: 6,595–6,600 (broken structure and local VWAP zone). From 6,530 entry with 6,497 stop ≈ 2R.
TP2: 6,637.00 (S-session high and first major resistance).
TP3: 6,679.75 – 6,687.50 (NYAM.H / LO.H / NYPM.H band), where a bounce can turn into a full squeeze.
Upcoming Economic Indicators
For tomorrow's trading session (Wednesday, U.S. time), traders should keep an eye on several key economic releases:
- At 8:30 AM ET, the U.S. will release Housing Starts and Building Permits for October, along with import/export price indices. These figures are vital for gauging growth, especially after a series of subdued permits and erratic starts.
- At 10:30 AM ET, the EIA Weekly Petroleum Status Report, alongside crude inventory data, is expected to influence energy markets and broader risk sentiment.
- Later in the afternoon, markets will be attentive to FOMC minutes and remarks from New York Fed President John Williams, both of which could impact rate-cut expectations based on the overall tone relative to recent communications.
Good luck !!!

Sellers profit-taking or new buyers entering the marketThe shadow at the low of the daily price structure for Tuesday in the S&P 500 implies two possibilities sellers may have pushed the market low enough that some people are taking profits a second possibility is the market's gotten cheap enough that new buyers are establishing positions. The price action on Wednesday may give us answers depending on follow through from buyers in the market.

ES - November 18th - Daily Trade PlanNovember 18th- Daily Trade Plan - 6:30am
*Before reading this trade plan, IF, you did not read yesterdays, or the Weekly Trade Plan take the time to read it first! (You can see both posts in the related publication section) *
If my posts provide quality information that has helped you with your trading journey. Feel free to boost it for others to find and learn, also!
My daily trade plan and real-time notes that I post are intended for myself to easily be able to go back and review my plan and how I did from an execution perspective.
--------------------------------------------------------------------------------------------------------
Yesterday, we had good reactions at our key levels. Price ultimately went lower into the last hour of trading, and we got a nice, failed breakdown of 6670 that rallied into the close to finish of the day. You can review yesterday's plan and price action by viewing the post in the related publication section.
Today we have a pretty straightforward plan that I will go over below!
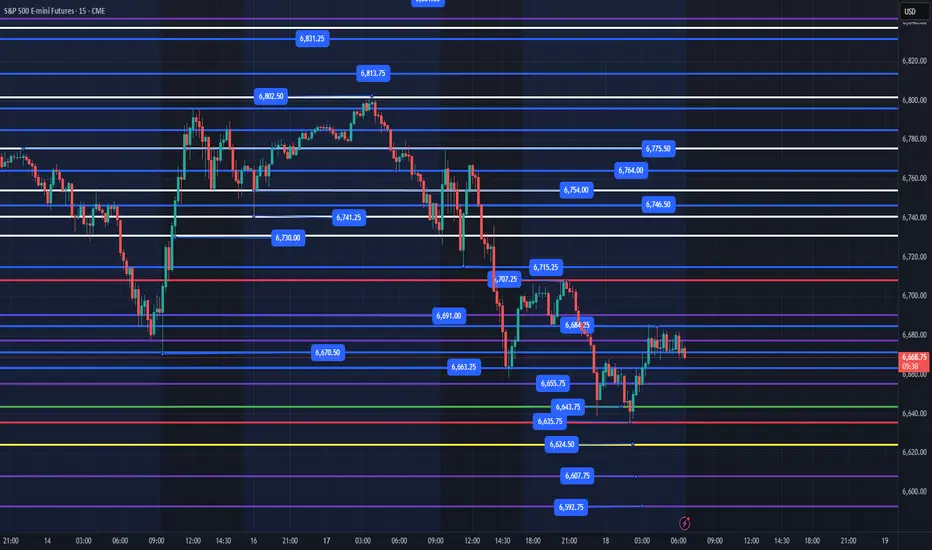
Our overnight high was 6707 (Right below our 6713 level from yesterday). Our overnight low was 6635 which we put in a nice, failed breakdown of 6643. This pattern of price losing a low, then quickly reclaiming that low is a pattern we will continue to see in a volatile and downward trending market. Price is building a really nice base between 6667 and 6684. I anticipate this will continue higher and retest the overnight high of 6707. Any reclaim of 6684 on a back test should give us a good entry or a flush of 6663 and reclaim would take us higher, also. Until price can clear 6715, price is still in a lower high, lower low trend!
Key Levels Today -
1. Loss of 6663 and reclaim
2. Loss of 6635 and reclaim
3. Reclaim of 6684 with a back test of this level for possible entry.
Below we have 6624 and some past weekly levels of 6607, 6592. These levels will be key and the flush of one of them and reclaim should keep us moving higher. The safer place to enter is to wait for it to clear the level from above, back test that level and then enter.
We have Thanksgiving next week and I would not be surprised if price tests the 6540 level by Friday and we rally end of the week as retail and sentiment becomes more bearish.
I will post an update around 10am EST
----------------------------------------------------------------------------------------------------------------
Couple of things about how I color code my levels.
1. Purple shows the weekly Low
2. Red shows the current overnight session High/Low (time of post)
3. Blue shows the previous day's session Low (also other previous day's lows)
4. Yellow Levels are levels that show support and resistance levels of interest.
5. White Levels are previous day's session High/Low
Survived a Market Selloff | +$241 Trading S&P Futures (Day 71)Ended the day +$241 trading S&P Futures, but it didn’t come easy.
The market started off range-bound, and I traded the highs and lows cleanly — up $300 by 1PM.
Then the bottom fell out, and I got caught in a false range break, watching my account swing from +300 to -500.
Thankfully, I bought at BIA’s key support zone during the late-session recovery and clawed my way back.
Today was all about staying composed when everything flips fast.
Two takeaways today:
Walk away when you say you will — extra orders can cost you.
Range days can break suddenly; keep wider stops when volatility increases.
Above 6820 is bullish, below 6782 turns bearish.
We’re seeing signs of momentum fading, so tomorrow might bring continuation or deeper retracement.

Catch its breathThe expectation for the S&P 500 daily chart on Tuesday is a market that will catch his breath. This implies an Tuesday trading inside Monday's range.

ES (SPX, SPY) Analysis, Key Zones, Setups for Tue (Nov 18th)ES experienced a notable decline, concluding the day with a sharp downturn but managed a late-session rebound off a significant demand zone. At this juncture, it appears to be a robust corrective phase within an overarching uptrend, with a reasonable probability of a bounce or a range-bound trading day ahead, barring any unexpected developments from data releases or commentary from Federal Reserve speakers.
Looking ahead to tomorrow, November 18, 2025, the economic calendar is unusually packed for a Tuesday, as various U.S. data are set to be released following delays caused by a government shutdown. Key indicators to watch that could influence ES during the New York session include the import and export price indexes for October at 8:30 AM ET, industrial production and capacity utilization figures also for October at 9:15 AM ET, and the NAHB housing market index for November at 10:00 AM ET.
Additionally, several Federal Reserve officials, including Barr, Waller, Williams, and Kashkari, are scheduled to speak throughout the day. The market is particularly attuned to their insights regarding the likelihood of another rate cut, especially in light of the recently released October FOMC minutes and this week’s jobs report.
Given the abundance of potential market-moving information, I would consider the period from 9:15 to 10:15 AM ET as a critical window for "headline risk" tomorrow.
The recent market decline can largely be attributed to macroeconomic factors:
The S&P 500 cash index ended the day down approximately 0.9%, with the Dow falling around 1.2% and the Nasdaq declining by about 0.8%. This pullback has moved the indices further away from their all-time highs established last month.
The selling pressure was particularly acute among mega-cap technology stocks and the AI sector. Major players such as Nvidia, Apple, Palantir, and AMD faced heavy trading as investors began to question whether the recent surge in tech stocks, driven by AI enthusiasm, had outpaced underlying fundamentals ahead of Nvidia’s earnings release on Wednesday.
Market sentiment was further dampened by a noteworthy prediction from Stifel's chief strategist, who suggested a potential 5% drop in the S&P 500, targeting a level around 6,350 in the coming months. This outlook was based on concerns regarding high valuations and uncertainties surrounding the Fed’s future policy as delayed economic data begins to materialize.
Interestingly, the yield on 10-year Treasuries dipped slightly towards ~4.13% , indicating that today’s selloff was more of a de-risking/profit-taking maneuver specific to equities rather than a reflection of widespread risk aversion typically signaled by bond market movements.
From a technical perspective on the ES futures:
Intraday trading patterns reflected a continuation of last week’s trend of lower highs and lower lows. Prices faltered near the 6,800–6,805 mark during the overnight session before entering a clear downtrend through the morning. The volume accelerated during the late-morning selloff, ultimately reaching a low around the 6,658–6,660 band, which coincides with established daily demand zones.
Following this drop, we observed a pronounced shift in behavior: significant buying volume surged at the lows, leading to a rejected price at that demand zone and a controlled short-covering rally back above 6,690, approaching the 6,700–6,705 range as the day closed. The Nasdaq exhibited a similar trajectory, with a heavy selloff subsequently followed by a recovery.
Structurally, today’s activity reflects:
A strong continuation of downside movement, stemming from last week’s lower-high structure and macro-driven de-risking, culminating in a liquidity flush into a previously identified demand pocket followed by short-covering toward the close.
From a broader perspective, is this the beginning of a genuine downtrend?
On the daily chart, ES remains within a larger uptrend originating from the summer lows. A higher peak above 6,900 was established in late October, with the current pullback representing a decline of approximately 3–4% from that peak. Today's trading reached the 6,650–6,670 support region, which previously served as a vital higher low space, before closing back above it. Daily momentum indicators have rolled over but are beginning to flatten, indicating they are not yet deeply oversold.
In contrast, the shorter-term 4-hour and 1-hour views present a more bearish outlook: a sequence of lower highs has formed, and the retest of prior higher low levels appears to be underway. Short-term moving averages have shifted downward, and 4-hour momentum remains negative, albeit with initial signs of a slight positive divergence compared to new price lows.
In summary:
I interpret this phase as a significant corrective downswing within a larger uptrend rather than the onset of a new bear market. The potential for a more substantial correction exists, particularly if Nvidia’s earnings disappoint or if the run of delayed economic data proves weak. However, the day's trading indicates more of a necessary adjustment rather than the onset of a catastrophic decline, aligning with institutional views that this pullback signifies a "healthy reset" following a robust advance, rather than an indication of a market bubble bursting.
Should ES close below the 6,650 mark on a daily basis and subsequently begin to print lower highs under that level, I would increase my assessment of the risk of a transition into a more enduring downtrend, with targets around the 6,350–6,400 range over the coming weeks, echoing Stifel's projections. For the time being, however, buyers continue to defend this crucial daily support zone.
Key zones to monitor for tomorrow, in the futures market:
I identify the following support zones:
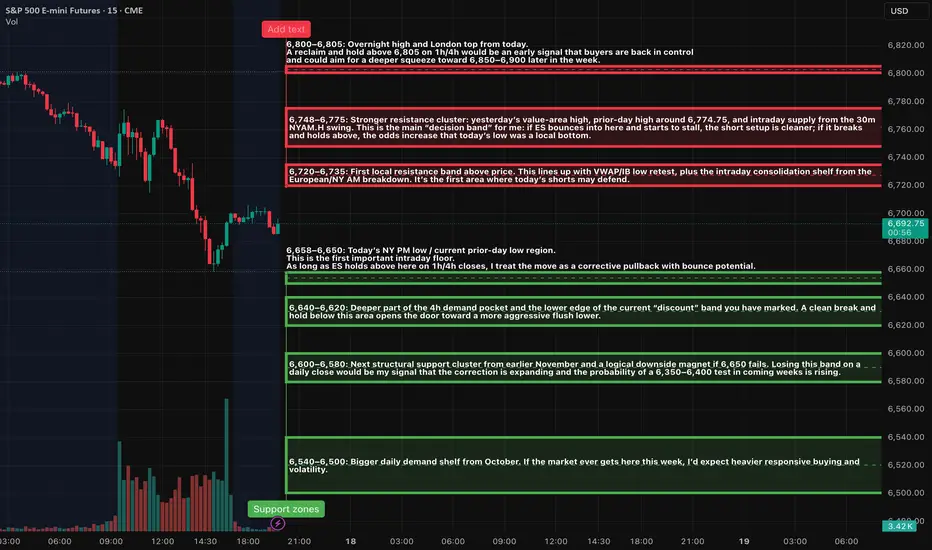
6,658–6,650: This region marks today’s New York PM low and aligns with the prior day’s low. It serves as the first critical intraday support level. As long as ES maintains closes above this area on 1-hour and 4-hour charts, I consider the movement to be a corrective phase rather than a broader downtrend.
ES UpdateI guess I was right Friday afternoon, it is a repeat of teh circled area. Expecting everything to hit oversold tomorrow.
Gap direction will depend on FDAX which is oversold and at support. If it breaks support, indicators may not work because Europe will go into a free fall.
NVDA earnings Wed AH, jobs report THU premarket, Fed minutes Thu.

ES Supply-Demand Long IdeaSee chart for analysis.
Technicals = mixed but long-term bulllish
Fundamentlas = bullish
Sentiment = mixed

ES1 - Correction Coming To An End ?ES1
Quite a bearish day across stocks and crypto with S&P Futures continuing on down from last week to make a slightly lower low.
From there it has bounced again from the 1:1 Golden Window - leaving a bullish wick.
Its very difficult to tell where an index correction ends, but this now ticks all the boxes for ratio and liqudity.
Its nicely balanced and has been ongoing for a while.
I think it moves on up soon or very soon.
If it does then this current area is the dip buy zone as reactive stocks and perhaps even crypto may begin to push up 🧐.
This analysis is shared for educational purposes only and does not constitute financial advice. Please conduct your own research before making any trading decisions.

NASDAQ BEARISHLooking at last weeks charts, I saw that it went very far up in the first few days but then plummeted, this week has seen that bear run go further down. If i had to say with NVDA earnings coming out soon, that it will be bearish overall.

S&P 500 Sell Decent zone on lower timeframe to sell. Current Month VPOC, Failure to go higher with Intraday range. Good zone to take short.
