S&P 500 E-mini Futures
No trades
Market insights

ES1 - Can A Fartcoin Predict A FOMC CorrectionThis is not a high certainty call but there are warning in lower dominance meme coins that may perhaps be signalling bearish action in the crypto that may be part of a canon to signal bearish action post FOMC.
So, a speculative call, but I have adjusted risk based on this.
This analysis is shared for educational purposes only and does not constitute financial advice. Please conduct your own research before making any trading decisions.

ES UpdateNow that futures went red, you can see ES touched oversold.
Not sure how far it needs to go oversold before we get a bounce tomorrow.

Inside dayThe structure and the daily chart for the S&P 500 implies an inside day or Friday with a slight bullish bias.

Bouncy closeThe shadow on the lows of the daily chart and the S&P 500 implies a bouncy close resulting from buyers entering the market. The challenge now will be can these buyers follow through on Wednesday. The expectation is in inside the only slightly higher movement in this market.


Cautious marketThe daily chart in the S&P 500 implies a cautious market as it awaits for additional economic reports coming out this week. The current bias for this market is to the downside. The expectation for Tuesday is an inside day.

AMP Futures - How to set alerts for Volume footprint chartsIn this idea we will demonstrate how to set alerts with Volume footprint charts.

ES - December 11th - Daily Trade PlanDecember 11th- Daily Trade Plan - 6:45am
*Before reading this trade plan, if you did not read yesterday's take the time to read it first! (You can view the posts in the related publication section) *
If my posts provide quality information that has helped you with your trading journey. Feel free to boost it for others to find and learn, also!
My daily trade plan and real-time notes that I post are intended for myself to easily be able to go back and review my plan and how I did from an execution perspective.
--------------------------------------------------------------------------------------------------------
We had an explosive Fed afternoon but ultimately have still not broken out of the range we have been for weeks. Overnight we lost nearly 100pts and I said on my late day note that price "should not lose 6885 if this is going to move higher in the overnight session". We started moving lower at the open and found a bottom at 10pm around 6817. Remember yesterday's low was 6830 and since we bounced at 6817, we built a very nice flag between 6828-6840 range. This finally broke out after the European open and is currently building another flag between 6848-6857 as I type this post. We should clear these 6857 levels and continue to back test up the levels with 6872 being a major resistance.
One key point I want to make is that the reason I typically only have 3-4 key levels to trade is because those are the levels that institutions are buying and everything in-between is noise. If you are unable to be patient for the key levels, you will lose more than you win.
6830 was yesterday's low and just like our session yesterday we got 3-4 opportunities at the 6834 level that produced some nice bounces and finally a nice move to test the 6904 top of the range. Overnight the reclaim of yesterday's low was 6830 and we held that level building a nice base for hours. This shows you the power of the key levels I have identified. 6818 was the first big level down and we bounced right at it and then reclaimed the daily low from yesterday. You can look at my chart from yesterday and see the levels and how they have been respected for over 24hrs. You can probably even look at Mondays post and see the exact same levels being respected. This is not guessing, it is understanding where institutions buy and where you need to be focused on getting points. Not all levels are the same! Focus on the Key Levels and save your capital from losing by trading between the levels!
We are currently still in an active failed breakdown with the reclaim of 6830 earlier this am. This targets price to continue up the levels with us most likely retesting 6872. If we do not get a retest of 6830, we might be able to get a flush of 6848 and a reclaim there. Outside of this I would focus on the key levels below.
Key Level Today -
1. 6848 Flush and Reclaim (Lower Quality)
2. 6830 Flush and Reclaim (High Quality)
3. 6817 Flush and Reclaim (High Quality)
4. 6801 Flush and Reclaim (High Quality)
5. 6790 Flush and Reclaim (High Quality)
IF price does flush lower, I would be patient and let price build a base at or below one of the key levels and wait for price to show that it wants to hold above that level.
I will post an update around 10am EST
----------------------------------------------------------------------------------------------------------------
Purple = A Weekly Low (Current or Previous Week)
Blue = A previous day low (Day before or day in the past week)
Red - Overnight Session High/Low (Prior to my post)
White = Key Support/Resistance Levels

ES UpdateI think ES bounces when NA hits oversold, but there is a chance that ES needs to go oversold too.
Recommend waiting until Monday to go long.

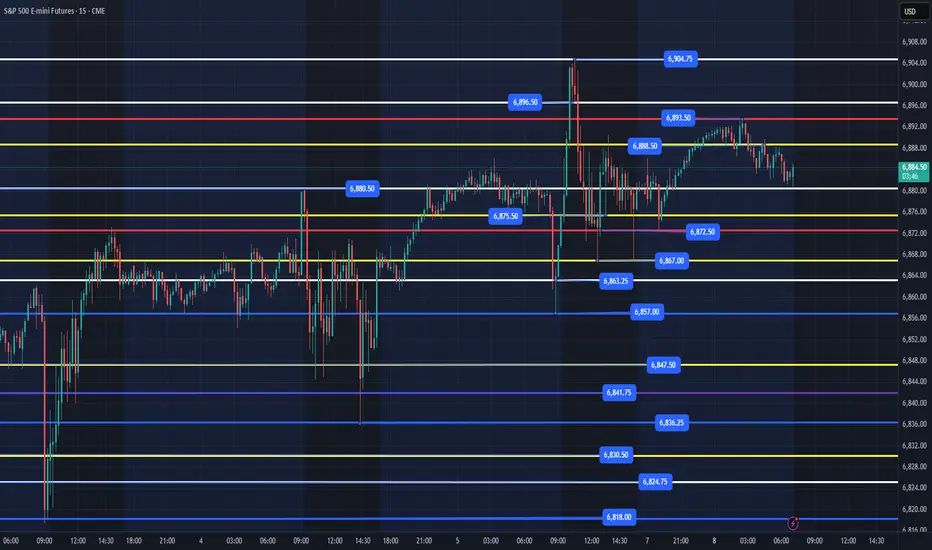
ES - December 12th - Daily Trade PlanDecember 12th- Daily Trade Plan - 6:30am
*Before reading this trade plan, if you did not read yesterday's take the time to read it first! (You can view the posts in the related publication section) *
If my posts provide quality information that has helped you with your trading journey. Feel free to boost it for others to find and learn, also!
My daily trade plan and real-time notes that I post are intended for myself to easily be able to go back and review my plan and how I did from an execution perspective.
--------------------------------------------------------------------------------------------------------
We have had a great week and while trend points to price continuing to move higher, after we have a nice move like we did yesterday, price can chop around for a day or two before continuing higher. Yesterday's overnight low was 6817 with 6830 being the big base that took us higher. 6862 was a key pivot area yesterday as moved over 100+pts on the day.
Since we finished at highs of the day and we gapped down overnight with the overnight high being 6915 and the overnight low is 6892. We will not have any of our highest quality levels unless we sell off below 6862. As I type this plan, we are currently attempting to reclaim the 6902 level, which has an overnight resistance shelf and a bull flag that looks to be building.
Ideally, we can flush 6892 (possibly down to 6885) or lose 6902 and reclaim to take us higher. Below 6885 and we will need to see price hold 6872 with 6862 being the lowest to keep us moving higher. I do think we can close the gap from the overnight session and give 6925-29 another attempt today.
I will patiently wait until the 9:30am open and see what price does in the first 5-10 mins. If price flushes and reclaims 6892 prior to the open, then I will take that level to level move. Outside of that I expect us to chop around in this range until price finds direction after the open.
Key Levels -
1. 6892 Flush and reclaim (Maybe as low as 6885)
2. 6885 Flush and reclaim (Maybe as low as 6872)
3. 6872 Flush and reclaim (Maybe as low as 6862)
I hate trading when price is close to highs and with no high-quality levels close to price. I will size down and use the levels that price gives but will be taking profits quickly at each level above.
For any new followers, that would mean that I would enter a position, sell 1/2 or 3/4 of that position at the next level up and then leave a runner to catch a couple of more levels higher.
Example - We lose 6892 down to 6885-87, I will then enter on the reclaim of 6892 and sell 3/4 at 6902 and leave a runner.
I will post an update around 10am EST
----------------------------------------------------------------------------------------------------------------
Purple = A Weekly Low (Current or Previous Week)
Blue = A previous day low (Day before or day in the past week)
Red - Overnight Session High/Low (Prior to my post)
White = Key Support/Resistance Levels

ES UpdateMFI is oversold but futures red despite FDAX melting up.
Will wait to see if RSI hits oversold, Fed meeting tomorrow/

ES (SPX, SPY) Analysis, Levels, Setups for Fri (Dec 12)CONFIRMED EVENTS - FRI 12/12 (ET)
13:00 - Baker Hughes U.S. rig count
15:30 - CFTC Commitments of Traders (COT) release (usual time)
Theme risk: liquidity headlines remain in play with the Fed starting reserve-management T-bill buying on 12/12 (not a data print, but worth respecting).
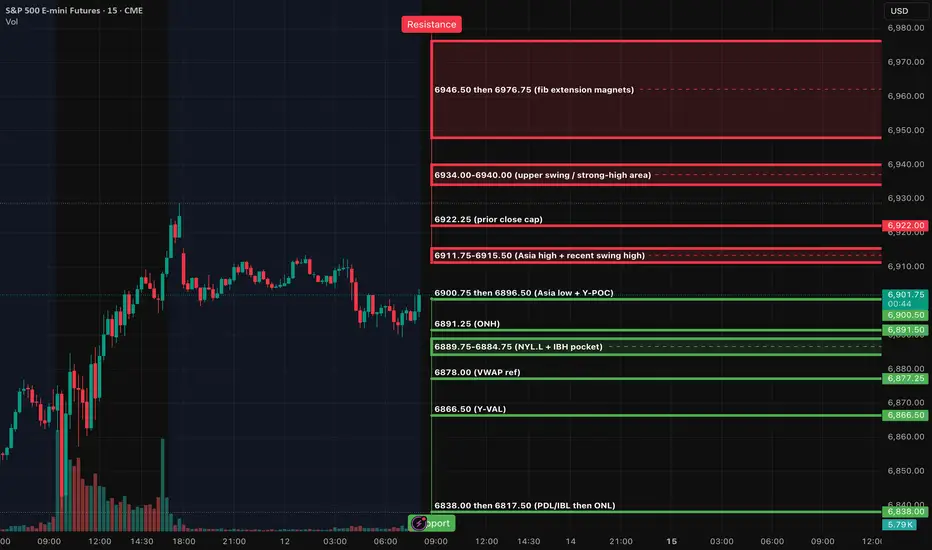
Market Analysis: Pre-Market Overview
As we approach the market open, the ES is currently positioned near the main pivot point at 6896.50 (Y-POC). Overnight trading saw a rise to the 6911.75-6912.50 range, but prices have since retraced back below a critical resistance zone at 6908.50-6909.25, which includes the year’s value area high (Y-VAH) and the previous day’s high (PDH). This dynamic suggests a cautious trading atmosphere characterized by “tight range first, trend second,” unless we witness a definitive reclaim above this resistance.
When ES gets this tight, it usually means liquidity is being packed for a pop (either direction). The trap is overtrading inside the middle of the box.
Right now the clean box is:
• Premium zone: 6900.75 then 6908.50-6909.25
• Bottom zone: 6892.00 then 6889.75
Key Resistance Levels:
- 6900.75: Asia session low
- 6908.50-6909.25: Significant resistance from Y-VAH and PDH
- 6911.75-6912.50: Upper threshold to watch
If buyers can maintain a position above 6909.25 for 15 minutes, it may set the stage for a rally towards 6922.25, aligning with prior closing levels.
Key Support Levels:
- 6892.00: London session low
- 6891.25: Overnight high
- 6884.75: Further potential support
- 6878.00: Continued downside target
- 6866.50: Year’s value area low (Y-VAL)
A decisive move below 6892.00 could trigger a morning pullback towards the 6884.75-6878.00 zone, with 6866.50 acting as a deeper support reference.
Today’s market activity will likely be influenced by developments in the semiconductor sector. Broadcom is placing pressure on the AI space due to concerns over margins, while Nvidia's outlook is being scrutinized in light of recent China-related headlines. Traders should brace for increased volatility around the 6900 and 6909 levels as movements in semiconductor stocks unfold.
The only significant intraday economic release scheduled is the Baker Hughes rig count, expected at 1:00 PM ET. Investors should also note that larger US economic data releases are anticipated next week, following a backlog caused by the recent government shutdown.
A++ SETUP 1 - REJECTION FADE (SHORT) from 6911.75-6915.50
15m pushes above 6911.75/6915.50 and closes back below 6909.25 - then 5m retest fails - then 1m first pullback gives LH.
Entry: 6909.75-6911.25
Hard SL: 6916.25 (above the rejection wick)
TP1: 6896.50
TP2: 6884.75
TP3: 6878.00
A++ SETUP 2 - ACCEPTANCE CONTINUATION (LONG) above 6922.25
15m full-body close above 6922.25 - then 5m pullback holds 6915.50-6911.75 and re-closes up - then 1m HL to enter.
Entry: 6916.00-6918.00 (on the hold)
Hard SL: 6908.25 (below the hold + back under PDH/Y-VAH area)
TP1: 6934.00
TP2: 6946.50
TP3: 6976.75
Good Luck
Rest dayAfter the S&P 500 daily chart shows the absorption of the Fed decrease in interest rates, the expectation is that Thursday could be a rest day which means it will trade basically inside the range of Wednesday.

The stage is setThe stage is set on the daily chart in the S&P 500 as the market waits for the results of Fed action. The expectation is a cut in interest rates and a rally in the S&P 500.

ES finishing a distribution schematic here?Seems to be rolling over on a distribution schematic. Right now the value appears to be in Dividend names like some of which I shared on my profile ( NYSE:NKE for example). Amongst others I'm eying are NYSE:SWK NYSE:NVO and $NESN.
Nasdaq seems to be rolling over, and so do a couple of big tech names like NASDAQ:NVDA and NASDAQ:GOOG hitting a 1.618 extension. Meanwhile small caps are shooting up. And so it looks like we are entering or at least nearing a final phase before a steeper correction.

ES UpdateThere is a small open gap from the one hour break yesterday that will eventually fill, but looks like we're just going to get more whipsaw.
I think the pump and dump algos have been shut off for now.
The next big news will be Supreme Court decision on Trump tariffs, but that may not happen until next month. Just be careful about shorting retail and manufacturers (such as auto) until then. I think the court rules against Trump and that means a lot of money paid back to a lot of companies.

A market on the sidelineThe S&P 500 daily chart structure implies a market on the sideline for Tuesday's price action. This is expected as the market gets ready for the Fed announcement on the interest rate.


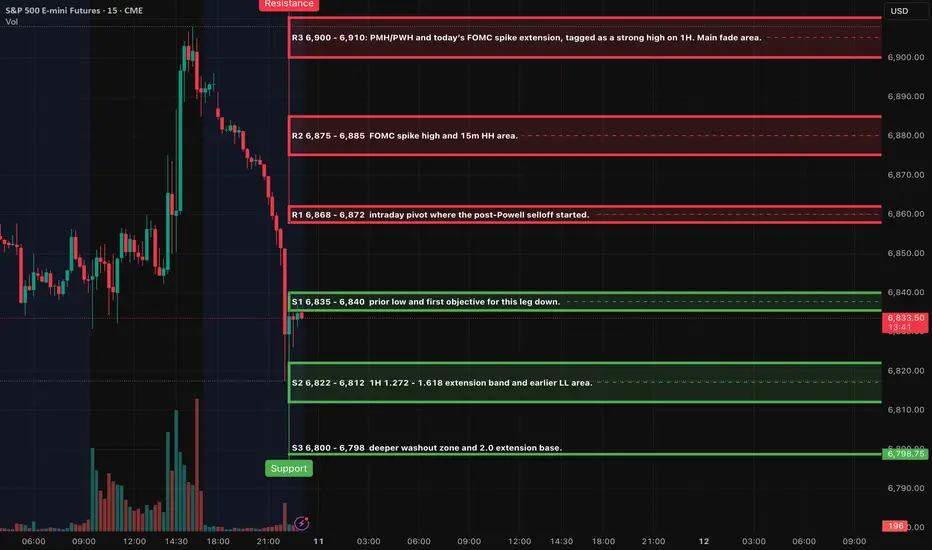
ES (SPX, SPY) Analysis, Key Levels for Thu (Dec 11th)The recent market decline has evolved into a significant liquidation wave rather than a standard pullback. Following the FOMC's interest rate cut and Jerome Powell's cautious commentary, the E-mini S&P 500 (ES) initially surged to a post-Fed high around 6,908 but then experienced a sharp reversal. The most recent four-hour candle has pushed prices below the prior higher low between 6,835 and 6,840, accompanied by increased trading volume, signaling a definitive break in the short-term market structure.
Although the broader daily trend technically remains upward, the four-hour timeframe has shifted from a consistent upward trajectory to a re-evaluation of prices within the prevailing range. The immediate focal point is now the breached support band of 6,835 to 6,845. Sustaining levels below this range suggests that sellers are firmly in control, potentially steering the market toward the one-hour extension bands around 6,820 to 6,810, and possibly deeper into the 6,800 to 6,780 range.
From a trend and structural perspective, the four-hour chart has registered a new lower low beneath the previous swing base, effectively ending the sequence of higher lows that supported the market’s advance since late November. Meanwhile, the one-hour chart indicates a downward trend characterized by a series of lower highs and lower lows, with the price approaching the 1.272 to 1.618 extension levels, approximately at 6,820 and 6,810, exhibiting strong momentum.
Unless ES can reclaim and sustain levels above the broken 6,835 to 6,845 band, the short-term outlook remains decidedly bearish.
The primary catalyst for today's market movement is clear: the Federal Reserve has opted for a modest interest rate reduction while signaling a careful, data-dependent path for future easing. Given that equity indices had been trading at elevated levels anticipating a more dovish stance, the Fed's communication has prompted a necessary recalibration. Today's trading session illustrates this shift, with both the E-mini S&P (ES) and E-mini Nasdaq (NQ) experiencing a concurrent decline, effectively erasing the gains observed following the recent FOMC meeting.
Overnight Market Forecast
As the E-mini S&P 500 (ES) continues to trade within the critical range of 6,835 to 6,845, the prevailing outlook remains bearish.
Base Case Scenario: Should the ES maintain its trajectory downward, we anticipate a gradual decline towards the S1 support level at 6,820 - 6,810. A decisive hourly close below 6,810 would bring S2 into play, targeting the 6,800 - 6,780 range. Should the selling pressure persist, the market may extend its reach into the broader 6,760 - 6,733 4-hour extension band in the coming sessions.
Conversely, if buyers successfully defend the 6,820 - 6,810 levels and tomorrow's economic data proves favorable, we are likely to see a reactionary bounce towards the 6,835 - 6,845 resistance zone. This area will become crucial: a rejection here would likely signal the onset of another leg down, while a firm reclaim and a 4-hour close above 6,845 could indicate that the recent selloff is merely part of a larger trading range, rather than signaling a complete trend reversal.
Directional Bias: In the short term, the sentiment remains bearish below the 6,835 - 6,845 range, with key downside targets at 6,820 - 6,810, followed by 6,800 - 6,780, and ultimately the 6,760 - 6,733 level.
ES - December 8th - Daily Trade PlanDecember 8th- Daily Trade Plan - 7:10am
*Before reading this trade plan, if you did not read yesterday's take the time to read it first! (You can view the posts in the related publication section) *
If my posts provide quality information that has helped you with your trading journey. Feel free to boost it for others to find and learn, also!
My daily trade plan and real-time notes that I post are intended for myself to easily be able to go back and review my plan and how I did from an execution perspective.
--------------------------------------------------------------------------------------------------------
I would go back and review Friday's trade plan and the updated notes throughout the day. It was a great day that produced some great levels for points. It started out with the flush and recovery of 6861. 6874 then became a magnet level that produced some great flushes to 6867 and reclaim of 6874. Overnight we flushed down to 6872 (Overnight Low) and reclaimed 6874 for a nice 22pt move that created the Overnight High of 6893. As of writing this post we lost a micro support at 6888 and are bouncing at 6880. Since we are in a tight range and we have FOMC on Wednesday we may continue to chop around the next 2 sessions until we get a breakout or breakdown later this week.
Key Levels Today
1. 6880 - Flush and Reclaim (lower quality)
2. 6872 - Flush and Reclaim (high quality)
3. 6867 - Flush and Reclaim (high quality)
4. 6857 - Flush and Reclaim (highest quality)
While we need to focus on the current trend (which is up) any loss of 6857 (and no quick reclaim) would change the structure of the trend. Price needs to clear 6904 to create higher highs.
Below these levels and price will most likely be selling off and I would be getting out the way and let price find a level below to reclaim and move higher.
I will post an update around 10am EST
----------------------------------------------------------------------------------------------------------------
Couple of things about how I color code my levels.
1. Purple shows a current or prior weekly low
2. Red shows the current overnight session High/Low (time of post)
3. Blue shows the previous day's session Low (also other previous day's lows)
4. Yellow shows core support/resistance levels
5. White shows overhead resistance/targets
Master Correlation StrategiesTurning Market Relationships into Consistent Trading Edges
Correlation strategies are among the most powerful yet misunderstood tools in trading and investing. While many market participants focus only on price direction, correlation-based traders focus on relationships—how assets move relative to one another. When mastered, correlation strategies help traders reduce risk, improve timing, identify hidden opportunities, and trade with greater confidence across equities, commodities, currencies, bonds, and indices.
This guide explores the concept of correlation, its types, practical applications, advanced strategies, common mistakes, and how professional traders use correlation to gain a sustainable edge.
Understanding Correlation in Financial Markets
Correlation measures the degree to which two assets move in relation to each other. It ranges from +1 to -1:
Positive correlation (+1 to +0.5): Assets move in the same direction
Negative correlation (-1 to -0.5): Assets move in opposite directions
Zero or low correlation: No consistent relationship
For example:
Crude oil and energy stocks often show positive correlation
Gold and the US dollar often show negative correlation
Equity indices within the same country tend to be highly correlated
Correlation is not static. It changes over time due to economic cycles, liquidity conditions, policy decisions, and market sentiment. Master traders continuously monitor and adapt to these shifts.
Why Correlation Strategies Matter
Most traders lose money not because they are wrong on direction, but because they unknowingly take overlapping risk. Buying multiple highly correlated assets is essentially placing the same trade multiple times.
Correlation strategies help in:
Avoiding hidden overexposure
Improving portfolio diversification
Identifying early signals before price moves
Trading relative value instead of pure direction
Managing drawdowns during volatile markets
Professional traders think in terms of risk clusters, not individual trades—and correlation is the foundation of this thinking.
Types of Correlation Strategies
1. Intermarket Correlation Strategy
This strategy studies relationships between different asset classes such as equities, commodities, bonds, and currencies.
Examples:
Rising bond yields often pressure equity valuations
Strong US dollar impacts gold, crude oil, and emerging markets
Equity market weakness can drive capital into bonds or gold
By tracking one market, traders anticipate moves in another before they occur.
2. Pair Trading and Relative Strength Strategy
Pair trading involves taking long and short positions in two correlated assets, betting on the spread between them rather than market direction.
Example:
Long Stock A, Short Stock B when historical correlation breaks temporarily
Long outperformer, short underperformer within the same sector
This strategy works well in sideways or volatile markets and reduces market risk.
3. Sector Correlation Strategy
Stocks within the same sector often move together due to shared fundamentals.
Examples:
Banking stocks correlated with interest rate expectations
IT stocks correlated with currency movements
Metal stocks correlated with global commodity prices
Traders use sector correlation to confirm breakouts or detect false moves.
4. Index-to-Stock Correlation Strategy
Large-cap stocks heavily influence indices. When an index moves without participation from key stocks, the move may lack strength.
Examples:
NIFTY rising while major banking stocks lag
Index breaking resistance but heavyweight stocks failing
This divergence often signals upcoming reversals or consolidation.
5. Lead–Lag Correlation Strategy
Some assets move before others, acting as early indicators.
Examples:
Dow Jones leading global equity sentiment
US bond yields leading equity rotations
Copper leading economic growth expectations
Identifying leaders allows traders to position early with better risk-reward.
Correlation in Risk Management
Correlation is a risk control tool, not just a trade setup.
Key applications:
Avoid taking multiple trades with the same directional exposure
Balance portfolios with negatively correlated assets
Reduce drawdowns during market crashes
Allocate capital more efficiently
A portfolio with five uncorrelated trades is safer than ten correlated trades.
Correlation vs Causation: A Critical Distinction
One of the biggest mistakes traders make is assuming correlation means causation. Just because two assets move together does not mean one causes the other to move.
Correlation strategies must be combined with:
Fundamental context
Macro environment
Liquidity conditions
Technical confirmation
Without context, correlation signals can become misleading.
Advanced Correlation Techniques Used by Professionals
Rolling Correlation
Instead of static correlation, professionals use rolling correlation to track how relationships evolve over time.
Benefits:
Detects breakdowns early
Adapts to changing market regimes
Avoids outdated assumptions
Regime-Based Correlation
Correlations behave differently in:
Risk-on markets
Risk-off markets
Inflationary cycles
Recessionary phases
For example, during market crashes, correlations often increase as everything sells off together.
Volatility-Adjusted Correlation
During high volatility, correlations spike artificially. Adjusting for volatility prevents false signals and improves decision-making.
Common Mistakes in Correlation Trading
Treating correlation as permanent
Ignoring macro and policy shifts
Over-leveraging correlated positions
Using correlation alone without price action
Not updating correlation data regularly
Correlation strategies reward discipline and continuous observation.
How to Build a Master Correlation Trading Framework
Identify core assets you trade
Track historical and rolling correlations
Understand macro drivers behind relationships
Use correlation as confirmation, not prediction
Control position sizing across correlated trades
Reassess correlations during major events
Mastery comes from repetition, review, and adaptability.
Psychological Edge of Correlation Strategies
Correlation trading reduces emotional decision-making. Instead of reacting to noise, traders rely on structure and relationships.
Benefits include:
Increased confidence during volatility
Fewer impulsive trades
Better patience and discipline
Clearer risk assessment
Professional traders don’t chase moves—they wait for correlation alignment.
Conclusion: Correlation as a Market Language
Markets speak through relationships. Price is only one word in the sentence—correlation completes the meaning. Traders who master correlation strategies stop guessing and start interpreting the market.
By understanding how assets interact, lead, lag, diverge, and converge, correlation traders operate one step ahead of the crowd. In an era of global interconnected markets, correlation mastery is no longer optional—it is essential for long-term trading success.

Maybe range-bound on Friday In my view, the market is likely to be range-bound on Friday, as it is currently consolidating within a potential triangle pattern and continues to oscillate inside this formation.
For swing traders, this is not an ideal time to enter trades. Instead, it is advisable to wait for a breakout before determining the future trend direction.
Given that the recent support and resistance levels have proven to be reliable and effective in multiple tests, even if the price breaks out of the triangle zone, it may still encounter resistance and pull back, or hit support and rebound subsequently.
