Can sellers maintain control going into the weekendSellers dominated the daily chart of the S&P 500. The issue now is can these sellers maintain downward momentum going into the weekend. I do not expect another large day down on Friday but rather a smaller range day that basically traits within and a little below Thursday's daily range.
Trade ideas

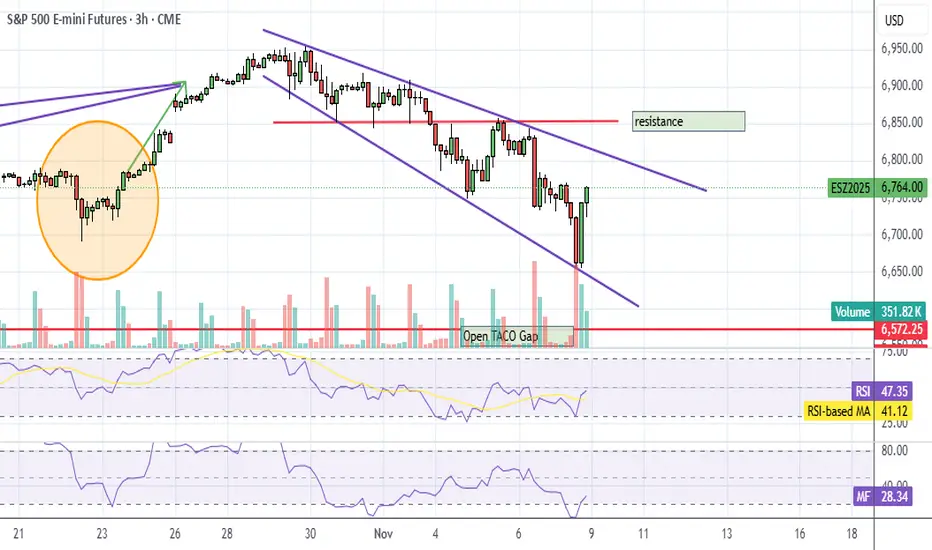
What's going on for ES at the 6,875 price level?Hey Trading Fam 👋,
Hope everyone’s been crushing it lately! 💪
Time for a quick mid-week review of the ES price action — and wow, there’s a lot going on around that 6,875 level 👀
Yes, the market’s been bullish over the past month (with a few healthy pullbacks), but the big question now is:
Can we keep climbing higher, or is momentum running out?
Walk with me as we break down the recent price moves, key levels to watch, and what I’m expecting heading into the next New York session.
Let’s dive in! 🚀📈

AQUant price leap tradingAQUant price leap trading
#aqunat_price
#aqunat_price
#aqunat_price
#aqunat_price
#aqunat_price
#aqunat_price
#aqunat_price
#aqunat_price#aqunat_price
#aqunat_price
#aqunat_price
v
#aqunat_price
#aqunat_price
#aqunat_price#aqunat_price
#aqunat_price
#aqunat_price
#aqunat_price
#aqunat_price
#aqunat_price
v
#aqunat_price

quick short then to NHdoji 1H, quick short then back to the top or maybe new highs.... keeping it simplee !!

Leap competition - The notional trade value for 1 contract Dear Traders,
Once again, we can measure where we are, how sharp we are in the market, and we can do this in a fun way. Participation is more important than the result, since this won’t be the last time we compete — and if we train, we have a chance to be better than before, especially if we analyze our mistakes after the competition.
As in every game, it’s important to know the rules and the values of different cards; therefore, I made a quick bar chart for you guys related to the allowed instruments in the current LEAP competition — notional values which can determine the size of your gains and losses.
The notional trade value for 1 contract of each. I used the official contract multipliers.
imgur.com

Futures electronic hoursFutures electronic hours
💡 This idea focuses on trading futures during the electronic trading hours — the periods outside the regular cash session, where unique price behavior often occurs due to lower liquidity and algorithmic dominance.
📊 Core Strategy:
During electronic hours (typically post-market/pre-market), futures like ES, NQ, or CL often show sharp moves driven by global macro news, low-volume liquidity zones, or overnight positioning. These moves can offer high-probability setups when combined with key levels from the regular session.

A shift away from tech stocksThe price action in the daily chart of the S&P 500 implies a potential shift away from tech stocks. Capital is still in the stock sector the structure implies this potential capital shift.

ETF ScannerGabriel’s ETF — Institutional Performance & Efficiency Screener
Description:
Gabriel’s ETF screener isolates high-efficiency, institutional-grade exchange-traded funds (ETFs) that combine superior long-term performance with low structural drag.
It’s designed to uncover funds that outperform peers through strong 5-year returns, consistent NAV growth, low expense ratios, and disciplined yield management — essentially finding the “alpha carriers” of the ETF world.
This screener serves as both a portfolio foundation builder and a benchmark comparison tool for systematic investors, portfolio managers, and capital allocators.
Scanner: www.tradingview.com
⚙️ Interpretation: Strategy Intent
The set is effectively constructing a “Quality Growth + Liquidity + Efficiency” model, targeting:
Consistent long-term compounding (≥ 30 % 5Y Perf)
Healthy recent trend (≥ 10 % 1Y NAV Return)
Low-cost structure (≤ 0.4 %)
Institutional-grade liquidity (≥ 2 B AUM + ≥ 900 M USD volume)
Dividend reliability (≥ 0.45 %)
Moderate volatility (ADR < 1.55 %)
This combination favors stable, mega-cap ETFs suitable for core allocation portfolios or All-Weather ETF models.
📊 Expected Results
With these filters, your screener will likely highlight ETFs such as:
SPY / VOO / IVV – Core S&P 500 index trackers with large AUM, strong 5-year performance, low fees.
QQQ / VGT / XLK – Tech-heavy growth ETFs with > 30 % 5-year gains.
SCHD / VYM / HDV – Dividend-weighted funds meeting your minimum yield and efficiency filter.
XLF / XLI / XLE / XLV / XLK – Sector ETFs with institutional liquidity.
IWF / IWD / RSP – Style-based or equal-weight funds passing both momentum and liquidity screens.

ES 4h TF, LongAlright, here’s the call. I’m expecting a retracement sooner or later.
On the 1-hour timeframe, the ideal day-trading entry has already passed, so for now, I’m anticipating the price to tap or slightly extend beyond the blue line before pulling back toward one of the yellow zones.
Now, this is where it gets interesting. Both yellow zones offer potential long setups:
The first zone aligns with the VWAP, which often acts as strong dynamic support.
The second zone sits just below a price gap, meaning the market might fill that imbalance before continuing higher.
As long as the fundamentals remain stable, I’ll be watching for confirmation to go long from either of those two areas.
If I decide to take this trade, I’ll update and specify the exact entry point — but for now, patience is key. Let’s wait for that retracement first.

Long ESLong ES, try to time the entry and you should get a good RR.
Also cut your position in half if the price touches the blue line.
If you have a spesific request about certain instrument that you want me to analyize, just let me know.
Goodluck everyone!!

Amy5 min for set up and one minute for entry
Volume shelf is white dotted line, and two blue lines are GEX Walls, so you have Confluence on the 5-minute chart. Go to one minute for entry, look for buyside imbalance for entry and use latest swing low as stop loss.

Sp500We just hit important trend line and bounce inverting a 4H with not resistance so if we can return to this 4H OB/ FVG staying above the 50% of the daily wick above 6725. Taking a long set up pushing away from PDA is a high probability trade targeting 6800s. If this level fail consolidation and lower prices are more likely.
Note: Watch for Gap up or Gap down. They can alter the set up.

SP500We just hit important trend line and bounce inverting a 4H with not resistance so if we can return to this 4H OB/ FVG staying above the 50% of the daily wick above 6725. Taking a long set up pushing away from PDA is a high probability trade targeting 6800s. If this level fail consolidation and lower prices are more likely.
Note: Watch for Gap up or Gap down. They can alter the set up.

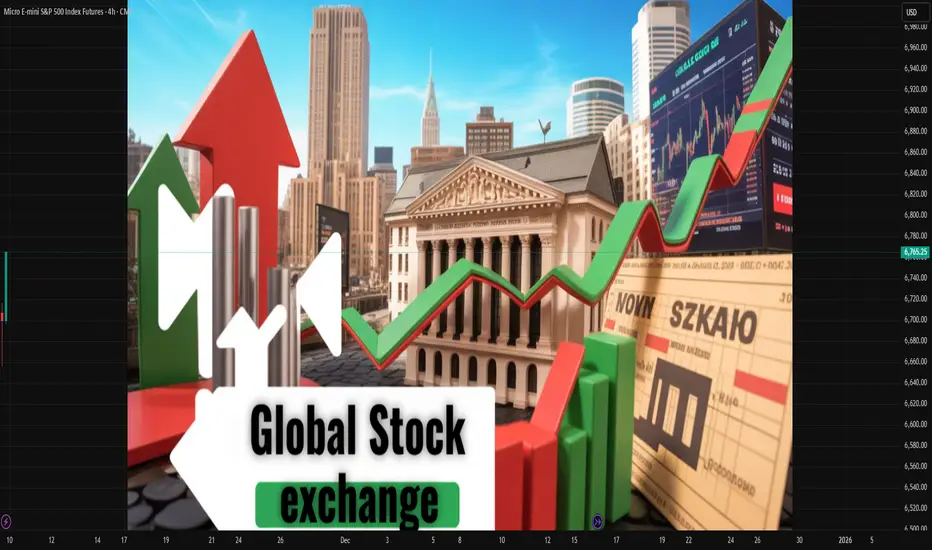
Major Global Stock Exchanges1. Understanding Stock Exchanges
A stock exchange is an organized marketplace where securities—like stocks, bonds, and derivatives—are issued and traded. It provides liquidity to investors, transparency in pricing, and regulatory oversight to ensure fair practices. Each major exchange operates under a national financial authority but impacts global markets through interconnected trading systems and investor participation.
Stock exchanges help channel savings into productive investments and play a crucial role in economic development by enabling companies to raise capital for growth. The performance of major exchanges often mirrors the strength or weakness of their respective economies.
2. The New York Stock Exchange (NYSE)
The New York Stock Exchange, located on Wall Street, is the largest and most prestigious stock exchange in the world by market capitalization. Established in 1792 under the Buttonwood Agreement, the NYSE has been a symbol of American capitalism and financial power for more than two centuries.
Market Capitalization: Over $25 trillion (as of 2025).
Listed Companies: Around 2,400 from diverse sectors.
Index: The Dow Jones Industrial Average (DJIA) and the S&P 500 track major NYSE-listed stocks.
The NYSE operates under the Intercontinental Exchange (ICE) and uses both an electronic trading system and a physical trading floor. Its hybrid model ensures transparency, liquidity, and efficient execution of trades. Companies like Apple, Microsoft, Coca-Cola, and Johnson & Johnson are part of its listings.
The NYSE’s stability, regulatory standards, and investor confidence make it a global benchmark for equity trading and corporate governance.
3. NASDAQ (National Association of Securities Dealers Automated Quotations)
The NASDAQ is the second-largest stock exchange globally, established in 1971 as the world’s first electronic stock market. Unlike the NYSE, NASDAQ has no physical trading floor—it operates entirely electronically.
Market Capitalization: Around $22 trillion.
Focus: Technology-driven companies.
Major Index: NASDAQ Composite Index and NASDAQ-100.
NASDAQ is home to global technology giants such as Apple, Amazon, Google (Alphabet), Meta (Facebook), and Tesla. It revolutionized trading by introducing automation and electronic order matching, which reduced transaction costs and improved efficiency. Its success represents the digital transformation of global finance.
The NASDAQ’s role in nurturing high-growth tech companies has made it synonymous with innovation and modern capitalism.
4. London Stock Exchange (LSE)
The London Stock Exchange, one of the oldest exchanges, traces its roots to 1773. Located in the financial district of London, it is the primary market for securities in the United Kingdom and a vital global financial hub.
Market Capitalization: About $4 trillion.
Listed Companies: Over 1,900 from more than 60 countries.
Main Index: FTSE 100 (Financial Times Stock Exchange 100 Index).
The LSE operates under the London Stock Exchange Group (LSEG), which also owns other financial institutions like Refinitiv and Borsa Italiana. It plays a major role in global capital markets due to its international listings and strategic time zone, bridging Asian and American trading hours.
The LSE’s reputation for transparency, international participation, and regulatory integrity makes it a cornerstone of global finance.
5. Tokyo Stock Exchange (TSE)
The Tokyo Stock Exchange is Japan’s largest and Asia’s most influential exchange. Established in 1878, it is operated by the Japan Exchange Group (JPX).
Market Capitalization: Around $6 trillion.
Listed Companies: More than 3,700.
Major Index: Nikkei 225 and TOPIX (Tokyo Price Index).
The TSE has driven Japan’s post-war economic rise and continues to be a center for corporate excellence and technological innovation. Companies like Toyota, Sony, Honda, and SoftBank are major components of the exchange.
Japan’s exchange is known for its efficiency, advanced technology, and global investor participation. Its performance reflects not only Japan’s economy but also broader Asian market trends.
6. Shanghai Stock Exchange (SSE)
The Shanghai Stock Exchange, established in 1990, is one of the largest exchanges in the world and a crucial part of China’s rapidly expanding financial system.
Market Capitalization: Over $7 trillion.
Listed Companies: About 2,200.
Main Indices: SSE Composite Index and SSE 50.
The SSE is state-regulated and plays a vital role in China’s economic reforms and modernization. It lists large state-owned enterprises such as PetroChina, Industrial and Commercial Bank of China (ICBC), and China Mobile.
While foreign investor access was limited in the past, recent policy reforms have opened Chinese markets to global investors through programs like Stock Connect with Hong Kong. The SSE’s growth signifies China’s transition into a global financial superpower.
7. Hong Kong Stock Exchange (HKEX)
The Hong Kong Stock Exchange, founded in 1891, serves as a bridge between Mainland China and global investors.
Market Capitalization: Around $5 trillion.
Listed Companies: Over 2,500.
Main Index: Hang Seng Index (HSI).
HKEX has become one of the world’s leading fundraising platforms, particularly for Chinese companies seeking international exposure. It plays a strategic role by connecting Western capital with Asian corporations through its Stock Connect system with Shanghai and Shenzhen exchanges.
Its global connectivity, regulatory stability, and location make HKEX a powerful player in the global financial landscape.
8. Euronext
Euronext is a pan-European exchange, established in 2000 through the merger of exchanges in Amsterdam, Brussels, and Paris, later expanding to other European cities.
Market Capitalization: Over $7 trillion.
Listed Companies: Around 1,900.
Main Index: Euronext 100 Index.
Euronext operates in multiple countries, including France, the Netherlands, Belgium, Ireland, Portugal, and Norway. It provides a unified platform for European capital markets and promotes integration within the EU financial system. Its diversity and cross-border listings strengthen Europe’s position in the global economy.
9. Bombay Stock Exchange (BSE) and National Stock Exchange (NSE)
India hosts two major exchanges: BSE and NSE.
Bombay Stock Exchange (BSE): Established in 1875, it is Asia’s oldest stock exchange.
National Stock Exchange (NSE): Founded in 1992, it introduced electronic trading in India.
Market Capitalization: Combined over $5 trillion.
Main Indices: BSE Sensex and NSE Nifty 50.
These exchanges are key players in the emerging market landscape, attracting domestic and global investors. India’s robust regulatory framework under SEBI and its growing economy have made BSE and NSE vital centers for global investment.
10. The Role and Global Impact of Stock Exchanges
Major global stock exchanges are interconnected through technology and investor participation. Events in one market—such as policy changes, interest rate adjustments, or geopolitical crises—can cause ripple effects across others.
They influence foreign investment flows, exchange rates, and commodity prices. For instance, a market correction in the U.S. can affect investor sentiment in Europe and Asia. Similarly, innovations like cross-border listings, exchange-traded funds (ETFs), and derivative trading have deepened global financial integration.
Conclusion
The world’s major stock exchanges form the backbone of the international financial system. From the historical legacy of the NYSE and LSE to the technological dynamism of NASDAQ, TSE, and SSE, each plays a unique role in shaping global capital markets. They serve as economic indicators, facilitate investment, and foster innovation across industries.
In an era of globalization, technological transformation, and cross-border finance, these exchanges are more connected than ever—driving not just national economies but also the financial pulse of the entire world.
Screener SystemThe Gabriel Quantitative Screener Series transforms the way traders approach technical and fundamental confluence.
Each filter was designed not just to identify market opportunities but to model institutional behavior, where volume, efficiency, and volatility compression merge into repeatable, high-conviction setups.
By mastering these tools, traders can adapt dynamically across multiple environments:
From high-growth rotations and momentum squeezes to value recoveries and fundamental leadership trends.
From swing trades that capture early rotations to short-term intra-day bursts driven by liquidity spikes.
Each screener operates independently, but together they provide a panoramic framework of market rhythm and capital flow dynamics—helping you trade in harmony with institutional footprints rather than noise.
⚙️ 1. Gabriel’s TTM Squeeze—Volatility Compression and Momentum Ignition
Credit to John Carter from Simpler Trading.
Concept:
The TTM Squeeze identifies moments when volatility contracts to its tightest levels, signaling a buildup of market energy before a potential breakout. Gabriel’s version refines this principle by combining EMA structure alignment, Stochastic crossovers, liquidity thresholds, and volatility gating to isolate high-probability expansion phases.
Core Technical Framework:
EMA (8), EMA (21), EMA (34), EMA (55), and EMA (89) create a layered exponential trend structure that reveals directional stacking.
Bullish alignment: EMAs stacked upward (momentum acceleration).
Bearish alignment: EMAs inverted (momentum exhaustion).
Bollinger Bands (20) within Keltner Channels (20)—defines volatility compression and the "squeeze" zone.
Stochastic (5,3,3), (8,3.3), (14,3,3)—ensures that it's ready and primed.
ADR > 2% & ATR (14) ≥ 0.5—ensures range expansion potential.
Volume ≥ 500K—confirms institutional-grade activity.
Market Cap ≥ $2B—eliminates illiquid small caps.
How It Works:
Detects volatility contraction as BBs narrow inside KCs.
Confirms directional alignment using multi-EMA structure and R.A.F. proxy.
Screens for expansion-ready setups where energy release often follows compression.
Ideal Use Case:
Perfect for swing and intraday traders who capitalize on volatility transitions. Best applied before earnings or major news catalysts when institutional positioning drives breakout volatility.
🚦2. Gabriel’s TRW Squeeze—Trend Rotation Wave Screener
Credit to Aayush Sharma from Stock Campus.
Description:
The Gabriel’s TRW Squeeze screener identifies trend rotation wave setups using volatility compression signals combined with multi-SMA alignment. It is designed to detect the moment when price, volatility, and structure synchronize—signaling a potential momentum release after a quiet consolidation phase.
While Gabriel’s TTM Squeeze focuses on exponential momentum acceleration, the TRW Squeeze emphasizes smoothed trend strength, ideal for swing traders and portfolio rotations.
Core Framework
🔹 Moving Average Structure
SMA(9), SMA(21), SMA(50), SMA(200) define the multi-horizon trend.
Alignment of these SMAs reveals institutional rotation and trend maturity.
Bullish Bias: price above SMA(9) > SMA(21) > SMA(50) > SMA(200).
Bearish Bias: reverse order or price below all SMAs.
🔹 Volatility Compression
Bollinger Bands (20) contracting inside Keltner Channels (20) marks the volatility “squeeze.”
This condition reflects a market equilibrium about to shift—the “coiling spring” pattern.
Once Bollinger Bands expand beyond the Keltner Channel, momentum is likely to surge.
🔹 Liquidity & Volatility Filters
Market Cap ≥ 2 B USD—avoids microcaps and ensures institutional-grade volume.
Volume ≥ 500 K—screens only actively traded stocks.
ATR(14) ≥ 0.5—ensures sufficient daily range for tradeable volatility.
ADR ≤ 2%—filters excessive overnight risk.
How It Works
Compression Detection—The screener finds assets where Bollinger Bands are inside the Keltner Channel, signaling low volatility.
Trend Alignment—SMA structure confirms the directional bias of the underlying trend.
Expansion Trigger—A breakout from the squeeze with aligned SMAs marks a high-probability trend continuation or reversal wave (TRW).
⚡ 3. Gabriel’s Low Float Mover—High-Volatility Momentum Screener
Credit to Ross Cameron from Warrior Trading.
Description:
Gabriel’s Low Float Mover is engineered to detect high-momentum, low-float stocks exhibiting abnormal volume surges, strong pre-market strength, and breakout behavior. It filters for equities within the $2.5–$25 range, making it ideal for traders targeting parabolic intraday and swing moves driven by speculative rotation, news catalysts, or short squeezes.
Core Filters
⚙️ Liquidity & Market Cap
Price: $2.50–$25 Focuses on the sweet spot for retail and small-float momentum plays.
Market Cap: $300M–$2B Captures low- to mid-float tickers with enough liquidity to run but small enough to move violently on volume.
🔥 Momentum & Volume Criteria
Relative Volume ≥ 5× Ensures today’s activity is at least 5× higher than normal—confirming crowd participation or news-based rotation.
New High (1 Month) Filters for fresh breakouts or stocks reclaiming momentum from consolidation.
Pre-Market Change ≥ 2%— Detects early strength before the open, a key tell for potential runners.
⚖️ Risk Control
ADR ≥ 2% Limits overnight tracking error and ADR volatility, focusing on domestic tickers with cleaner price action.
How It Works
Identifies low-float, mid-cap stocks within the preferred retail volatility range.
Confirms momentum ignition using relative volume, recent highs, and pre-market confirmation.
Highlights tickers most likely to experience intraday breakouts, halts, or squeezes.
Use Case
Built for day traders, momentum scalpers, and swing traders who thrive in fast-moving markets. The screener surfaces potential runners before market open, allowing early preparation and pre-market watchlist building.
⚖️ 4. Gabriel’s VPC—Value-to-Price Compression Screener
Credit to Mark Minervini.
Concept:
The Value-to-Price Compression (VPC) model identifies stocks transitioning from deep value recovery to early momentum, trading between their 52-week extremes.
It captures the “middle zone” where institutional accumulation typically begins—not too oversold, not too overbought.
Core Framework:
Price ≥ 30% above 52W Low—signals strength recovery from a value base; the more the better, preferably higher than 100%.
Price ≤ 30% below 52W High—leaves headroom for continued upside; the closer to the 52-week high, the better.
SMA (50), SMA (150), and SMA (200) measure long-term compression and potential golden-cross structure.
Market Cap ≥ $300M, Volume ≥ 2M, ATR ≥ 0.5, ADR ≤ 2%—ensure clean, tradeable liquidity profiles.
How It Works:
Detects stocks recovering from lows but not yet overextended.
Confirms trend compression via SMA alignment.
Highlights candidates basing or consolidating before major continuation.
Ideal Use Case:
Best for swing and position traders aiming for sustained mid-cycle entries—the sweet spot between growth investing and technical momentum.
💹 5. Gabriel’s CANSLIM—Fundamental Growth & Institutional Leadership Screener
Credit to William O'Neil.
Description:
Gabriel’s CANSLIM identifies elite growth stocks that exhibit accelerating earnings, strong sales expansion, operational efficiency, and improving institutional interest—while still trading within 30% of their 52-week highs.
This screener merges O’Neil’s original CANSLIM principles with modern quantitative filters, designed to surface leaders emerging from consolidations with robust fundamentals and liquidity.
Core Framework
📈 C – Current Quarterly & Annual Earnings
EPS Growth (Quarterly YoY ≥ 25%)—highlights recent earnings acceleration.
EPS Growth (TTM YoY ≥ 15%)—confirms consistency across annual cycles.
Operating Margin (TTM ≥ 4.25%)—ensures profitable, scalable business models.
💰 A – Annual Earnings Growth
Revenue Growth (TTM YoY ≥ 25%)—sustained top-line expansion validates structural growth.
Net Margin (TTM ≥ 3%)—filters out low-quality revenue growth with poor conversion efficiency.
🧭 N – New Highs, Products, or Market Leadership
Price ≤ 30% below 52-week high—positions within breakout range of institutional accumulation.
ROCE (TTM ≥ 12%)—indicates strong capital efficiency and competitive advantage.
🏦 S / L / I / M – Supply, Leadership, Institutional Demand, Market Direction
Market Cap ≥ $300 M USD—ensures institutional-grade tradability.
Volume ≥ 5 M—screens for active institutional participation, the RS indicator.
Net Debt / EBITDA ≤ 17—avoids over-leveraged names that can’t scale efficiently.
ATR (14) ≥ 0.5 & ADR ≤ 2%—ensures both volatility for momentum and manageable risk.
How It Works
Filters fundamentally strong companies growing earnings and sales ≥ 20 % with efficient capital allocation.
Targets those near technical breakout zones—above institutional support but below euphoria.
Surfaces leaders capable of multi-quarter momentum continuation during strong market cycles.
💬 6. Gabriel’s Zulu Principle — Undervalued Growth with Technical Precision
Description:
Gabriel’s Zulu Principle is inspired by Jim Slater’s legendary small-cap investment philosophy — focusing on “niche growth at a reasonable price.” This screener merges the value discipline of fundamental analysis with technical alignment, surfacing emerging growth companies before institutional recognition.
It’s designed to identify small- and mid-cap stocks that are growing earnings rapidly yet remain undervalued by traditional metrics, sitting quietly in volatility contraction zones — the perfect setup for asymmetric upside.
🔥7. Stocks In Play, ORB — Opening Range Breakout Momentum Screener
Description:
“Stocks In Play, ORB” is a high-momentum liquidity screener built to identify intraday breakout candidates showing explosive activity around the Opening Range Breakout (ORB) window.
It focuses on high relative volume, strong ATR expansion, and clean volatility structure to surface equities with enough participation and range for active day trading.
This is your go-to pre-market and intraday watchlist generator for finding the tickers that matter today.
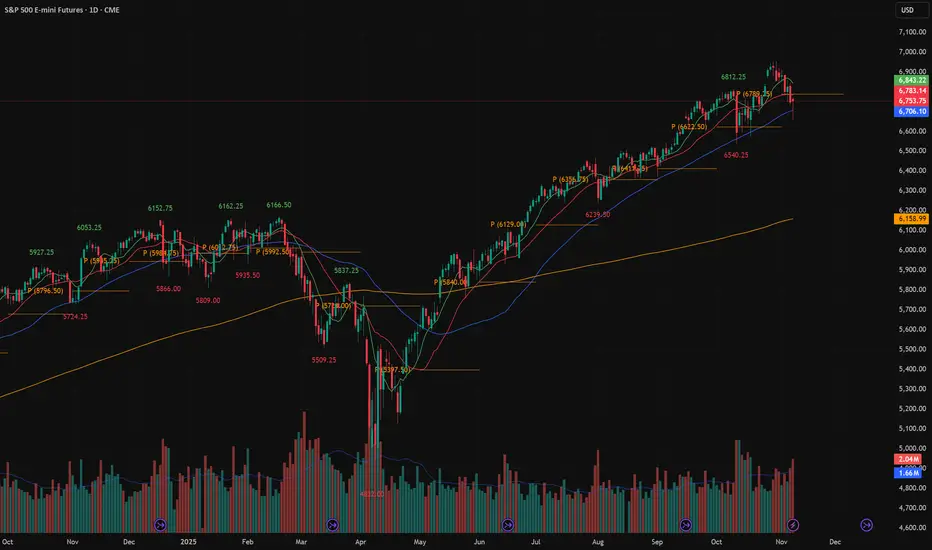
A big kick in volatility is possibleThe large shadow on the bottom of Friday's daily chart and the S&P 500 implies the possibility of a move to the upside, if there is a resolution to the government shutdown.

ES UpdateMy 3 hr indicator worked perfectly today. MFI was oversold so I flipped all of my puts on open, then I bought calls in the afternoon. I waited a bit longer than I needed to, I wanted to confirm that MFI was moving back up which indicates that the algos are going to pump futures.
This selloff has a strange downward megaphone pattern, if we break through the purple line Monday then the selloff is over. I still expect a midweek dip when MFI gets overbought.
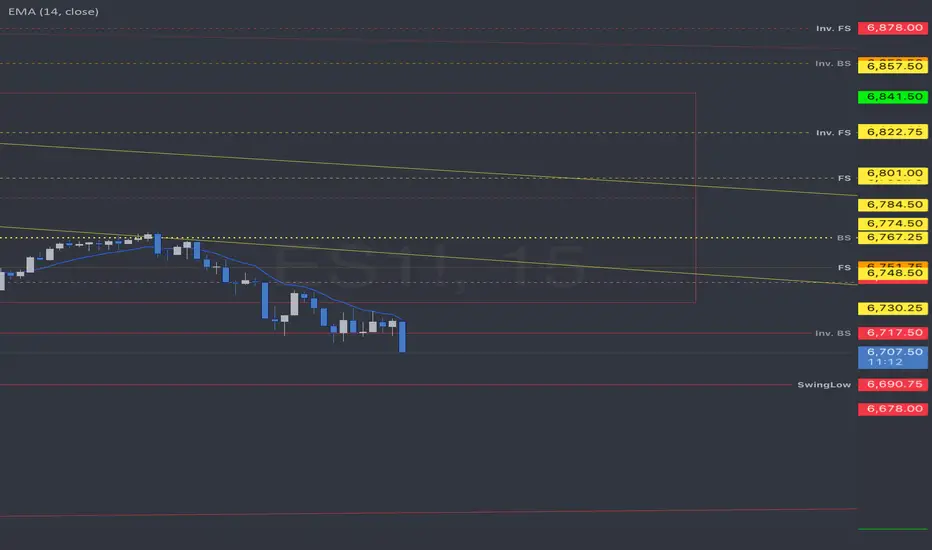

market trend analysisaccording technical analysis market trend is going to be as following in a best scenario

ESI left the trend lines on to illustrate the trend break and re-test of the level.
T.A explained -
BackSide (BS)
FrontSide (FS)
Inverse BS (Inv.BS)
Inverse FS (Inv.FS)
BS & FS levels are expected support when dashed lines, tested when dotted and resistance when solid lines.
The inverse is true for the Inv. BS Inv. FS levels, they are resistance as dashed lines, tested as dotted and support as solid lines.
Monthly timeframe is color pink
weekly grey
daily is red
4hr is orange
1hr is yellow
15min is blue
5min is green if they are shown.
strength favors the higher timeframe.
2x dotted levels are origin levels where trends have or will originate. When trends break, price will target the origin of the trend. its math, when the trend breaks, the vertex breaks too so the higher timeframe level/trend that breaks, the more volatility there could be as strength in the orders flow in to fuel the move.
yesterday
Trade closed manually
price followed the candle science and timeframes from the 5min green levels to the weekly grey level. Price has left behind some inverse frontside and inverse backside candles which look to be forming the bridge to flip the script if price manages to gain those levels and start accumulation. That liquidity will "unlock" and fuel price action.
anyways, the next levels below are the weekly and monthly levels. I need to update & post the next chart on the daily and 4hr timeframes.

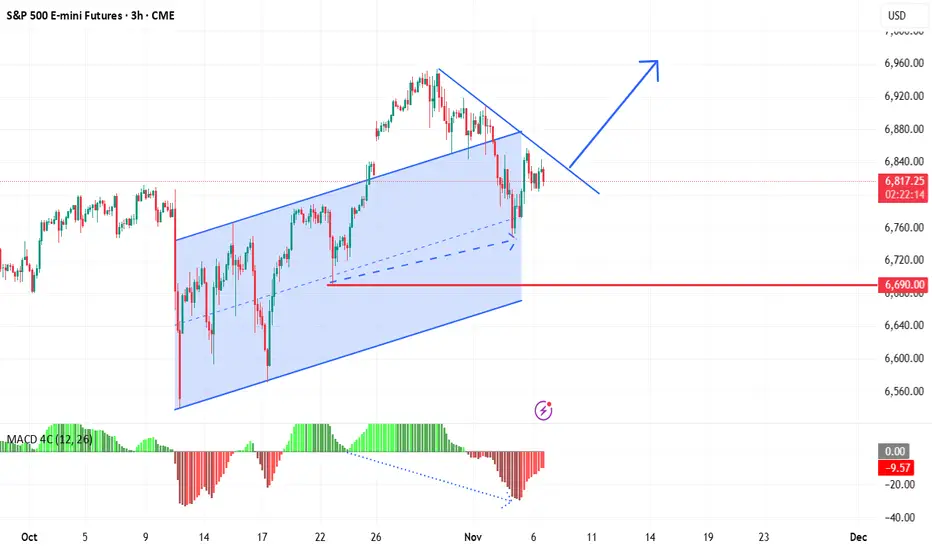
Bullish Hidden Divergence Signals Potential Upside ReversalA bullish hidden divergence is forming on the MACD indicator, suggesting underlying strength despite recent price pullback. This setup often precedes a continuation of the uptrend, with price likely to break above the descending trendline resistance. Key support near 6,690 remains intact, providing a solid base for a potential rally toward recent highs. Traders should watch for confirmation of breakout momentum.
Day 63 — Trading Only S&P Futures +$149.80Recap & Trades
Day 63 — a quiet, disciplined day.
I started late, didn’t see any A+ setups, so I mostly stayed out of the market.
The only positions came from overnight team orders that Bia and Ray placed — and they hit perfectly.
It’s a reminder that sometimes, letting the plan work without forcing it can be the best trade of all.
Lesson & Mindset
Not every day needs to be high action.
The best traders know when to trade — and when to protect their mental and financial capital.
If the market structure doesn’t align, patience is a position.
News & Levels
Futures pushed higher on headlines that Schumer and Jeffries are seeking a deal to end the government shutdown.
It’s keeping sentiment slightly bullish into the next session.
Tomorrow’s levels: Above 6870 bullish, below 6860 bearish.
