ES - November 7th - Daily Trade PlanNovember 7th- Daily Trade Plan - 7:50am
*Before reading this trade plan, IF, you did not read yesterdays, or the Weekly Trade Plan take the time to read it first! (You can see both posts in the related publication section) *
If my posts provide quality information that has helped you with your trading journey. Feel free to boost it for others to find and learn, also!
My daily trade plan and real-time notes that I post are intended for myself to easily be able to go back and review my plan and how I did from an execution perspective.
--------------------------------------------------------------------------------------------------------
Overnight low is 6715 and high is 6771. We have continued to create lower lows and as I have mentioned all week, we are getting close to the 6690 bigger trend breakdown. I do think today we have some good levels to grab some points and could produce a nice short squeeze.
Key Levels Today -
1. Loss of 6715 and reclaim
2. Loss of 6703 and reclaim
3. Loss of 6696 and reclaim
4. Loss of 6690 (maybe down to 6683 and reclaim).
Key Support Levels - 6711, 6703, 6696, 6690, 6683, 6675, 6666
Key Resistance Levels - 6726, 6732, 6742, 6749, 6755, 6766, 6771
Until price creates a higher high, I have to defer to the current micro trend which is the probability of price to continue lower. IF we lose 6690 and cannot reclaim 6785, we could melt down next week.
I will post an update around 10am EST.
----------------------------------------------------------------------------------------------------------------
Couple of things about how I color code my levels.
1. Purple shows the weekly Low
2. Red shows the current overnight session High/Low (time of post)
3. Blue shows the previous day's session Low (also other previous day's lows)
4. Yellow Levels are levels that show support and resistance levels of interest.
5. White Levels are previous days session High/Low
Trade ideas

Two fundamental charts that call for cautionAfter several months of almost uninterrupted gains in U.S. equity markets, certain sentiment and positioning indicators suggest that a mature phase of the bullish cycle has now been reached. Two recent charts, published respectively by BofA Global Research and Real Investment Advice, clearly illustrate this state of moderate euphoria, which warrants a more cautious approach.
The first chart, taken from the BofA Global Fund Manager Survey (FMS), shows that the average level of cash held by major institutional managers has fallen to 3.8% of assets under management, a cycle low. Historically, such low cash levels indicate high risk-taking and strong confidence in the market’s continued rise. BofA notes that a cash level of 3.7% or less constitutes a “sell” signal in their framework, as it suggests professional investors have little remaining dry powder to buy in case of a correction. In other words, the market’s “marginal buying power” is now limited.
The second chart, published by Real Investment Advice, highlights the evolution of margin debt in the U.S.—the money borrowed by investors to buy stocks on credit, in other words, leverage. It currently sits at exceptionally high levels, far above its 48-month moving average. Every past episode of excessive margin debt—during the 2000 dot-com bubble, the 2008 financial crisis, or the 2021 speculative mini-cycle—was followed by a sometimes brutal normalization phase. These periods do not necessarily mark the start of a bear market but often signal a heightened vulnerability to any negative economic, geopolitical, or financial news.
The combination of these two signals—fully invested managers and massive use of leverage—reflects an environment of extreme confidence. Such a configuration is common at the end of bullish cycles: investors seek to capture the last gains of a rally, but the slightest disappointment can trigger quick profit-taking.
Without announcing an imminent reversal, these indicators call for prudent management: reassessing exposure to risky assets, strengthening diversification, and keeping cash available to seize potential opportunities during pullbacks.
DISCLAIMER:
This content is intended for individuals who are familiar with financial markets and instruments and is for information purposes only. The presented idea (including market commentary, market data and observations) is not a work product of any research department of Swissquote or its affiliates. This material is intended to highlight market action and does not constitute investment, legal or tax advice. If you are a retail investor or lack experience in trading complex financial products, it is advisable to seek professional advice from licensed advisor before making any financial decisions.
This content is not intended to manipulate the market or encourage any specific financial behavior.
Swissquote makes no representation or warranty as to the quality, completeness, accuracy, comprehensiveness or non-infringement of such content. The views expressed are those of the consultant and are provided for educational purposes only. Any information provided relating to a product or market should not be construed as recommending an investment strategy or transaction. Past performance is not a guarantee of future results.
Swissquote and its employees and representatives shall in no event be held liable for any damages or losses arising directly or indirectly from decisions made on the basis of this content.
The use of any third-party brands or trademarks is for information only and does not imply endorsement by Swissquote, or that the trademark owner has authorised Swissquote to promote its products or services.
Swissquote is the marketing brand for the activities of Swissquote Bank Ltd (Switzerland) regulated by FINMA, Swissquote Capital Markets Limited regulated by CySEC (Cyprus), Swissquote Bank Europe SA (Luxembourg) regulated by the CSSF, Swissquote Ltd (UK) regulated by the FCA, Swissquote Financial Services (Malta) Ltd regulated by the Malta Financial Services Authority, Swissquote MEA Ltd. (UAE) regulated by the Dubai Financial Services Authority, Swissquote Pte Ltd (Singapore) regulated by the Monetary Authority of Singapore, Swissquote Asia Limited (Hong Kong) licensed by the Hong Kong Securities and Futures Commission (SFC) and Swissquote South Africa (Pty) Ltd supervised by the FSCA.
Products and services of Swissquote are only intended for those permitted to receive them under local law.
All investments carry a degree of risk. The risk of loss in trading or holding financial instruments can be substantial. The value of financial instruments, including but not limited to stocks, bonds, cryptocurrencies, and other assets, can fluctuate both upwards and downwards. There is a significant risk of financial loss when buying, selling, holding, staking, or investing in these instruments. SQBE makes no recommendations regarding any specific investment, transaction, or the use of any particular investment strategy.
CFDs are complex instruments and come with a high risk of losing money rapidly due to leverage. The vast majority of retail client accounts suffer capital losses when trading in CFDs. You should consider whether you understand how CFDs work and whether you can afford to take the high risk of losing your money.
Digital Assets are unregulated in most countries and consumer protection rules may not apply. As highly volatile speculative investments, Digital Assets are not suitable for investors without a high-risk tolerance. Make sure you understand each Digital Asset before you trade.
Cryptocurrencies are not considered legal tender in some jurisdictions and are subject to regulatory uncertainties.
The use of Internet-based systems can involve high risks, including, but not limited to, fraud, cyber-attacks, network and communication failures, as well as identity theft and phishing attacks related to crypto-assets.
Day 64 — Trading Only S&P Futures | 6/7 Signal AccuracyRecap & Trades
Day 64 — a clean, structured trading day.
Started small with team trades from Bia’s setups, and when we hit the bottom of the day, I saw the double bottom support and multiple buy signals align.
That was the cue. I went long, set a 20-point trailing stop, and let the algo handle the rest.
Sometimes, the best play is not to overtrade — just trust your plan.
Lesson & Mindset
When you’re in sync with your system, execution becomes effortless.
The double bottom setup plus confluence from team signals made this a high-confidence day.
This is how professional consistency looks — smaller, cleaner, smarter.
News & Levels
Markets dipped after fresh layoff reports hit — Dow down 300, VIX spiked — but the bounce off key support shows resilience.
Tomorrow’s levels: Above 6835 bullish, below 6810 bearish.

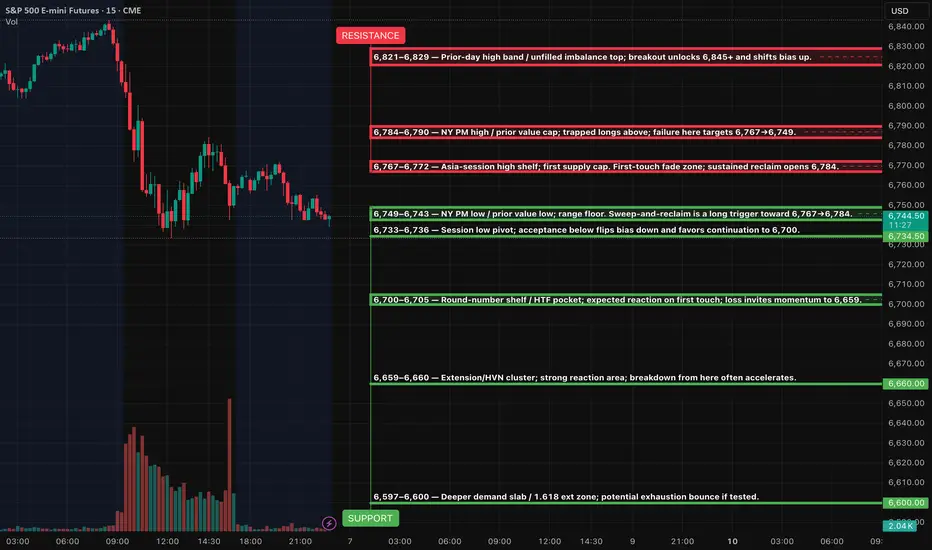
ES (SPX, SPY) Key Levels, Analysis and Setups for Fri (Oct 7th)EVENTS (ET, unaffected by shutdown): 3:00am NY Fed Williams speech; 7:00am Fed Vice Chair Jefferson speech; 10:00am Univ. of Michigan Consumer Sentiment (prelim); 2:00pm Fed G.19 Consumer Credit. Employment Situation report is postponed due to the shutdown (treat as no 8:30am print).
SETUPS (Level-KZ Protocol 15m→5m→1m)
ES LONG (A++) — 6,767 reclaim → 6,784 → 6,821
Entry: 6,768–6,772 after a 5m close and hold above 6,767 with 1m HL confirmation.
Hard SL: 6,755.
TP1: 6,784. TP2: 6,821. TP3: 6,845 if momentum persists.
ES SHORT (A++) — 6,784–6,790 pop-and-fail → 6,749 → 6,733
Entry: 6,782–6,789 on a 15m rejection close back inside the band followed by a 5m re-close down.
Hard SL: 6,796.
TP1: 6,767. TP2: 6,749. TP3: 6,733.
ES LONG (A+ Bounce) — 6,742–6,749 sweep & instant reclaim → 6,767 → 6,784
Entry: 6,750–6,753 after a swift reclaim and 1m HL.
Hard SL: 6,740.
TP1: 6,767. TP2: 6,784. TP3: 6,821.
ES SHORT (A+ Continuation) — 6,733 breakdown & retest → 6,700 → 6,659
Entry: 6,732–6,728 on 15m acceptance below 6,733 and a 5m LH retest.
Hard SL: 6,744.
TP1: 6,700. TP2: 6,659. TP3: 6,597.
KILL-ZONES & MANAGEMENT
Asia 20:00–00:00 optional and lighter size, London 02:00–05:00 optional, NY AM 09:30–11:00 primary for entries, Lunch 12:00–13:00 manage only, NY PM 13:30–16:00 allows second push or reversal plays. Daily guardrails: stop at −2R net or lock in ≥+3R net.
Rest day on Friday.After the volatile move to the downside on the daily chart in the S&P 500 on Thursday, the expected behavior for Friday is a rest day which result in Friday's daily range inside of the range from Thursday.

market trend analysisaccording technical analysis market trend is going to be as following in a best scenario

Understanding Money Flow Index In TradingMoney Flow Index (MFI) is a volume-weighted oscillator (0–100) that blends price and volume to show where real buying or selling pressure is building. By comparing positive vs. negative money flow from the Typical Price ((H+L+C)/3) and volume, MFI acts like a volume-aware RSI .
Traders use it to spot overbought/oversold zones (commonly >80/<20), confirm trend regimes around the 50 line, and catch divergences that often precede reversals. It’s simple, fast, and works across stocks, crypto, and FX—best used with a clear market structure and disciplined risk management.
1) Why is MFI important in trading?
MFI blends price and volume into a single oscillator, helping you spot exhaustion, confirm trends, and catch divergences earlier than price-only tools. Think of it as a volume-weighted RSI that validates whether a move is backed by real participation.
Captures “true” buying/selling pressure via volume.
Flags overbought/oversold zones more selectively than RSI.
Great for divergences, regime reads, and pullback timing.
2) MFI Components
Typical Price (TP): (High + Low + Close) / 3
Raw Money Flow (RMF): TP × Volume
Positive/Negative MF: Sum RMF on up-TP vs down-TP bars
Money Flow Ratio (MFR): PMF / NMF
MFI Line (0–100): RSI-style transform of MFR
Default length: 14 (common, tweakable)
3) MFI Formula
//@version=5
// Formula sketch (not an executable script)
TP_t = (high + low + close) / 3
RMF_t = TP_t * volume
// Over N bars:
PMF = sum( RMF_t where TP_t > TP_{t-1} )
NMF = sum( RMF_t where TP_t < TP_{t-1} )
// If TP_t == TP_{t-1}, ignore bar
MFR = PMF / NMF
MFI = 100 - (100 / (1 + MFR))
4) Interpreting MFI signals
Here’s how to read the line like a pro.
Zones: Overbought > 80 (extreme > 90), Oversold < 20 (extreme < 10)
Divergences: Bearish = price HH while MFI LH; Bullish = price LL while MFI HL
Midline/Regimes: Above 50 favors bulls; below 50 favors bears
Failure swings: Overbought → pullback → lower MFI high while price retests = caution
5) Trend & Momentum Analysis
Use MFI to confirm trend strength and quality.
Bullish ranges: MFI oscillates ~40–90 in uptrends; 50 often holds on dips
Bearish ranges: MFI oscillates ~10–60; rallies stall near 50–60
Momentum bursts: Fast pushes into 80–90 after consolidation often precede breakouts
Multi-timeframe: Align higher-TF MFI regime (e.g., 1D) with lower-TF entries (e.g., 1H)
6) MFI-Based Trading Strategies
Practical, testable rules you can refine.
A) Mean Reversion (Counter-Trend)
Entry: MFI < 20 → bullish reversal candle or break of minor swing high
Invalidation: Below the setup candle’s low or last swing low
Exits: MFI back to 50–60, or retest of VWAP/mid-channel
B) Breakout Confirmation
Precondition: Sideways range, contracting volatility
Trigger: Close outside the range and MFI > 55–60 (or spike > 80)
Exits: Trail behind structure/ATR; partials at measured move of the range
C) Trend Pullback Buy
Context: Uptrend with MFI mostly > 50
Entry: Pullback drives MFI into 40–50 then curls up; enter on HH/HOC close
Exits: Prior high, Fib extensions, or when MFI loses 50 again
D) Divergence Reversal
Trigger: Clear price/MFI divergence + break of a micro trendline or last swing
Risk: Tight stop past divergence origin
Targets: Midline 50 first, then opposing extreme 80/20
Confluence ideas: Pair with RSI, OBV, Bollinger Bands, or Volume Profile; require session/time filters for intraday assets.
7) Limitations of MFI
Know where it can mislead you.
Strong trends can pin MFI at extremes (overbought can stay overbought).
Volume quality matters (tick volume ≠ , centralized exchange volume).
Parameter sensitivity: too short = noise; too long = lag.
Data irregularities (thin books, outages, rollovers) can skew readings.
8) Optimization
Smart tweaks that actually help in live markets.
Dynamic Zones: Replace fixed 80/20 with rolling percentiles (e.g., 90th/10th of last 252 bars).
Adaptive Length: Tie MFI length to ATR/realized vol to reduce whipsaws.
Session Filters: Act only during liquid sessions; avoid lunch hours/illiquid opens.
Walk-Forward Testing: Validate across regimes; don’t overfit one market.
Risk First: Size by ATR; plan partials; use time-based exits to avoid stagnation.
9) Key Takeaways
Wrapping it up with what matters most.
MFI is a volume-aware oscillator that improves on RSI in participation-heavy moves.
Use 50 as a regime filter; use 80/20 (or dynamic zones) for edges.
Best signals: divergences, trend-pullback resets, and breakouts with MFI thrust.
Respect limitations: trends can pin MFI; validate with structure and clear risk controls.
Optimize with percentile zones, adaptive lengths, and session filters—then forward-test.
ESI left the trend lines on to illustrate the trend break and re-test of the level.
T.A explained -
BackSide (BS)
FrontSide (FS)
Inverse BS (Inv.BS)
Inverse FS (Inv.FS)
BS & FS levels are expected support when dashed lines, tested when dotted and resistance when solid lines.
The inverse is true for the Inv. BS Inv. FS levels, they are resistance as dashed lines, tested as dotted and support as solid lines.
Monthly timeframe is color pink
weekly grey
daily is red
4hr is orange
1hr is yellow
15min is blue
5min is green if they are shown.
strength favors the higher timeframe.
2x dotted levels are origin levels where trends have or will originate. When trends break, price will target the origin of the trend. its math, when the trend breaks, the vertex breaks too so the higher timeframe level/trend that breaks, the more volatility there could be as strength in the orders flow in to fuel the move.
yesterday
Trade closed manually
price followed the candle science and timeframes from the 5min green levels to the weekly grey level. Price has left behind some inverse frontside and inverse backside candles which look to be forming the bridge to flip the script if price manages to gain those levels and start accumulation. That liquidity will "unlock" and fuel price action.
anyways, the next levels below are the weekly and monthly levels. I need to update & post the next chart on the daily and 4hr timeframes.

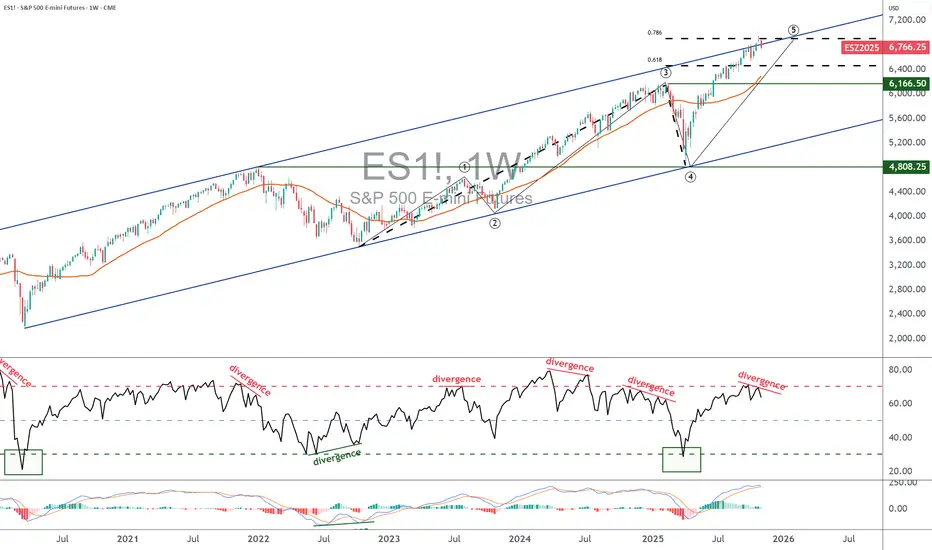
S&P500: Rebound S&P 500 futures managed to stage a modest rebound in yesterday’s session and are now showing renewed upward momentum. In our primary scenario, we expect magenta wave (5) to continue climbing and to ultimately mark a final high that completes the larger blue wave (III). Afterward, we anticipate a corrective phase via magenta wave (A), which should pull the index toward support at 6,371 points. However, if prices drop directly below the 6,371 points support, our alternative scenario will come into play. In that case, the alternative wave alt.(4) would likely extend further downward, finding its low within the magenta alternative Target Zone between 6,055 and 5,822 points.

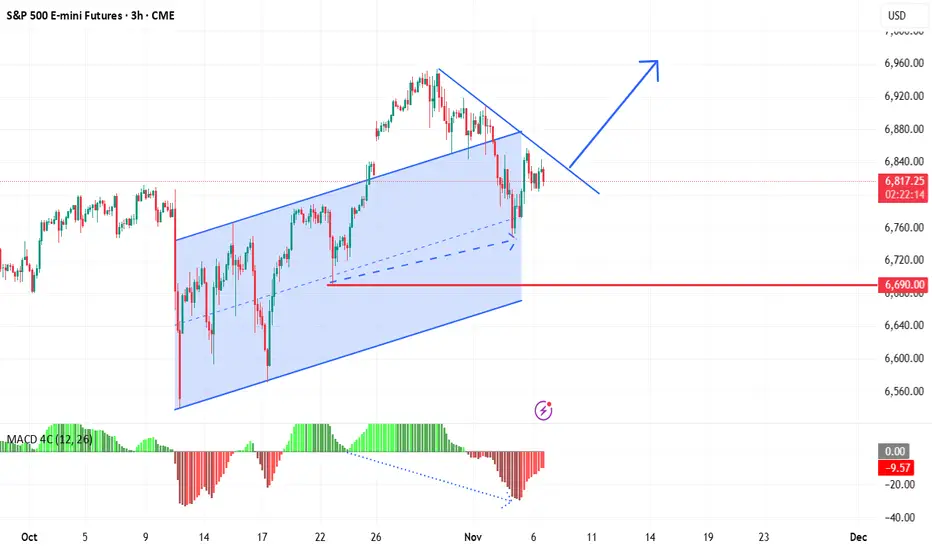
Bullish Hidden Divergence Signals Potential Upside ReversalA bullish hidden divergence is forming on the MACD indicator, suggesting underlying strength despite recent price pullback. This setup often precedes a continuation of the uptrend, with price likely to break above the descending trendline resistance. Key support near 6,690 remains intact, providing a solid base for a potential rally toward recent highs. Traders should watch for confirmation of breakout momentum.
ES - November 6th - Daily Trade PlanNovember 6th- Daily Trade Plan - 6:25am
*Before reading this trade plan, IF, you did not read yesterdays, or the Weekly Trade Plan take the time to read it first! (You can see both posts in the related publication section) *
If my posts provide quality information that has helped you with your trading journey. Feel free to boost it for others to find and learn, also!
My daily trade plan and real-time notes that I post are intended for myself to easily be able to go back and review my plan and how I did from an execution perspective.
--------------------------------------------------------------------------------------------------------
Since we continue to chop around in this range between 6770-6850, I will not get into too much detail about yesterday's price action as you can take a look at my trade plan from yesterday and read through the notes and what my expectation were and levels, we had to execute the trade plan!
Today we have ADP Employment numbers, PMI & ISM with tomorrow being the Jobs Report!
Our overnight low is 6804 and our high is 6835. As of typing this plan, you can clearly see that we have made lower lows, and lower highs overnight, so far. We are in a tight 30 pt range and bigger picture, I have talked this week about how 6856-60 a big resistance. I have also stated that 6690-95 is our level that needs to hold to keep the bigger picture bull case intact.
I expect a lot of choppy/trapping today and tomorrow. IF price does clear 6870, we should run back to new highs. IF price loses 6750, my expectation is that we test 6719, 6680.
Until we clear 6870, the current trend is for price action to lose 6750 and create a new lower low.
Key Levels Today -
1. Loss of 6807 and reclaim
2. Loss of 6792 and reclaim
3. Loss of 6773 and reclaim
4. Loss of 6749 and reclaim
IF price clears 6835 (Overnight high) prior to 9:30am open, we could see some FOMO and chasing at the open. IF price does fall back into the overnight range, I would be careful as we could head lower.
Key Support Levels - 6823, 6807, 6792, 6773, 6765, 6758, 6750
Key Resistance Levels - 6835, 6843, 6849, 6857, 6867, 6873
Until price creates a higher high, I have to defer to the current micro trend which is the probability of price to continue lower.
I will post an update around 10am EST.
----------------------------------------------------------------------------------------------------------------
Couple of things about how I color code my levels.
1. Purple shows the weekly Low
2. Red shows the current overnight session High/Low (time of post)
3. Blue shows the previous day's session Low (also other previous day's lows)
4. Yellow Levels are levels that show support and resistance levels of interest.
5. White Levels are previous days session High/Low

Day 63 — Trading Only S&P Futures +$149.80Recap & Trades
Day 63 — a quiet, disciplined day.
I started late, didn’t see any A+ setups, so I mostly stayed out of the market.
The only positions came from overnight team orders that Bia and Ray placed — and they hit perfectly.
It’s a reminder that sometimes, letting the plan work without forcing it can be the best trade of all.
Lesson & Mindset
Not every day needs to be high action.
The best traders know when to trade — and when to protect their mental and financial capital.
If the market structure doesn’t align, patience is a position.
News & Levels
Futures pushed higher on headlines that Schumer and Jeffries are seeking a deal to end the government shutdown.
It’s keeping sentiment slightly bullish into the next session.
Tomorrow’s levels: Above 6870 bullish, below 6860 bearish.

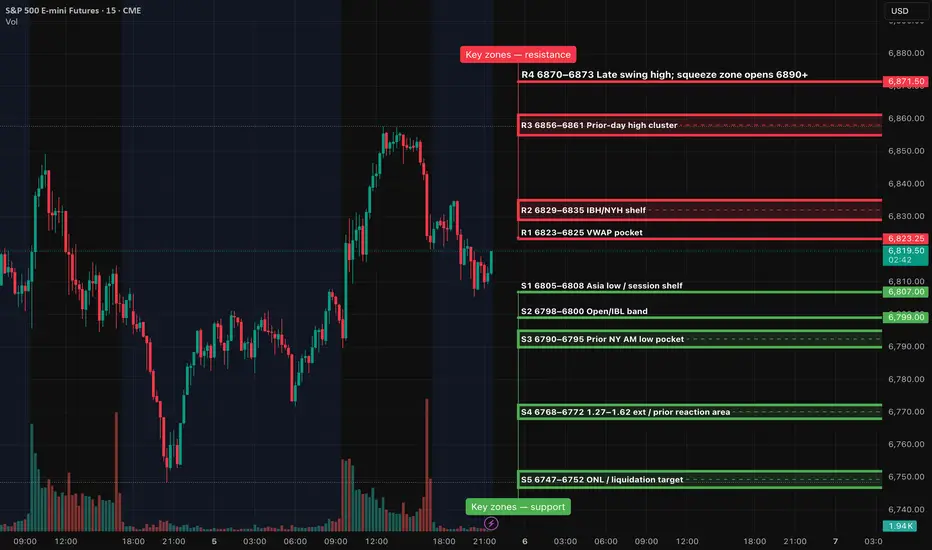
ES (SPX, SPY) Analysis, Key Zones, Setups for Thu (Nov 6)The daily trend has softened following the formation of a lower high. Analysis of the 4-hour chart indicates a bounce that encountered resistance near the 6860–6870 range, subsequently retreating to the 6810 support level. As we look ahead to tomorrow's trading, consider the 6805–6808 range as the key intraday “threshold” while the 6830–6835 zone will serve as the first significant resistance level to watch.
Setups (Level-KZ Protocol 15/5/1; NY KZ 09:30–11:00 & 13:30–16:00 ET)
1. Acceptance long from support
Trigger: 15m holds S1 6805–6808 → 5m reclaim 6823 VWAP → 5m close above 6830.
Entry: 6831–6834 on first 1m HL after the 5m re-close.
SL: 6821 (hard) or 15m trigger-wick −0.25–0.50 pt.
TP1: 6856–6861 (≥2R gate).
TP2: 6870–6873.
TP3: 6890–6895 if squeeze.
Management: No partials before TP1; at TP1 close 70%, set 30% runner to BE; no trail before TP2.
2. Rejection fade short from resistance
Trigger: Pop into 6856–6861, stall, then 5m full-body re-close back below 6856 with 1m LH.
Entry: 6850–6854.
SL: 6864.25 (hard) or 15m wick +0.25–0.50.
TP1: 6830–6832.
TP2: 6823 VWAP.
TP3: 6805–6808.
Note: If 5m re-claims 6861 after entry, exit early; setup invalid.
3. Breakdown continuation short
Trigger: 5m body close below 6805 with retest fail from beneath.
Entry: 6800–6803.
SL: 6810.75 (hard) or 15m wick +0.25–0.50.
TP1: 6790–6795.
TP2: 6768–6772.
TP3: 6747–6752.
Note: If reclaim and 5m closes back above 6808, cancel.
4. Breakout continuation long
Trigger: 5m acceptance above 6861 and hold on retest.
Entry: 6862–6865 on first 1m HL.
SL: 6853.25.
TP1: 6870–6873.
TP2: 6885–6890.
TP3: 6905–6912.
Note: If acceptance fails (5m body back under 6861), flip bias back to fade R3.
Event map for Thursday (ET)
FOMC meeting Day 1 (runs Thu–Fri; Fed is not affected).
EIA Weekly Natural Gas Storage 10:30.
Most BLS/DOL macro releases (e.g., Productivity & Costs, Weekly Jobless Claims) are suspended during the shutdown. Expect fewer 8:30 prints and thinner liquidity until the cash open.
ES UpdateI didn't trade today because of a hangover, lol.
Seems kinda weird that there was a resistance midday, you typically don't see resistance in the indices. EOD drop kept me from buying anything in the afternoon.
Futures are slightly red, MFI will probably get overbought before open tomorrow. In other words, don't buy the dip tomorrow. Appears Japan is resuming the selloff.

Buyer chart here but can they get the job doneBuyers returned to the S&P 500 daily chart but can they get the job done by providing follow-through to the upside on Thursday.

How to Trade with MACD in TradingViewMaster the MACD indicator using TradingView’s charting tools in this comprehensive tutorial from Optimus Futures.
The Moving Average Convergence Divergence (MACD) is a momentum and trend-following indicator that helps traders identify shifts in market direction and momentum strength. It measures the relationship between two exponential moving averages (EMAs) to reveal when momentum may be building or fading.
What You’ll Learn:
Understanding MACD as a tool that tracks the convergence and divergence of moving averages
How the MACD line is calculated as the difference between the 12-period and 26-period EMAs
How the Signal line acts as a 9-period EMA of the MACD line and serves as a trigger for potential buy or sell signals
How the Histogram visualizes the distance between the MACD line and Signal line to show momentum strength
Recognizing bullish and bearish crossovers between the MACD and Signal lines
How to interpret the Zero Line as a momentum baseline — above zero suggests an uptrend, below zero suggests a downtrend
Identifying bullish and bearish divergences between MACD and price to anticipate potential reversals
Why crossovers and divergences should be confirmed with price action and trend structure, not used in isolation
How to add MACD to a TradingView chart via the Indicators menu
Understanding the default settings (12, 26, 9) and how adjusting them changes responsiveness
Practical examples on the E-mini S&P 500 futures chart to illustrate MACD signals in real market conditions
Applying MACD across multiple timeframes — daily, weekly, or intraday — for higher-confidence confirmations
This tutorial will benefit futures traders, swing traders, and technical analysts who want to incorporate MACD into their trading process.
The concepts covered may help you identify trend changes, momentum shifts, and potential entry or exit points across different markets and timeframes.
Learn more about futures trading with TradingView:
optimusfutures.com
Disclaimer
There is a substantial risk of loss in futures trading. Past performance is not indicative of future results. Please trade only with risk capital. We are not responsible for any third-party links, comments, or content shared on TradingView. Any opinions, links, or messages posted by users on TradingView do not represent our views or recommendations. Please exercise your own judgment and due diligence when engaging with any external content or user commentary.
This video represents the opinion of Optimus Futures and is intended for educational purposes only.
Chart interpretations are presented solely to illustrate objective technical concepts and should not be viewed as predictive of future market behavior. In our opinion, charts are analytical tools — not forecasting instruments.

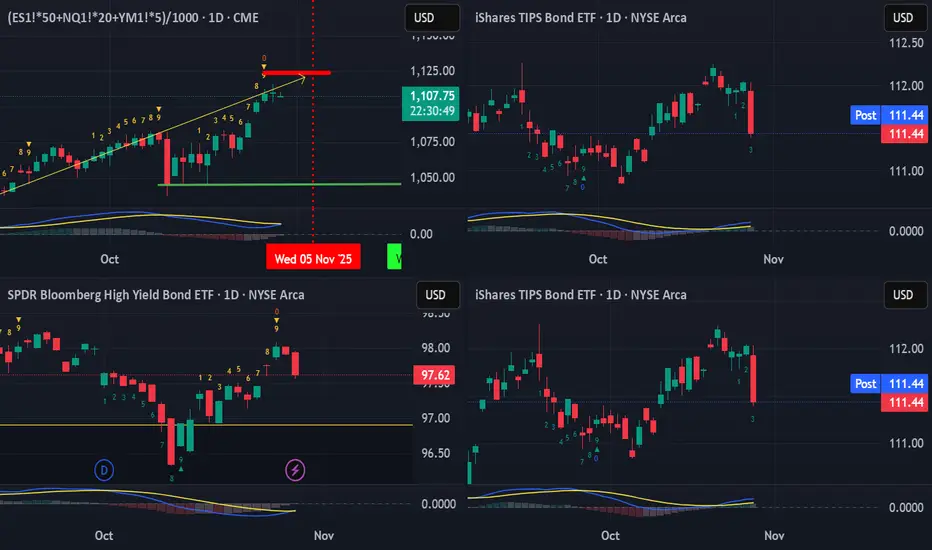
US Equities have this week left... Part IISo, yesterday heads up was given that the US Equities (and pretty much global equities generally) have this week left of bullishness.
This was observed with a TD Bear Setup perfected completion, coming into a stall. What was not mentioned was that the leading indicators of JNK, TIP and TLT were already showing signs of imminent breakdown (to understand about these three leads, refer to the book: Anatomy of the Bear by Russell Napier)
So just wanted to show it more obviously here.
While the US Equities were in a bit of a stall to close slightly positive, the three leads were clearly Bearish in the candlestick patterns with a single wipeout bearish, near marubozu, down candlestick that wiped out at least three days to two weeks of gain.
This like a slap in the morning while we are at the sweetest part of the dream.
Heads up, wake up!
Btw, with this kind of risk-off, crypto would not be spared either.
Short, sharp, sweet...
ES - November 5th - Daily Trade PlanNovember 5th- Daily Trade Plan - 6:30am
*Before reading this trade plan, IF, you did not read yesterdays, or the Weekly Trade Plan take the time to read it first! (You can see both posts in the related publication section) *
If my posts provide quality information that has helped you with your trading journey. Feel free to boost it for others to find and learn, also!
My daily trade plan and real-time notes that I post are intended for myself to easily be able to go back and review my plan and how I did from an execution perspective.
--------------------------------------------------------------------------------------------------------
I wrote yesterday "My general lean today is that we can back test 6843, 6862-65. I will be looking for a pullback to 6801 level and reclaim to grab some points. The only other option will be looking for a base to be built at one of the levels in yellow and create a strong support that provides an opportunity to enter long for a level-to-level move. 6824 resistance is a good spot to long for a move up the levels. It could be a tricky level to engage as it will probably take a few attempts to clear. Once it clears, it should move quickly up the levels to back test 6843, 6862-65."
Institutions were buying at the 6800 level between 8:30am-9:30am and we flushed down to 6786, reclaimed and then went higher and back tested to 6849 and then started to sell off in the afternoon. This is a typical bear market type of price action where price is being sold into strength, and we continue to make lower lows and lower highs. I would get used this type of price action as we could continue to see this over the coming months.
----------------------------------------------------------------------------------------------------------
Overnight low is 6749 and the high is 6807 with 6800 being heavy resistance that needs to clear for us to continue up the levels. IF price does head higher, we should test 6810, 6823. Technically IF price wants to continue higher, we need to clear 6849.
IF price does not clear 6800 and we lose 6749, we will need to see if price can react at 6734 or lose 6719 and reclaim to back test 6750 and potentially try to go higher.
I have said over the past few weeks that we have to remain bullish unless we lose the 6690 level. Last week we closed at the prior week lows and so far, we are trending to potentially do the same this week if price can hold 6690.
Key Levels Today -
1. Loss of 6775 and reclaim (This has been tested as I write this post, so will be weaker on next attempt)
2. Loss of 6765 and reclaim
3. Loss of 6758 and reclaim
4. Loss of 6749 and reclaim (Overnight Low)
5. Loss of 6734 and reclaim
6. Loss of 6719 and reclaim
Below these levels and I don't get very interested until 6690-95.
Key Support Levels - 6775, 6765, 6758, 6749, 6734, 6726, 6719
Key Resistance Levels - 6786, 6800, 6807, 6816, 6823, 6831, 6843, 6849
Until price creates a higher high, I have to defer to the current micro trend which is the probability of price to continue lower.
I will post an update around 10am EST.
----------------------------------------------------------------------------------------------------------------
Couple of things about how I color code my levels.
1. Purple shows the weekly Low
2. Red shows the current overnight session High/Low (time of post)
3. Blue shows the previous day's session Low (also other previous day's lows)
4. Yellow Levels are levels that show support and resistance levels of interest.
5. White shows the trendline from the August lows

ES Update - Breakout backtestSorry that I'm fixated on the TACO gap a little too much, I realized that this drop isn't about the TACO drop, it's back testing the breakout, which is pretty typical, it did the same last year on the election news. Especially considering it broke out on fake news, lol.
So market probably open right here at the line and decides whether to tank or go up. Seeing that there's an open gap above for NQ, I'm guessing up.
The back test has to happen during actual market hours, so I'm thinking the market opens up somewhere in this area.

The upside is expected in the S&P 500 for WednesdayThe structure in the daily chart of the S&P 500 implies follow-through to the upside or Wednesdays trading session.

ES (SPX, SPY) Analysis, Levels, Setups for Wed (Nov 5th)News & timing (ET): ADP 8:15; ISM Services PMI 10:00; EIA Crude 10:30. Release status: all three are scheduled to run (not shutdown-affected).
Bias & context: Short-term trend remains lower after a sequence of 15m lower-highs/lows and failure to hold 6,793–6,805. Expect dip-buys to be sold unless 6,860+ is reclaimed and defended.
Overnight → NY forecast:
Base path: probe 6,748–6,756 into Asia/London, bounce to 6,793–6,805, then decide at NY open. Lose 6,748 on momentum and the magnet becomes 6,713–6,725.
Alt squeeze: reclaim and hold above 6,852–6,860, push to the 6,900–6,906 “gate”, then 6,940–6,955. Only above 6,955 can 6,968–6,985 and 7,020–7,052 come into play.
Bear extension: clean break and 15m body acceptance below 6,713–6,725 opens 6,660s (deeper extension) before any meaningful bounce.
Key-Zones
Resistance (top→bottom):
7,020–7,052 premium band (W3 major; first touch favors profit-taking)
6,968–6,985 measured-extension / weak-high pocket (W2)
6,940–6,955 prior distribution top / supply shelf (W2)
6,900–6,906 immediate ceiling “gate” (W2 pivotal)
Support (top→bottom):
6,852–6,860 defended floor / quick-reclaim bounce zone (W2)
6,793–6,805 swing-equilibrium magnet (W2)
6,748–6,756 next demand shelf / measured support (W2)
6,713–6,725 extension target and last strong shelf before deeper repricing (W3)
Setups (Level-KZ Protocol 15/5/1)
Rejection Fade (short): sell 6,852–6,860 or 6,900–6,906 after a 15m rejection close back inside → 5m re-close in your favor; use the 15m wick +0.25–0.50 pts as hard SL. TP1 = next opposing MAJOR level (e.g., 6,805 then 6,756).
Acceptance Continuation (long): only after a full-body 15m close above 6,860 and a 5m pullback that holds; target 6,900–6,906 → 6,940–6,955; invalidate on a 15m close back below 6,852.
Quick-Reclaim Bounce (Tier-2): flush into 6,748–6,756, instant reclaim on 1–5m, enter on first HL; TP1 = 6,793–6,805; invalidate on a 15m close back below the shelf.
Exhaustion Flush (Tier-3): if 6,748 breaks with force and a 15m body holds below, sell the first 1–5m LH; TP1 = 6,713–6,725; runner eyes 6,660s if momentum persists.
Risk & management (use consistently):
Instructions: only take a setup if TP1 ≥ 2.0R using the 15m-wick SL.
At TP1: close 70%, set 30% runner to BE; runner aims TP2 at the next major level.
No trailing before TP2. Time-stop 45–60m if neither TP1 nor SL hits. Max 2 attempts per level per session.
Kill-zones (ET): London 02:00–05:00 (optional ½–¾ size); NY AM 09:30–11:00 (primary); NY PM 13:30–16:00 (primary). Manage only 12:00–13:00.
What flips decision:
Bullish: sustained 15m acceptance above 6,860 then above 6,906 turns path toward 6,940–6,955 → 6,968–6,985.
Bearish: 15m acceptance below 6,748 invites 6,713–6,725; losing that level opens 6,660s before any notable bounce.

Day 62 — Trading Only S&P Futures | Burry’s Big ShortRecap & Trades
Day 62 — started red from overnight orders but recovered fast by staying disciplined.
The market opened strong but started fading right at Bia’s resistance, so I shifted my bias and played structure reversals instead of fighting the trend.
By midday, I was back green, ending with a clean +$422 and 5-for-5 signal accuracy.
Lesson & Mindset
When big headlines like “Michael Burry shorting the market” hit, most traders panic.
But in reality, it’s about staying grounded in structure.
Noise doesn’t pay — consistency does.
News & Levels
Futures dropped as Burry’s short position went public and bubble talk resurfaced.
It’s the perfect reminder that sentiment flips fast — and you’ve got to react, not predict.
Tomorrow’s levels: Above 6890 bullish, below 6865 bearish.

ES bounces off KEY support: levels to watchAfter the sizeable drop in index futures overnight, we have seen dip-buying right where we needed to: at 6789ish, a prior resistance and point of origin of the breakout. This level is key - let's see if index will hold its own above here. Break that and 6750 could be next. A more immediate support is now seen around 6820. In terms of resistance, the area between 6843 to 6851 is key. The index was testing this zone at the time of writing. If we have seen a genuine reversal, or at least a temp top, i would expect the sellers to defend their ground here. Failure to do so could see the index squeeze towards 6875 resistance.
By Fawad Razaqzada, market analyst with FOREX.com
