Day 48 — Trading Only S&P Futures | Risk Down, Focus UpRecap & Trades
Day 48 — I slept 10 hours to recover from the flu, woke up a bit foggy, and just eased into the day.
Took my time reviewing market structure and waited for clean confirmation before taking any trades.
The 11:40 VXAlgo DD Sell Signal lined up perfectly with the bearish flip and 10-min MOB zone — I shorted the recovery and let the market do the work.
Missed a few bottom orders, but overall execution was clean and controlled.
Lesson & Mindset
The key lesson today: when you’re on a hot streak, the best move isn’t to press harder — it’s to protect the gains.
That’s why I’m reducing my position size for the next few sessions. This isn’t about making more; it’s about keeping what I’ve earned.
News & Levels
Headline: The IRS plans to furlough 34,000 employees as the U.S. government shutdown continues — something to keep an eye on for market volatility.
Tomorrow’s levels: Above 6785 bullish, below 6765 bearish.
Trade ideas

ES - October 9th - Daily Trade PlanOctober 9th- 6:3am EST
*Before reading this trade plan, IF, you did not read yesterdays, or the Weekly Trade Plan take the time to read it first! (You can see both posts in the related publication section) *
If my posts provide quality information that has helped you with your trading journey. Feel free to boost it for others to find and learn, also!
My daily trade plan and real-time notes that I post are intended for myself to easily be able to go back and review my plan and how I did from an execution perspective.
-----------------------------------------------------------------------------------------------------------------
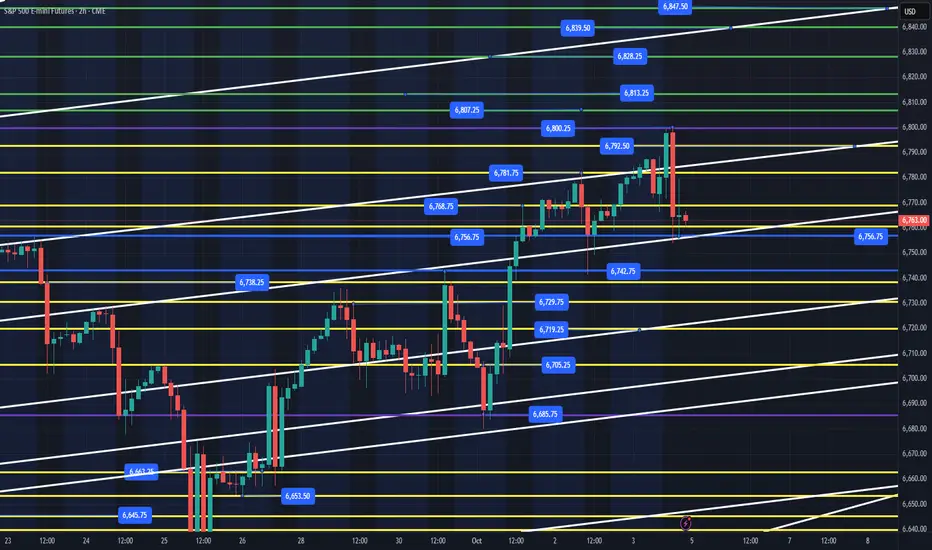
Yesterday we held the 7663 range and rallied higher, meeting the first 2 weekly targets at 6807 and 6813. I wrote in my 12:28pm Update - Note the following: IF, you zoom out on the chart to a higher time frame and even down to a 1-hour time frame, you can clearly see that Institutions have been buying any dips below 6750-6765 and we then sold off 2x at the 6802 zone. IF, price can clear this level and hold we should have a new range between 6800 - 6850. I still think we can get one more pull back before we go higher. I am going to take the afternoon off and let price this afternoon decide what it wants to do and will look for new entry's tomorrow. IF, price does lose the 6750-56 level on any pullback, that would be bearish and a warning to the bigger/current market structure. Price really should not lose 6770-74, with 6760-63 being the very lowest, IF, price wants to continue higher.
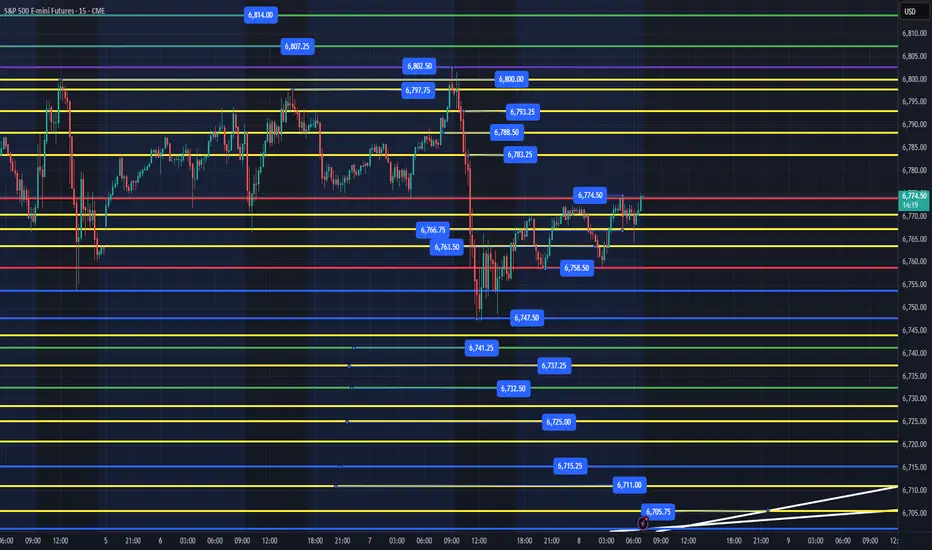
Since the overnight session we have been building a base with the overnight low at 6794 and the high of 6812. We need to keep price above 6788 with a flush and reclaim of 6793-94 being bullish and should take us higher to the 6818, 6822+ targets.
IF, price loses 6788, we will most likely need to test 6766-70 and see if we have much liquidity left at this level.
Highest quality setups are the following:
1. Flush 6793 and reclaim for a move higher
2. Flush 6788 (maybe down to 6783) and reclaim for a move to back test the 6794 level
Key Support Levels - 6793-94, 6788, 6783, 6774, 6763, 6758, 6747, 6741, 6732, 6715, 6705
Key Resistance Levels - 6802, 6807, 6812+
IF, price rallies above 6812 (Overnight High) and then comes back into the overnight range after the NYSE Open, and ES starts to sell off fast, DO NOT try and RUSH into grabbing points. Wait for it to build a base at one of the levels outlined above.
I will post an update around 10am EST.
----------------------------------------------------------------------------------------------------------------
Couple of things about how I color code my levels.
1. Purple shows the weekly Low
2. Red shows the current overnight session High/Low (time of post)
3. Blue shows the previous day's session Low (also other previous day's lows)
4. Yellow Levels are levels that show support and resistance levels of interest.
5. White shows the trendline from the August lows
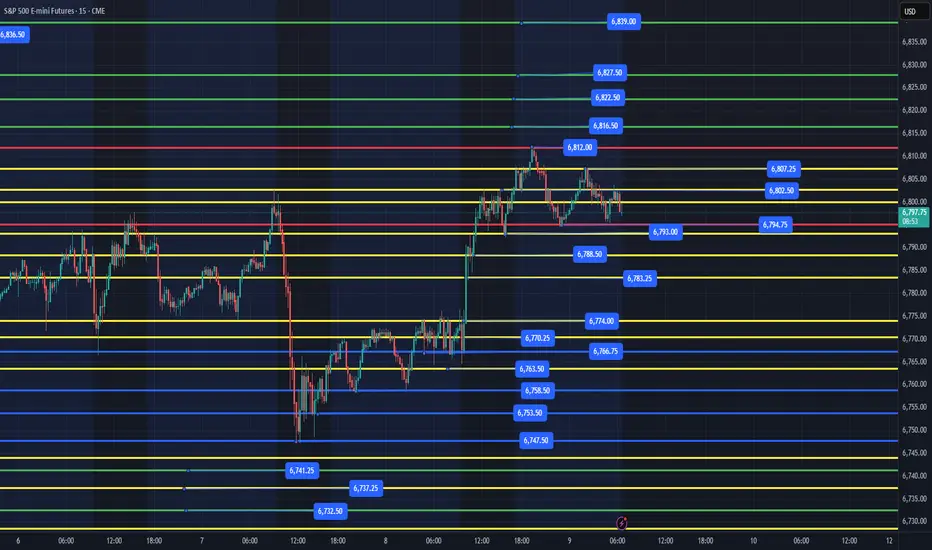
ES 10/9Shorts are distributing on a 15min timeframe as of posting.
a 15min bull flag is forming for long pants to get interested.
A distribution to the daily median range or the 4hr BS level in orange is not improbable later today.
If price starts to create low highs and price ladders down from the bottom side of the accumulation candles, then price could be forming a bull flag on the 4hr or higher timeframe. (I didn't look past the daily honestly)
Fib levels for the highs.

Imbalance in Global TradeIntroduction
Global trade forms the backbone of the modern international economy. It connects nations, drives industrial growth, and allows countries to access goods and services that they cannot efficiently produce domestically. Yet, the global trading system is rarely balanced. Trade imbalances—situations where a country’s exports and imports are unequal—have persisted for decades, shaping global economic relations, currency movements, and geopolitical power dynamics.
The term global trade imbalance refers to persistent surpluses in some countries and chronic deficits in others. While in theory, these imbalances should correct themselves through market forces like currency adjustments, in practice, they often persist for years or even decades. This imbalance affects growth, employment, debt sustainability, and even political stability worldwide.
This essay provides a comprehensive examination of the causes, impacts, and potential remedies of global trade imbalances, exploring both macroeconomic and structural dimensions.
1. Understanding Global Trade Imbalance
1.1 Definition
A trade imbalance occurs when the value of a country’s imports does not equal the value of its exports.
Trade surplus: When a country exports more than it imports.
Trade deficit: When a country imports more than it exports.
On a global scale, total exports should equal total imports. However, measurement discrepancies, financial flows, and uneven development levels cause persistent imbalances across nations.
1.2 Measurement of Imbalances
Trade imbalances are primarily measured using:
Balance of Payments (BoP): Captures the difference between exports and imports of goods and services.
Current Account Balance: Includes trade in goods and services, income flows, and transfer payments.
Persistent current account surpluses or deficits reflect underlying structural issues in savings, investments, productivity, and competitiveness.
2. Historical Context of Global Trade Imbalance
2.1 Post-World War II Period
After World War II, the Bretton Woods system established a dollar-based trade framework. The United States, with its vast industrial capacity, ran consistent trade surpluses, supplying goods to war-torn Europe and Asia. However, as Europe and Japan rebuilt their economies, U.S. surpluses diminished, giving way to growing deficits in the 1970s and beyond.
2.2 Rise of Export-Led Economies
The late 20th century witnessed the emergence of export-oriented economies, particularly in East Asia. Japan, South Korea, Taiwan, and later China, adopted strategies emphasizing industrialization through exports. These nations accumulated large trade surpluses, while countries like the United States, with high consumption and low savings, developed persistent deficits.
2.3 The China-U.S. Dynamic
The China–U.S. trade relationship epitomizes the global imbalance. China’s manufacturing dominance and low labor costs have led to enormous trade surpluses with the U.S., while the American economy, driven by consumer spending, has run chronic deficits. This imbalance is both economic and political, influencing currency policies, tariffs, and global investment patterns.
3. Causes of Global Trade Imbalances
Global trade imbalances arise from multiple, interconnected causes—macroeconomic, structural, and institutional.
3.1 Differences in Savings and Investment Rates
According to macroeconomic theory, a country’s current account balance equals its national savings minus investment:
𝐶
𝑢
𝑟
𝑟
𝑒
𝑛
𝑡
𝐴
𝑐
𝑐
𝑜
𝑢
𝑛
𝑡
=
𝑆
𝑎
𝑣
𝑖
𝑛
𝑔
𝑠
−
𝐼
𝑛
𝑣
𝑒
𝑠
𝑡
𝑚
𝑒
𝑛
𝑡
Current Account=Savings−Investment
Countries like China, Germany, and Japan have high savings and relatively low domestic consumption, leading to surpluses.
Conversely, countries like the United States, India, and the UK have lower savings and higher consumption or investment levels, resulting in deficits.
3.2 Exchange Rate Policies
Exchange rates play a critical role in determining trade competitiveness.
Undervalued currencies (as historically maintained by China) make exports cheaper and imports expensive, sustaining trade surpluses.
Overvalued currencies hurt export competitiveness, leading to deficits.
Currency manipulation or managed exchange rates can thus perpetuate global imbalances.
3.3 Structural Economic Differences
Industrial Base: Surplus nations often have strong manufacturing sectors, producing high-value exports.
Consumption Patterns: Deficit countries typically have high domestic demand for foreign goods.
Technological Capability: Advanced technology allows surplus countries to dominate key export industries.
3.4 Trade and Tariff Policies
Protectionist or liberal trade policies influence the direction of global trade.
Export subsidies and tariff barriers distort trade balances.
Free trade agreements (FTAs) can also shift imbalances by favoring competitive economies.
3.5 Role of Multinational Corporations (MNCs)
Global value chains managed by MNCs contribute significantly to trade imbalances. For instance:
U.S. companies producing goods in China for export back to the U.S. inflate China’s trade surplus.
Profit repatriation and transfer pricing further distort trade statistics.
3.6 Technological Advancements and Automation
Automation and digitalization have enabled advanced economies to maintain productivity with fewer domestic jobs, encouraging outsourcing to low-cost nations. This shift reinforces trade imbalances between developed and developing economies.
3.7 Fiscal and Monetary Policies
Expansionary fiscal policies (e.g., government deficits) increase imports by boosting domestic demand. Loose monetary policies can also depreciate the currency and affect trade flows.
4. Major Examples of Trade Imbalances
4.1 United States
The U.S. has run persistent trade deficits since the 1970s, largely due to:
High consumer spending,
Dependence on imports for manufactured goods,
Strong U.S. dollar attracting capital inflows.
4.2 China
China has maintained large trade surpluses through export-led growth, cheap labor, and government support for manufacturing. However, recent shifts toward domestic consumption aim to reduce dependence on external demand.
4.3 European Union and Germany
Germany’s trade surplus within the EU has created intra-European imbalances. Southern European economies (e.g., Greece, Spain, Italy) face deficits due to weaker competitiveness and higher borrowing.
4.4 Oil-Exporting Countries
Nations like Saudi Arabia and the UAE run large surpluses because of high energy exports, while oil-importing nations accumulate deficits.
5. Economic and Social Impacts of Global Trade Imbalances
5.1 Impact on Employment and Wages
Surplus countries gain jobs in export industries, improving employment and wages.
Deficit countries lose manufacturing jobs, leading to deindustrialization and income inequality.
5.2 Financial Market Effects
Trade surpluses lead to accumulation of foreign exchange reserves and capital outflows (investments in deficit countries). For instance, China and Japan invest heavily in U.S. Treasury bonds.
5.3 Exchange Rate Volatility
Persistent imbalances can lead to speculative attacks and currency crises, as seen during the Asian Financial Crisis (1997–98).
5.4 Global Inequality
Trade imbalances contribute to inequality—both between and within nations. Workers in deficit countries face job losses, while surplus economies accumulate wealth.
5.5 Political and Geopolitical Consequences
Trade imbalances often translate into trade wars and protectionist measures. The U.S.–China trade tensions, Brexit debates, and WTO disputes all have roots in perceived unfair trade advantages.
5.6 Environmental Impact
Export-driven industrialization increases carbon emissions and resource depletion in surplus countries, while deficit nations outsource environmental costs abroad.
6. The Role of Global Institutions
6.1 International Monetary Fund (IMF)
The IMF monitors current account balances and provides policy recommendations to correct imbalances. However, its influence is often limited in large economies.
6.2 World Trade Organization (WTO)
The WTO enforces trade rules and resolves disputes, but its ability to address macroeconomic imbalances is constrained.
6.3 G20 and Multilateral Forums
The G20 periodically addresses global imbalances through coordination of fiscal, monetary, and structural policies, though implementation varies across nations.
7. Corrective Mechanisms and Policy Responses
7.1 Exchange Rate Adjustment
Allowing market-determined exchange rates can help correct trade imbalances:
Surplus countries’ currencies appreciate, making exports less competitive.
Deficit countries’ currencies depreciate, boosting exports.
7.2 Fiscal and Monetary Policies
Surplus countries can stimulate domestic demand through fiscal expansion.
Deficit countries can reduce public and private spending to cut imports.
7.3 Structural Reforms
Encouraging innovation, improving productivity, and diversifying exports can reduce dependency on specific trade partners.
7.4 Trade Policy Coordination
Balanced trade agreements and reduction of non-tariff barriers can promote equitable trade growth.
7.5 Promoting Global Savings-Investment Balance
Reforms to encourage savings in deficit countries and boost domestic consumption in surplus economies can gradually narrow imbalances.
8. The Future of Global Trade and Emerging Trends
8.1 Digital Trade and Services
As global commerce increasingly shifts toward digital platforms and services (e.g., cloud computing, fintech, AI), trade imbalances may take new forms unrelated to goods.
8.2 Supply Chain Reconfiguration
Post-pandemic disruptions have prompted nations to diversify supply chains. “Friend-shoring” and “near-shoring” could rebalance trade geographically.
8.3 Green Trade and Sustainable Economics
Climate goals and carbon tariffs are influencing trade flows. Countries investing in green technologies may reshape future trade balances.
8.4 Rise of the Global South
Emerging economies in Africa, Latin America, and South Asia are gaining prominence in manufacturing and resource exports, potentially reducing dominance of traditional surplus nations.
8.5 Digital Currencies and Trade Settlement
The rise of central bank digital currencies (CBDCs) may redefine international payments, potentially reducing the U.S. dollar’s role and altering trade dynamics.
9. Case Study: The U.S.–China Trade War
The 2018–2020 U.S.–China trade conflict exemplifies the tensions arising from imbalances. The U.S. accused China of unfair trade practices and currency manipulation, while China defended its developmental model.
Outcomes:
Tariffs disrupted supply chains.
Global growth slowed.
Some production shifted to Southeast Asia.
Despite tariffs, the fundamental imbalance remained, reflecting deep structural differences rather than simple trade barriers.
10. Long-Term Outlook
10.1 Potential Scenarios
Gradual Rebalancing: Through policy coordination and rising consumption in surplus countries.
Persistent Polarization: If structural inequalities and protectionist trends continue.
Digital and Green Transformation: As new industries emerge, trade patterns may shift toward services, energy, and technology sectors.
10.2 Challenges Ahead
Political resistance to reducing surpluses or deficits.
Climate and energy transitions disrupting traditional trade flows.
Fragmentation of global economic governance.
Conclusion
The imbalance in global trade is not a simple arithmetic issue but a reflection of deep-seated economic, structural, and political asymmetries. Persistent deficits and surpluses distort growth, employment, and international relations. While globalization has brought prosperity, it has also created vulnerabilities that require coordinated policy responses.
Achieving balanced trade requires:
Cooperation among major economies,
Reforms in fiscal and monetary policies,
Fair trade practices, and
A transition toward sustainable and inclusive globalization.
In the 21st century, the challenge is not to eliminate trade imbalances entirely—since some are natural and cyclical—but to ensure they do not destabilize global prosperity or deepen inequality. A balanced global trade framework, grounded in fairness, innovation, and sustainability, remains essential for shared global growth.
ES (SPX, SPY) Analyses, Key Zones, Setups for Thu, Oct 9Market Drivers (ET)
• 08:30 — Fed Chair Powell: pre-recorded welcoming remarks at the Community Bank Conference. risk flag
• 08:30 — Initial Jobless Claims: suspended while the federal government remains shut down; will publish only if funding is restored before release time.
• 08:35 — Fed Vice Chair for Supervision Bowman: opening remarks (same conference).
• 09:45 — Treasury Sec. Bessent remarks & fireside chat (conference item; headline risk is modest).
• 10:30 — EIA Weekly Natural Gas Storage (standard Thursday slot).
• 11:30 — Treasury 4- & 8-week bill auctions (regular Thursday bills).
• 13:00 — Treasury 30-Year Bond (reopening) auction.
• All day: Other conference sessions (payments, community-bank panels; closing remarks late afternoon) may generate minor tape headlines.
A++ Setups (NY kill-zones: 09:30–11:00 & 13:30–16:00)
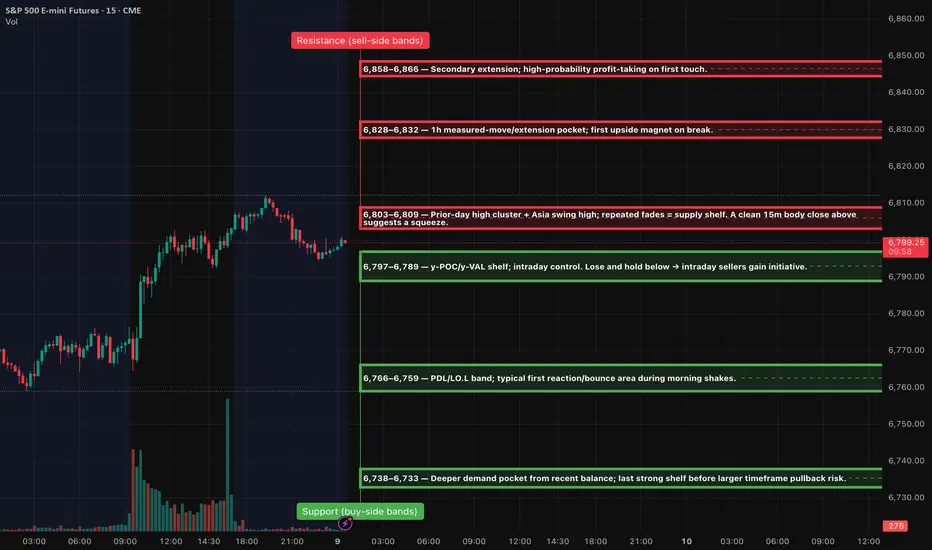
1) Breakout Continuation LONG (Tier-1 A++) — 6,809 unlocks
Trigger: 15m full-body close above 6,809, then 5m holds a retest 6,803–6,806 and re-closes up.
Entry: 1m higher-low on the retest hold.
Invalidation: Hard SL just below the 15m trigger-wick (±0.25–0.50 pts).
Targets: TP1 6,828–6,832, TP2 6,844–6,848, stretch 6,895± if trend day forms.
2) Rejection SHORT (Tier-1 A++) — Fail at 6,803–6,809
Trigger: Sweep/fail above 6,803–6,809 → 15m closes back inside ≤6,803; 5m forms a lower-high and re-closes down.
Entry: 1m LH after the 5m re-close.
Invalidation: Hard SL a tick beyond the rejection wick.
Targets: TP1 6,789, TP2 6,766–6,759, stretch 6,738–6,733.
Market Update and Trading Insight
Overnight Analysis:
As we enter the London session, we should expect a balanced trading range between 6,789 and 6,806. If we can hold above 6,797 as we transition into the European market, this may set the stage for a pre-New York move targeting the 6,803 to 6,809 area. Any shallow pullbacks that maintain the 6,797 to 6,799 support level will likely keep the bullish trend intact.
08:30 ET (Powell Speech - Pre-recorded):
The potential for significant market movements at this timing appears modest. Since there is no jobless claims data this week, we anticipate that the typical volatility around 08:30 will be lighter than usual. Should Powell's comments come across as neutral, expect trading activity to focus more on market levels and flows rather than on hard data.
Day 47 — Trading Only S&P Futures | Rested, Focused, ProfitableRecap & Trades
Day 47 — I finally got 8 hours of sleep, and the difference was night and day.
I was patient, calm, and focused from the start. I waited for clean signals, took only high-quality setups, and didn’t force a thing.
The result? A 14-trade win streak and +$6,250 across all accounts. No stress, no chasing — just clean, structured execution.
Lesson & Mindset
The biggest lesson today: you can’t trade well when you’re exhausted. Sleep isn’t optional — it’s a performance enhancer.
When your body’s recovered, your emotions are stable, your patience returns, and your focus becomes laser sharp.
News & Levels
Headline: The U.S. government shutdown is forecasted to last nearly 24 days.
Tomorrow’s levels: Above 6785 bullish, below 6765 bearish.

New high is expectedA new high in the S&P daily chart is expected for the October 9 session. The objective to the upside is 6825.

ES - October 8th - Daily Trade PlanOctober 8th- 6:55am EST
*Before reading this trade plan, IF, you did not read yesterdays, or the Weekly Trade Plan take the time to read it first! (You can see both posts in the related publication section) *
If my posts provide quality information that has helped you with your trading journey. Feel free to boost it for others to find and learn, also!
My daily trade plan and real-time notes that I post are intended for myself to easily be able to go back and review my plan and how I did from an execution perspective.
-----------------------------------------------------------------------------------------------------------------
Yesterday, I stated the following in my trade plan "IF, price rallies above 6792 (Overnight High) and then comes back into the overnight range after the NYSE Open, and ES starts to sell off fast, DO NOT try and RUSH into grabbing points. Wait for it to build a base at one of the levels outlined above."
What happened when we made a high around 6802 at 9am and price fell back into the range? We sold off and anyone that was not patiently waiting on levels below with a good entry strategy, would not have been profitable. You can review my real-time notes on the 2 trades that I took and can also play back the price action and see that we hit the 6747 green level exactly and have been moving higher since that low yesterday.
------------------------------------------------------------------------------------------------------------------
Let's get into today! You can look at the 15 min chart and see a nice set of higher highs, higher lows since the low yesterday. What does that mean? We can easily understand that the trend is up and until that most recent lower low is taken out, we should continue higher.
We are coming into the overnight high of 6774 and our low of overnight session is at 6758. IF, price can clear 6774, we should back test the 6783 level. Any loss of 6763 is a warning sign that we could head lower and a loss of 6758 would most likely produce a retest of the 6747 low.
Highest quality setups are the following:
1. Flush 6758 and reclaim for a move higher
2. Flush of 6747 (down to 6741-43) and reclaim for a move higher
3. Flush of 6741 (down to 6737, 6732) and reclaim for a move higher
These are the 3 main levels; I am looking to grab points from.
Key Support Levels - 6763, 6758, 6747, 6741, 6732, 6715, 6705
Key Resistance Levels - 6774, 6783, 6792, 6800, 6807+
IF, price rallies above 6774 (Overnight High) and then comes back into the overnight range after the NYSE Open, and ES starts to sell off fast, DO NOT try and RUSH into grabbing points. Wait for it to build a base at one of the levels outlined above.
I will post an update around 10am EST.
----------------------------------------------------------------------------------------------------------------
Couple of things about how I color code my levels.
1. Purple shows the weekly Low
2. Red shows the current overnight session High/Low (time of post)
3. Blue shows the previous day's session Low (also other previous day's lows)
4. Yellow Levels are levels that show support and resistance levels of interest.
5. White shows the trendline from the August lows
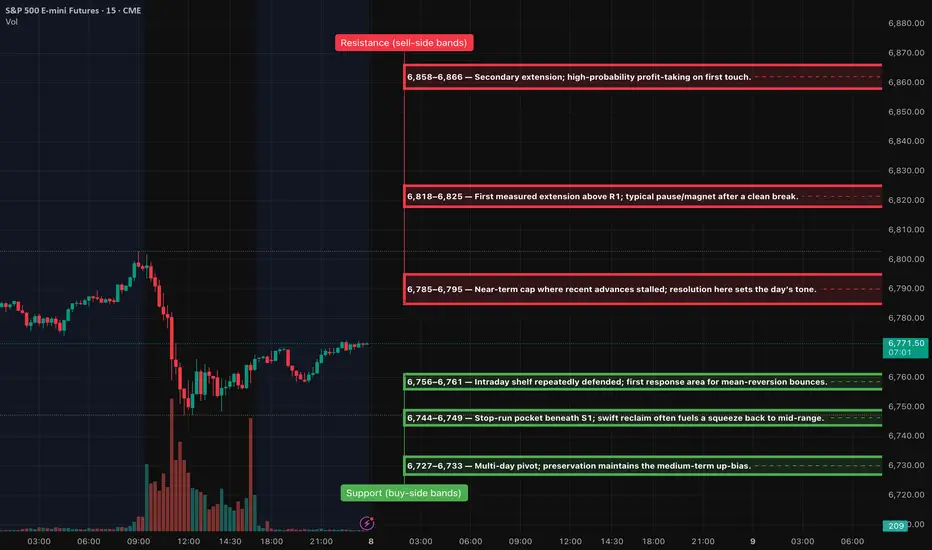
ES (SPX, SPY) Futures Analyses, Key Zones, Setups for Wed, Oct 8The E-mini S&P 500 (ES) is currently exhibiting a primary uptrend on the higher timeframes while consolidating just below a significant resistance level between 6,785 and 6,795. As we approach the New York morning session, the prevailing expectation is for a range-to-trend expansion, dependent on whether the 6,758–6,795 range is broken. The 6,785–6,795 zone should be regarded as the immediate focal point for decision-making.
Event & Risk Calendar (ET)
• 07:00–07:15 — MBA Mortgage Applications (weekly).
• 10:30 — EIA Weekly Petroleum Status Report (standard Wednesday release).
• 14:00 — FOMC Minutes (Sept 16–17 meeting). Expect volatility expansion on release.
A++ Setups (Tier-1, Level-KZ 15/5/1)
1. Trend-Continuation LONG at R1 break
Trigger: 15-minute full-body close above 6,795, 5-minute pullback holds 6,785–6,795, 1-minute higher-low confirms.
Entry: 6,788–6,795 on the retest/hold.
Invalidation: 15-minute body back below ~6,785.
Targets: TP1 6,818–6,825; TP2 6,858–6,866; TP3 6,898–6,905.
Risk: Hard SL = relevant 15-minute wick low −0.25–0.50 pts; take 70% at TP1, runner to BE; max 2 attempts per level.
2. Rejection-Fade SHORT at R1 failure
Trigger: Probe into 6,785–6,795 fails: 15-minute rejection close back below, 5-minute lower-high forms, 1-minute pullback fails.
Entry: 6,785–6,792 on failure.
Invalidation: 15-minute body acceptance above ~6,795.
Targets: TP1 6,756–6,761; TP2 6,744–6,749; TP3 6,727–6,733.
Risk: Same management as Setup 1 (wick-anchored SL; 70/30 at TP1; max 2 attempts).
Profit-taking?Sellers came into the S&P 500 daily chart on Tuesday. This is a bearish structure but it can also imply profit-taking. The price action over the next two days will give insight in terms of longer-term behavior.

Day 46 — Trading Only S&P Futures | -$1,452 | Fatigue & FocusRecap
Day 46 — not my best. I was running on low sleep, started patient, but missed the bearish flip and got caught buying at the 5-min MOB that didn’t hold.
TradeCopia started glitching too, opening wrong positions across accounts — that threw me off mentally and I lost focus.
Eventually, I stepped away, reset, and came back to trade the Gamma zone at 6747, which helped recover part of the losses.
Lesson & Mindset
Lesson of the day: fatigue kills awareness. When you’re tired, you hesitate, second-guess, and ignore the signals. Consistency requires recovery just as much as execution.
News & Levels
Headline: Oracle reported a $100 million loss tied to Blackwell chip rentals — a reminder of how tech volatility still drives the macro picture.
Tomorrow’s levels: Above 6785 flip bullish, below 6740 flip bearish.

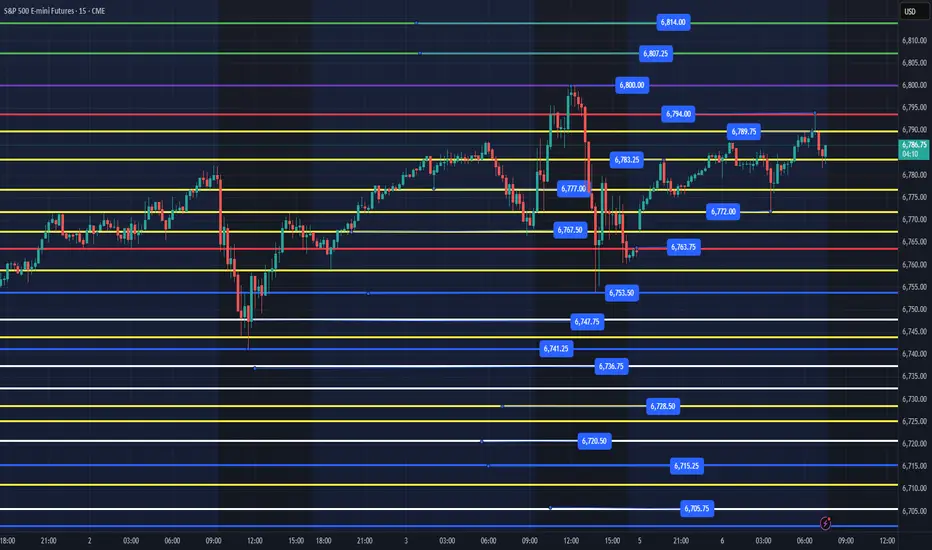
ES - 10/6 & Week 41The highest timeframe is a weekly box in grey
A daily red box is last friday's high , low and median range
4hr timeframe levels and trends are in orange
1hr timeframe is yellow and 15min timeframe levels are blue.
Strength should favor the higher timeframe.
BS and FS levels are support
Inv. BS and Inv. FS levels are resistance.
It all paints a fractal story through time if you put it all together. This is the science of Technical Analysis - 4 candles create 6 levels that evolve through timeframes which can be navigated with if/ then statements making the the system methodical and data driven.

ES - October 7th - Daily Trading Plan October 7th- 6:45am EST
*Before reading this trade plan, IF, you did not read yesterdays, or the Weekly Trade Plan take the time to read it first! (You can see both posts in the related publication section) *
If my posts provide quality information that has helped you with your trading journey. Feel free to boost it for others to find and learn, also!
My daily trade plan and real-time notes that I post are intended for myself to easily be able to go back and review my plan and how I did from an execution perspective.
-----------------------------------------------------------------------------------------------------------------
I am not going to go into detail on yesterday's trade plan and price action as we are in the same area, and the levels are pretty much the same for today.
---------------------------------------------------------------------------------------------------------------
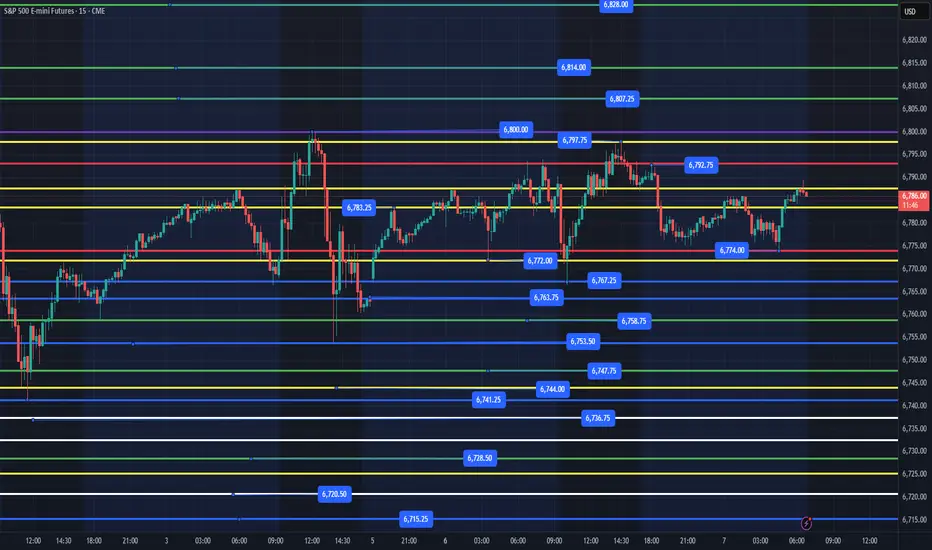
Today's Plan - We have 6783 as our first support with an overnight high of 6792 and overnight low of 6774.
Yesterday, I was able to grab points from the reclaim of the 6772 level.
We have a straight-forward plan for today. Ideally, we can pull back and close the 6763 level, reclaim 6768,6772 and move up the levels. IF, price can reclaim 6792, we should retest 6800 and potentially move up to the weekly targets.
Highest quality setups are the following:
1. Flush 6774 and reclaim for a move higher
2. Flush 6767 and reclaim for a move higher
3. Flush of 6753 and reclaim for a move higher
4. Flush of 6741 and reclaim for a move higher
These are the 3 main levels; I am looking to grab points from.
Key Support Levels - 6774, 6767, 6763, 6753, 6747, 6741, 6720, 6705
Key Resistance Levels - 6792, 6800, 6807+
IF, price rallies above 6792 (Overnight High) and then comes back into the overnight range after the NYSE Open, and ES starts to sell off fast, DO NOT try and RUSH into grabbing points. Wait for it to build a base at one of the levels outlined above.
I will post an update around 10am EST.
----------------------------------------------------------------------------------------------------------------
Couple of things about how I color code my levels.
1. Purple shows the weekly Low
2. Red shows the current overnight session High/Low (time of post)
3. Blue shows the previous day's session Low (also other previous day's lows)
4. Yellow Levels are levels that show support and resistance levels of interest.
5. White shows the trendline from the August lows
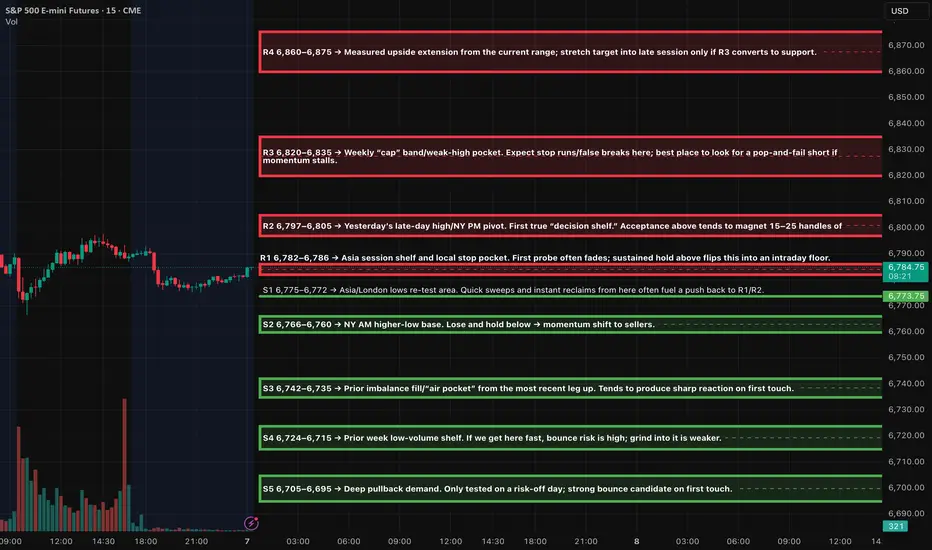
ES (S&P 500) Futures - Analyses, KeyZones, Setups Tue, (Oct 7)Context
We’re sitting just under a shallow ceiling built around 6,785–6,805 after holding a higher-low near 6,766. Trend is still constructive on higher timeframes, but intraday momentum is chopping under that overhead band. Expect two-way trade early with directional follow-through only if one of the edges gives way.
Session timing
• NY AM window: 9:30–11:00 ET (primary)
• Lunch manage-only: 12:00–13:00 ET
• NY PM window: 13:30–16:00 ET (primary continuation/reversal window)
Catalyst windows (be alert for volatility bursts)
• 8:30 ET — morning data drop
• ~10:00–11:00 ET — speaker risk window
• 13:00 ET — rates/auction impact window
Primary setups (Level-KZ style, 15m→5m→1m sequence)
1. Break-and-defend LONG (continuation)
Trigger: 15m full-body close above 6,785–6,786 (R1).
Execute: 5m pullback holds above 6,782 and re-closes up; 1m higher-low entry.
Risk: Hard SL beyond the 15m trigger wick (±0.25–0.50).
Targets: 6,797–6,805 (R2), then 6,820–6,835 (R3). If R3 converts to support, trail for 6,860–6,875 (R4).
Idea: Turn the shelf into a floor and ride the expansion.
2. Quick-reclaim LONG (bounce) at S1/S2
Trigger: Liquidity sweep into 6,775–6,772 or 6,766–6,760, then a 15m close back above the level.
Execute: 5m re-close up + 1m pop-and-go.
Targets: First magnet 6,782–6,786; stretch 6,797–6,805.
Notes: Works best in NY AM; avoid if we grind down into the level slowly.
3. Failure-to-defend SHORT (rotation down)
Trigger: 15m body close below 6,775, then 5m lower-high under 6,775 that can’t reclaim.
Execute: Sell the 1m pop-and-fail under the re-test.
Targets: 6,766–6,760 → 6,742–6,735; leave a runner for 6,724–6,715 if momentum expands.
Invalidation: Any 15m reclaim and hold back above 6,782 kills the idea.
4. Pop-and-fail SHORT at R3 (fade the cap)
Trigger: First push into 6,820–6,835 stalls (upper wicks on 15m), then a 5m lower-high below the spike.
Execute: 1m rejection entry with risk tucked above the wick.
Targets: 6,805 → 6,785; runner for 6,766 if breadth flips risk-off.
Notes: Don’t overstay; if buyers “walk it up” and print strong closes through 6,835, flip bias to continuation (Setup 1 extension).
Price Roadmap for the Day
So, here’s how to roll with today’s market.
Path A — Range to Upside Break: First up, we want to stay above 6,775 early on. If we can turn 6,785 into dependable support, we're looking to push towards 6,797–6,805. If buyers defend that re-test, we might see a move up to 6,820–6,835. Control shifts to buyers when that range becomes support, and that opens up the possibility of hitting 6,860–6,875 later in the PM session.
Path B — Failure from the Ceiling: Now, if we spike into 6,820–6,835 but can’t hold it, then a lower high under 6,805 could take control back to sellers. That sets us up for a drop to 6,785 and maybe even 6,766, with 6,742–6,735 acting like a “magnet pocket” if momentum kicks in.
Path C — Data/Auction Shock: Keep an eye out for any sharp moves around 8:30 or 13:00 that blast through key levels. In these scenarios, wait for a 5-minute re-test to see if it holds (which means the trend continues) or fails (pointing to a potential reversal). Don’t chase that initial spike; let the market prove it can stick at the level first.
Stay sharp!
Day 45 — Trading Only S&P Futures | +$4,921 | Best Day YetDay 45 — one of my best days yet. After a big workout weekend, I came in with strong mental clarity. Right at 8:30, VX Algo flipped bullish, and I went long off the 9am MOB zone premarket.
Got stop hunted right after the open, but risk was small, so I reloaded on the next setup — a 5-min MOB long with confirming buy signals — and that’s where the day took off.
Lesson & Mindset
The lesson today: preparation and mindset matter more than anything. When your body and mind are in sync, execution becomes automatic.
News & Levels
Headline: AMD and OpenAI spark a wild tech rally as S&P 500 hits another record.
Tomorrow’s levels: Above 6765 stay bullish, below 6740 flip bearish.

S&P 500 Futures ES $1000 risk per contract/ES in a $1000 risk to $1000 reward position. Bias is bullish but watch out for news. Trailing stops can be used to scalp the market. /MES is only $100 risk per contract for 1:1 ratio. Let watch and see what happens?

Uncertainty in the marketThe daily chart in the S&P 500 implies a market that wants to go higher but it lacks conviction on the close for Monday and the Asia session that is just starting for Tuesday so looking for a market that continues lower the next objective for this market is 6771.

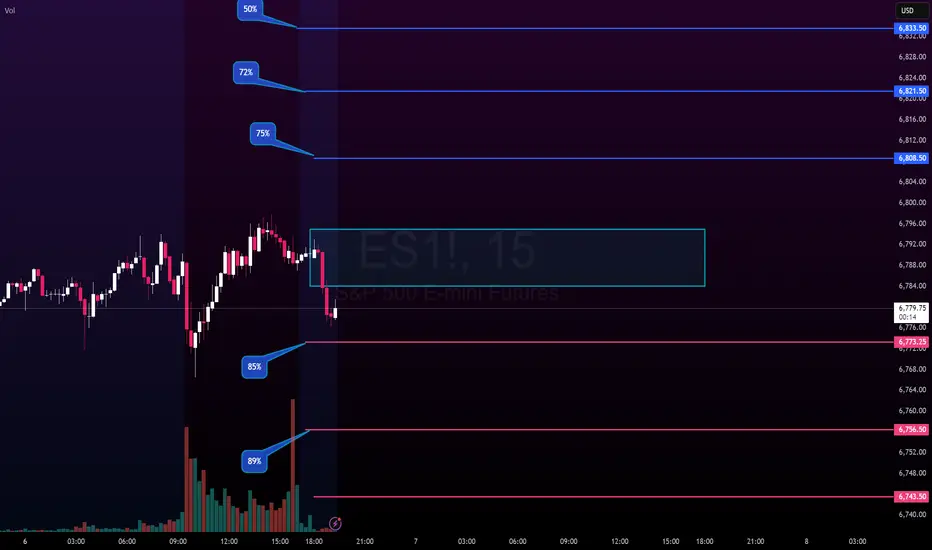
ES1!: Trading range and Levels for Oct 6 - 7 Haven't shared day trading levels in a while.
Here are the levels for ES1! that I am watching.
The labels correspond to the probability of hitting based on the condition of passing one level.
For example, ES1! has crossed below 6,784, putting at hit of 6,773 at 85%. If it crosses below that, the next level has an 89% chance of hitting, etc. etc.
Not advice, just sharing levels for your reference if you're interested.
As always, safe trades!
How to Use The Relative Strength Index (RSI) in TradingViewMaster RSI using TradingView’s charting tools in this comprehensive tutorial from Optimus Futures.
The Relative Strength Index (RSI) is one of the most widely used momentum indicators in technical analysis. It helps traders identify potential overbought and oversold conditions, spot divergences, and confirm the strength of trends.
What You’ll Learn:
Understanding RSI: a momentum oscillator plotted from 0 to 100
Key thresholds: how readings above 70 suggest overbought conditions and below 30 suggest oversold conditions
Why RSI signals are not automatic buy/sell triggers, and how strong trends can keep RSI extended for long periods
Spotting bullish and bearish price divergences
Using RSI to confirm trends
How to add RSI on TradingView via the Indicators menu
Understanding the default inputs and how changing them affects the indicator
Example on the E-mini S&P 500 futures: how RSI dipping below 30 and crossing back above can highlight momentum shifts
Combining RSI with other analysis for better confirmation
Practical applications across multiple timeframes, from intraday trading to swing setups
This tutorial will benefit futures traders, swing traders, and technical analysts who want to incorporate RSI into their trading strategies.
The concepts covered may help you identify momentum shifts, potential reversal points, and confirmation of trend strength across different markets
Learn more about futures trading with TradingView:
optimusfutures.com
Disclaimer:
There is a substantial risk of loss in futures trading. Past performance is not indicative of future results. Please trade only with risk capital. We are not responsible for any third-party links, comments, or content shared on TradingView. Any opinions, links, or messages posted by users on TradingView do not represent our views or recommendations. Please exercise your own judgment and due diligence when engaging with any external content or user commentary.
This video represents the opinion of Optimus Futures and is intended for educational purposes only. Chart interpretations are presented solely to illustrate objective technical concepts and should not be viewed as predictive of future market behavior. In our opinion, charts are analytical tools—not forecasting.

ES - October 6th - Daily Trade PlanOctober 6th- 7:45am EST
*Before reading this trade plan, IF, you did not read yesterdays, or the Weekly Trade Plan take the time to read it first! (You can see both posts in the related publication section) *
If my posts provide quality information that has helped you with your trading journey. Feel free to boost it for others to find and learn, also!
My daily trade plan and real-time notes that I post are intended for myself to easily be able to go back and review my plan and how I did from an execution perspective.
-----------------------------------------------------------------------------------------------------------------
In Friday's trade plan I was looking for the following levels:
1. 6772 test and reclaim the 6777 level to test the overnight highs and levels above.
2. 6758, flush and reclaim to take us back up the levels
Around 8:45am we lost 6772, built a nice base and reclaimed the 6772 level and moved higher to 6800, which was our weekly high.
1:14pm - Update
This will be my last update of the day before I leave my desk for the weekend. I did want to point out that we have met our main weekly targets and price started selling off at the 6800 level. Price needs to hold 6777 and reclaim 6788 to continue higher. As of writing, Tech is in the red and the VIX is green around 17.83. IF, price does lose 6777, I believe we will need to test the 6756 area as next good spot to get points. IF, price gets much lower, the Failed Breakdown of yesterday's low around 6741 and reclaim of 6745 would be a good spot also. I have no idea what the market will do this afternoon. IF, you have made money today, shut down the computer and do something else. IF, you have made money this week and lost money today, shut down the computer and do something else. DO NOT have FOMO and think you can trade long and short. You might get lucky a few times, but it is a retail traders' nightmare that causes accounts to blow up. As I always say, there are 250 days in a year. You will have good setups next week! IF, you still have a trade left in you, my opinion would be to wait for the 6756 or 6741 area, I have discussed above.
What happened in the afternoon? around1:45pm we flushed down to 6753, reclaimed the overnight low at 6758 and got a nice pop to 6780 and then pulled back before the close.
---------------------------------------------------------------------------------------------------------------
Today's Plan - We have 6783 as our first support with an overnight gap up at 6763 that has still to be filled and the overnight high of 6794.
We have a straight-forward plan for today. Ideally, we can pull back and close the 6763 level, reclaim 6768,6772 and move up the levels. IF, price can reclaim 6789, we should retest 6800 and potentially move up to the weekly targets.
Highest quality setups are the following:
1. Flush of 6753 and reclaim for a move higher
2. Flush of 6741 and reclaim for a move higher
3. Flush 6763 and reclaim for a move higher
These are the 3 main levels; I am looking to grab points from.
Key Support Levels - 6772, 6763, 6753, 6747, 6741, 6720, 6705
Key Resistance Levels - 6794, 6800, 6807+
IF, price rallied above 6794 (Overnight High) and then comes back into the overnight range after the NYSE Open, and ES starts to sell off fast, DO NOT try and RUSH into grabbing points. Wait for it to build a base at one of the levels outlined above.
I will post an update around 10am EST.
----------------------------------------------------------------------------------------------------------------
Couple of things about how I color code my levels.
1. Purple shows the weekly Low
2. Red shows the current overnight session High/Low (time of post)
3. Blue shows the previous day's session Low (also other previous day's lows)
4. Yellow Levels are levels that show support and resistance levels of interest.
5. White shows the trendline from the August lows
ES (SPX, SPY) Weekly Game Plan (Oct 6–10)Big Picture
Price is leaning into the 6,788–6,800 ceiling after a steady grind higher. Underneath, you’ve got stacked shelves: 6,778, 6,771/6,760, and 6,754. Lose that 6,754 floor and there’s an air pocket toward the 6,720s → 6,680s demand band. Expect rotations until the market either gets above 6,800 and sticks (trend-up week) or gets swatted back (rotate lower into value).
Weekly Bias & Likely Paths
Base case: Rotational around 6,788–6,800 until proven otherwise.
Bull path: Get above 6,800 and stick → pit stops 6,818–6,825 (TP1) → 6,856–6,862 (TP2) → stretch 6,895–6,905.
Bear path: Pop-and-fail at 6,800 → drift to 6,778 → 6,771/6,760 → 6,754.
Trend-down only if we close below 6,754 and fail the check-back, opening the 6,720s → 6,680s window.
Tomorrow’s Playbook — Level-KZ Protocol (15/5/1)
(NY AM window 09:30–11:00 ET; PM window 13:30–16:00 ET. Two tries per level max.)
Pop-and-Go LONG over 6,800 (Tier-1, full size)
Trigger: 15m close above 6,800 → 5m holds 6,788–6,792 and re-closes up → 1m higher high to enter.
Entry: 6,799–6,804 on the re-break.
Stop: Below the 15m trigger wick −0.5.
• Targets: TP1 6,818–6,825, TP2 6,856–6,862, TP3 6,895–6,905.
Management: No partials before TP1. At TP1 take ~70%, set runner to BE, no trail until TP2. Time-stop 45–60m if flat.
Pop-and-Fail SHORT at 6,788–6,800 (Tier-1, full size)
Trigger: Wick above 6,800 that can’t stick → 15m close back under 6,788, 5m confirms down → 1m lower high to enter.
Entry: 6,786–6,792.
Stop: Above the rejection wick +0.5.
• Targets: TP1 6,778, TP2 6,771.5–6,760.5, TP3 6,754 → 6,742.
Note: If TP1 prints in <10m, take ~50%, consider re-adding on a 5m LH.
Quick-Reclaim Bounce LONG at 6,758–6,754 (Tier-2, ¾ size)
Trigger: Flush into 6,758–6,754 that snaps back → 15m close back over 6,760, 5m holds → 1m HL entry.
Entry: 6,758–6,762.
Stop: 6,749–6,752 (below the sweep low −0.5).
• Targets: TP1 6,778, TP2 6,788, TP3 6,800.
Continuation SHORT under 6,754 (Tier-1, full size)
Trigger: 15m body under 6,754 plus a failed check-back into 6,754 on 5m.
Entry: 6,751–6,754 on the failed retest.
Stop: 6,762.
• Targets: TP1 6,736–6,728, TP2 6,720–6,700, TP3 6,685–6,680.
Price Action Road Map for NY Trading Session
Opening Analysis:
- We'll begin by monitoring if the price can hold above the 6,788 level. If it does, look for a push toward 6,800. If the price gets rejected at this level, we will shift our strategy to Scenario B.
Bearish Scenario:
- If the price slips below 6,760, anticipate a potential stop run targeting the 6,758 to 6,754 range.
Response Strategies
- If we observe a quick snap back from this region, be prepared to target the VWAP area, along with revisiting the 6,788 and 6,800 levels.
- Should we fail to reclaim these higher levels, prepare for a move down towards the 6,720s and potentially the 6,680s.
Afternoon Strategy:
- In the afternoon session, if we establish a clear comfort zone during the morning, consider fading the extremes until we see a definitive 15-minute body break from this zone.
Stay focused on these levels and remain adaptable to the market's behavior throughout the session. Good luck!

Stock Indexes Ride Momentum Despite Political RiskSeptember was a month of resilience for U.S. equities.
Despite fears of a government shutdown, mixed economic data, and cautious signals from the Fed, the S&P 500, Nasdaq, and Dow Jones managed to hold their ground. Early in the month, strong corporate earnings and cooling inflation data fuelled optimism, sending tech stocks higher as investors bet on a soft landing.
But that momentum was repeatedly tested — hawkish Fed remarks and political gridlock triggered waves of volatility, trimming gains into month’s end.
By the final week, investors had shifted focus from fear to fundamentals: easing inflation, steady consumer spending, and falling yields offered just enough support to keep the rally alive. It wasn’t a runaway month, but the message was clear — Wall Street is learning to thrive in uncertainty.

ES - Weekly Trading Plan - October 5th-11thOctober 5th - 11:30am EST
We had a great week, and Institutions continued to buy and keep price moving higher. We reached our weekly targets of 6767, 6792, 6801.
(You can read last week's trade plan under the related publications section)
Our weekly low was around 6680 on Wednesday and we reached our weekly high of 6801 on Friday afternoon before pulling back into the close. We have continued to find buyers in the 6748-56 range, and we really need to hold the 6750 level, or we will need to pull back further for us to find liquidity to move higher. Ideally, we pull back to the 6720-25 level and then continue higher. IF, we lose the 6705 level, we will most likely need to retest last week's low at 6680-85.
Key Support Levels - 6750-54, 6740, 6730, 6719, 6705, 6685
Key Resistance Levels - 6772, 6780, 6800
Weekly Targets - 6807, 6813, 6827, 6840+
Our first level at the overnight session to flush and reclaim would be Friday's low of 6753. This area has been tested multiple times this week and we should get another leg higher before losing this level. IF, price does lose 6753, we would need to look at 6741 to be flushed and reclaimed, 6732, 6720 are 2 other levels below to be looking for flush and reclaims.
I will post my Daily Trade Plan by 6am EST Monday, so that we can allow price action to tell us what it is trying to do. IF, you do trade the overnight session, the 6753 reclaim should be bullish and is the first area, I am looking for.
(I post a more detailed daily plan, and this allows me to focus on price action daily. The weekly plan is a bigger picture overview, but obviously that can change at any time based on daily price action) - *Follow me so you don't miss my daily updates
---------------------------------------------------------------------------------------------------------------------
Purple Levels - Weekly High/Low
Green Levels - Weekly Targets
Yellow Levels - Daily Key Levels (See Daily Trade Plan)
White - Trendlines that may produce support/resistance alongside the horizontal trendlines