Look at about four marketsDecember 16th think there are some markets that look like they're ready for reversal and that includes the oil market and some of the aggressive markets like the gold and the silver might be key ready to correct a little bit and I talk about that and they talked about S&P mini. I'm going to state here that I'm intentionally looking at markets that aren't quite ready to trade necessarily but we're in that part of the market where they may actually end up trading in the direction that we're looking for in other words if I want to trade oil I have an idea that I want to be a buyer when the market on oil is going lower so I wait for the market to go lower and I'll be I will be looking at the market this week as we see what goes on with the market and if I use my analysis I have a chance of spotting that market even though I talked about it a day or two earlier..... It's about using your time to find an opportunity and then having a little bit of patience to look a little bit longer if you need to and then you take the trade as a opposed to constantly looking at the market and wondering about the trade you're going to take and it's you're doing it every day and you don't have a plan. I spent time on Tesla as well.
Micro E-mini S&P 500 Index Futures
No trades
Market insights

Follow-through is expectedFollow through to the upside is expected on the daily chart in the S&P 500. I momentum that occurred on Friday follow through on Monday and is expected to continue on Tuesday with an objective of 6965.

ES (SPX, SPY) Analyses, Key Levels, Setups for Tue (Dec 16th)
As we head into Tuesday, ES is showing signs of structural weakness following a significant sell-off, culminating in a late dip into the 6845-6840 demand zone. The prevailing trend appears to be downward as long as prices remain beneath the resistance range of 6863-6874. However, the 6845-6840 support still has the potential to trigger a rebound. Traders should anticipate the most decisive price action around major data releases, followed by a phased, level-to-level approach in trading strategy.
EVENTS THAT CAN MOVE ES (ET)
2:00am UK labor data
3:15am-5:00am Eurozone PMI batch + ZEW sentiment window
8:30am US jobs data bundle + Retail Sales + Earnings + Unemployment
9:45am US Flash PMI
10:00am Business Inventories
4:30pm API oil stats (can hit energy tone into the close)
Market Outlook: NY Session Forecast
In the upcoming New York trading session, we anticipate a period of consolidation likely to include a modest rebound attempt. However, this upside movement is expected to face resistance within the range of 6859 and 6863-6874. Should sellers maintain pressure and keep prices below 6863 as we head into the session, we could see a subsequent pullback towards the 6845-6840 range, followed by a potential drop to 6825.
On the bullish side, if the market can decisively reclaim and sustain levels above 6874, we might open the door for a rally towards 6902 and possibly 6923.
Conversely, a clear breach below 6840 that lacks immediate recovery signals strengthens the bearish outlook, targeting 6825 initially, with the potential for a further decline to 6800-6790.
ES Short (A++) - Sell 6863-6874 - SL 6876.50 - TP1 6845-6840 TP2 6825 TP3 6800-6790
Key zones
Support - 6845-6840, 6825, 6800-6790
Resistance - 6851-6859, 6863-6874, 6902, 6923-6936
A++ Setup 1 - Short (ceiling fade)
Entry - Sell 6863-6866 after a rejection from 6863-6874
Stop - 6876.50 (above the rejection high)
TP1 - 6845-6840
TP2 - 6825
TP3 - 6800-6790
ES Long (A++) - Buy 6825 reclaim - SL 6814.25 - TP1 6863 TP2 6902 TP3 6923
A++ Setup 2 - Long (flush then reclaim)
Entry - Buy 6825-6828 only after price reclaims and holds above 6825
Stop - 6814.25 (below the flush low)
TP1 - 6863
TP2 - 6902
TP3 - 6923
Good Luck !!!

ES - December 16th - Daily Trade PlanDecember 16th- Daily Trade Plan - 5:50am
**Note - ES Contracts have rolled over on Trading View from December (ESZ2025) to the March (ESH2026) Contract. I have adjusted the levels on my charts and trade plan to reflect changes. March is roughly 60pts above December and is why yesterday's levels prices are way different than today's.
*Before reading this trade plan, if you did not read yesterday's take the time to read it first! (You can view the posts in the related publication section) *
If my posts provide quality information that has helped you with your trading journey. Feel free to boost it for others to find and learn, also!
My daily trade plan and real-time notes that I post are intended for myself to easily be able to go back and review my plan and how I did from an execution perspective.
--------------------------------------------------------------------------------------------------------
Since we are using the new contract levels, I will keep today simple and not discuss yesterday as it may be confusing. Overnight high is 6883 and our Overnight low is 6833. Yesterday our low was 6865 and as I am typing this trade plan, price is currently trying to clear and hold the 6865 level. When looking at price you can see that we are in a downtrend and price needs to clear 6929 to continue to move higher.
Key Levels Today -
1. 6865 - Flush and Reclaim
2. 6833-37 - Flush and Reclaim
3. 6812 - Flush and Reclaim
4. 6792 - Flush and Reclaim
Below 6833 and we should get a decent bounce at 6812, we will most likely find a better low around the 6792 level.
We have Employment Data coming out at 8:30am EST. I will post an update once we see the reaction. I will most likely not find any trading opportunities until after the NYSE open but will focus on price action and the levels in my plan.
I will post an update around 10am EST
----------------------------------------------------------------------------------------------------------------
Purple = A Weekly Low (Current or Previous Week)
Blue = A previous day low (Day before or day in the past week)
Red - Overnight Session High/Low (Prior to my post)
White = Key Support/Resistance Levels

SP500 Remains Bullish After The FED MeetingS&P 500 has made a very nice retracement recently; in fact for almost the whole November we have seen a pullback of around 5 to 6%, which is quite a lot for the S&P 500, and what is really important is that the market has stopped around the 6500 area, which basically goes back to October 10th when we saw a massive sell-off on that Friday when Trump threatened with new tariffs on China. But afterwards, as you can see, the market recovered, so it looks like a very beautiful rebound from that zone with impulsive characteristics, even beyond the diagonal and trendline resistance lines. This likely confirms that bulls are ready to resume higher into a potential fifth wave, which can be made by a new lower-degree five-wave bullish cycle. Ideally, new trend will resume soon after the current setback that can be flat in wave 2, so be aware of a bullish continuation into all-time highs and 7k are, possibly still this month.
After the FED meeting last week, we can see it making an irregular flat correction in wave (2) that can find the support at 6800 area, so soon be aware of a bullish resumption within wave (3).

ES UpdateNQ should hit oversold tomorrow, the question is whether or not ES and RTY also have to hit oversold before the market bounces.
Open gap above, but that will fill eventually when Supreme Court nullifies Trump's tariffs.
Took a chance and went long on GM calls this afternoon, held it because of the EOD pump. Could be a mistake holding calls when I know the market is headed down, but GM seems to be doing its own thing and melting up. Didn't really track the market at all today.
In any case, futures are red, and I'll go long on other stocks when ES hits oversold.
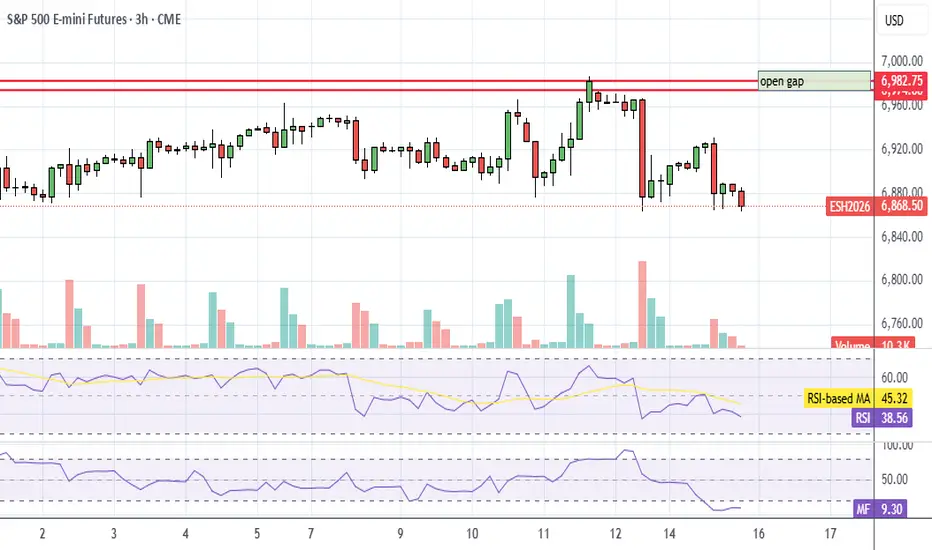

ES UpdateNow that futures went red, you can see ES touched oversold.
Not sure how far it needs to go oversold before we get a bounce tomorrow.

ES Update - Corrected (adjusted for contract change)I realized that if I don't adjust for contract changes, I'll wind up with a gap every contract change which wouldn't make sense.
So I changed my settings back, still a gap above and below.

ES UpdateOverbought with a gap below. It could melt up since it's Xmas, but I didn't see anything I wanted to go long on at the EOD, so I stayed cash.
Not sure if I'm supposed to adjust for contract changes and dividends for the gap, so that remains a question mark. With the adjustment, there is still a gap above.
Either way, NQ still has a gap above.

Inside dayThe structure and the daily chart for the S&P 500 implies an inside day or Friday with a slight bullish bias.

Bouncy closeThe shadow on the lows of the daily chart and the S&P 500 implies a bouncy close resulting from buyers entering the market. The challenge now will be can these buyers follow through on Wednesday. The expectation is in inside the only slightly higher movement in this market.

From Shutdown Relief to AI Anxiety — Two Narratives Driving ESMarket Theme
The week began on a strong footing, driven by a bullish Sunday reopen in ES after news broke that the 43-day government shutdown was set to end, following the Senate’s late-night support for a potential agreement on November 9th. This relief catalyst created early upside momentum, pushing the index toward all-time highs (ATHs).
However, the tone shifted mid-week. The rally lost steam as markets refocused on a growing concern: the sustainability of current Tech and AI valuations. Investors are becoming more sensitive to the possibility of overstretched AI-related capital expenditure and an emerging bubble narrative, especially with heavyweight earnings and forward-guidance looming. This led to a rotation out of high-beta tech and into safer or less-extended sectors.
On the macro front, Fed speakers adopted a more cautious—if not outright hawkish—tone, emphasizing that a December rate cut is far from assured. The recent government shutdown created a backlog in key economic data releases, leaving policymakers and traders alike without clear visibility into the true state of the economy. The lack of data has amplified uncertainty and reduced the market’s conviction around the timing of any potential policy easing.
In short:
The market is caught between two opposing forces:
The optimistic narrative (shutdown resolved, path to ATHs, resilience in U.S. growth), and
The risk narrative (valuation excess, policy uncertainty, narrowing breadth).
This push-pull dynamic has resulted in compression rather than continuation, with a heavy focus on clarity from upcoming data and major earnings.
What is the Market Doing?
Last week formed an inside week, with the entire range trading within the prior week’s range and settling close to the previous week’s close. This signals indecision and balance, as neither buyers nor sellers had the conviction to push the market into expansion.
Current price action shows the market compressing between:
6875 — previous week’s VPOC / 27 Oct weekly VAL
6740— 13 Oct weekly VAH / 10 Nov weekly volume ledge
These levels are well-defined and respected. The upward trendline continues to hold, with multiple strong rejections signaling responsive buyers stepping in to bid prices back up.
The battle is now between buyers attempting to defend 6740 area which is also confluent with the daily trendline support, and sellers leaning on the overhead resistance close to 6875.
What to Expect in the Coming Week
The key line in the sand (LIS) this week:
→ 6755.25 — Previous week's settlement
Bullish Scenario
If 6755 holds as support, expect buyers to attempt a push toward:
6874.50 — previous week's VPOC
6905.5— weekly 1-SD volatility high
Anticipate responsive sellers in this area.
However, if price breaks above 6874.50 with pace and volume and accepts above it, the path opens for a retest of the ATHs as momentum players and trapped shorts fuel continuation.
Bearish Scenario
If the market accepts below 6755 and fails to reclaim it on any pullback:
First downside target: 6660 — 13 Oct weekly VAL
If buyers fail to respond there, expect an acceleration lower from long liquidation toward:
6605— weekly 1-SD volatility low
6504 — previous month's low (deeper target)
This scenario strengthens if the trendline breaks and sellers begin stepping down aggressively.
Neutral / Compression Scenario
If the market remains trapped between 6875 and 6740 with no breakout supported by pace and volume:
Expect two-way rotational trade
Continued compression and balance within the well-defined range
A buildup of energy that may resolve later in the week with data, earnings or fundamental catalysts
Conclusion
As we start the new week, ES remains tightly coiled between well-defined levels, with the market waiting for clarity from data, earnings, and policy signals. Whether we break from compression or continue to balance, the key will be how buyers and sellers respond around 6755 and whether there are new fundamental catalysts.
As always, I’d love to hear your view on the markets and ES this week? — Drop it below — and give it a boost so more of the community can join the conversation.
Glossary Index for all technical terms used:
VAH (Value Area High)
VAL (Value Area Low)
VPOC (Volume Point of Control)
SD (Standard Deviation)

AMP Futures - How to set alerts for Volume footprint chartsIn this idea we will demonstrate how to set alerts with Volume footprint charts.

ES1 - Can A Fartcoin Predict A FOMC CorrectionThis is not a high certainty call but there are warning in lower dominance meme coins that may perhaps be signalling bearish action in the crypto that may be part of a canon to signal bearish action post FOMC.
So, a speculative call, but I have adjusted risk based on this.
This analysis is shared for educational purposes only and does not constitute financial advice. Please conduct your own research before making any trading decisions.

ES - December 15th - Daily Trade Plan December 15th- Daily Trade Plan - 7am
*Before reading this trade plan, if you did not read yesterday's take the time to read it first! (You can view the posts in the related publication section) *
If my posts provide quality information that has helped you with your trading journey. Feel free to boost it for others to find and learn, also!
My daily trade plan and real-time notes that I post are intended for myself to easily be able to go back and review my plan and how I did from an execution perspective.
--------------------------------------------------------------------------------------------------------
Last week we closed around the same level as the previous week. While we tried to get above the 6925 level, we could not hold above it to keep the momentum heading higher.
This week we have some economic data coming out and we can expect some volatility as we head into the last week of heavy trading volume for the year. This week should set the tone for the remainder of the year.
The overnight session low is 6823 and we have some clear levels that have held since we rallied into the overnight session high of 6865 (as of writing this post). 6851 is our first immediate support and 6843 being a level that should hold if we want to keep going higher. Price is in a tough spot for new entries this am as we are looking to continue higher to back test the 6885 level. You might be able to find an entry on the back test of 6865 if we can clear it to 6870 then back test 6861-65
Key Levels Today -
1. 6843 - Flush and Reclaim (Lower Quality)
2. 6823 - Flush and Reclaim (High Quality)
3. 6801-05 - Flush and Reclaim (Highest Quality)
I will post an update around 10am EST
----------------------------------------------------------------------------------------------------------------
Purple = A Weekly Low (Current or Previous Week)
Blue = A previous day low (Day before or day in the past week)
Red - Overnight Session High/Low (Prior to my post)
White = Key Support/Resistance Levels

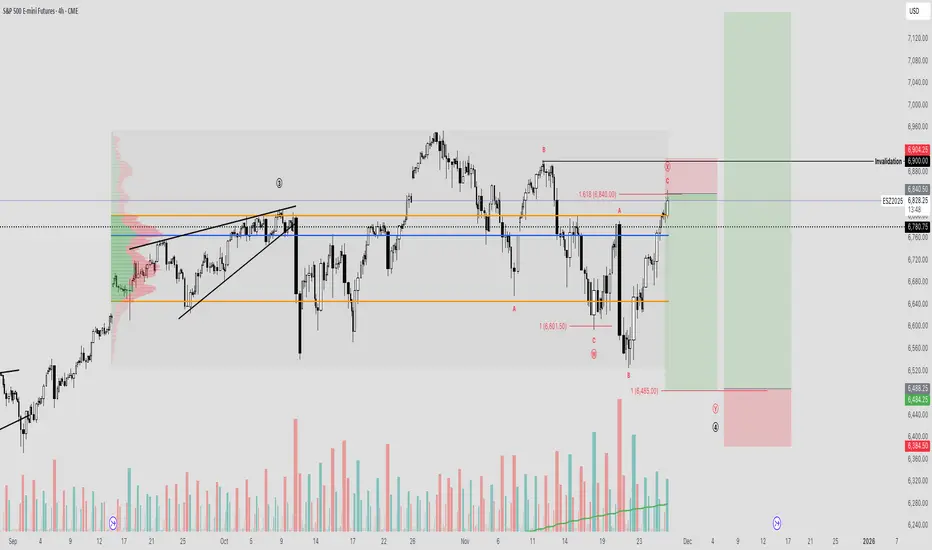
SPY: The Final Capitulation Before the Blow OffThe S&P 500 has experienced notably choppy price action over the past 60 days following the Federal Reserve’s rate cut. Many large-cap stocks most notably Nvidia, which saw a substantial rally have provided attractive profit-taking opportunities. Since then, the broader market has been trading sideways and, more specifically, within a local downtrend over the last 30 days.
From an Elliott Wave perspective, this pullback may be unfolding as a complex WXY corrective structure. A WXY pattern is essentially a series of connected ABC corrections each consisting of a three-wave “measured moves" that collectively form a more drawn-out and often more intricate consolidation phase. These moves can be mathematically projected using fibonacci.
The purpose of such a correction is typically to cool off the market after an extended rally. This cooling phase can manifest as a meaningful price decline, a time-based consolidation, or a combination of both. Ultimately, it allows market sentiment to reset and establishes a balanced range from which a stronger, more sustainable breakout can occur.
The main point of uncertainty lies in whether the W wave has been correctly identified. The subsequent X wave appears to form an expanding flat structure composed of three waves, ending with an impulsive move that taps the 1.618 extension—aligning well with typical Fibonacci market mathematics.
If a final Y-wave leg lower is still ahead, we have a clearly defined 1% invalidation level. Below that, a deeper sweep of the previous low becomes possible, allowing us to draw a trend-based Fibonacci extension from the W and X pivots to project a potential termination point for wave Y.
I’ll be closely monitoring this lower region, as it could present an excellent buying opportunity—one that could position the market for significantly higher upside targets and, at minimum, a retest or sweep of the current all-time highs.
ES (SPX, SPY) Week-Ahead Analysis (Dec 15-19, 2025)Market Overview: The Week Ahead
This week marks a pivotal moment for the markets as focus shifts from narratives to hard data. Key economic indicators will be released, including U.S. jobs figures on Tuesday and the Consumer Price Index (CPI) on Thursday, both scheduled for 8:30 AM ET. Additionally, the Bank of Japan will convene on December 18-19, with a consensus anticipating a 25 basis point hike, bringing rates up to 0.75%.
In a week filled with significant releases, we often see market behavior akin to a compressed spring - characterized by volatility as traders await fresh data, followed by a rapid price adjustment once new information emerges.
Historically, the most lucrative trading opportunities materialize at the edges of established price ranges, rather than in the middle.
Technical Analysis: Trading Structure
Weekly Outlook
The broader market structure remains constructive, although current trading suggests we may be nearing what appears to be a “ceiling zone” following a recent advance. This level could facilitate rapid upside movements, albeit sustained acceptance is proving more challenging. Notably, momentum is easing rather than collapsing.
Daily Perspective
The daily market profile indicates a potential recovery phase following significant liquidation. Buyers seem to be regrouping to establish a solid base, while sellers are actively defending against upside pressures. This dynamic often results in pronounced intra-day fluctuations but tends to exhibit limited follow-through absent a triggering catalyst.
4-Hour Analysis
Recent trading patterns align with a classic sequence: an initial impulse downward followed by a corrective consolidation. In such market conditions, rallies hitting resistance levels are often mere tests rather than true breakouts until prices can convincingly maintain levels above key ceilings.
On an intraday basis, the market is currently in a tight range above the Volume Weighted Average Price (VWAP), frequently encountering resistance at the same overhead levels. This setup typically leads to one of two outcomes: either a pop-and-fail at resistance which presents a clear short opportunity or a flush-and-reclaim at support offering a viable entry for longs.
Investors should remain alert for market responses to the upcoming economic data, as this will likely set the tone for price movements in the days ahead.
Risk Pricing Analysis: Current Market Sentiment
As we assess the current market landscape, it's clear that we are not in a state of panic; however, there are signs that market participants are pricing for potential tail risks.
The VIX spot index stands at 15.74 as of December 12, indicating a moderate level of volatility expectations. Similarly, the MOVE index, which measures the volatility of interest rates, is at 69.25 on the same date, reflecting some instability in that realm.
In credit markets, we see a High Yield Option-Adjusted Spread (OAS) of 2.88 on December 11, suggesting that conditions remain orderly despite the slight increase in risk premiums. Notably, the SKEW index is currently at 153.59, indicating that crash insurance is priced considerably rich compared to historical norms, signaling investor concerns about downside risk.
The put/call ratio is at 0.91 with a 10-day moving average of 0.86, which does not indicate extreme levels of fear among traders. Additionally, market breadth reflects a somewhat subdued environment, with 221 advancing stocks versus 280 declining stocks on December 12. While this does not signify outright capitulation, it suggests that overall market strength is lacking.
In summary, the prevailing market conditions appear to favor sharp reactions to new catalysts, with the expectation of mean-reversion unless volatility in credit and rates begins to escalate.
The catalyst calendar that can flip the trend
Tuesday Dec 16 - 08:30 ET
US Employment Situation for November is scheduled for release.
Thursday Dec 18 - 08:30 ET
US CPI for November is scheduled for release, plus Real Earnings.
Important nuance for this CPI
Because of the 2025 lapse in appropriations, the CPI release has documented limitations (missing October data prevents some 1-month changes from being published). That can widen the interpretation range and produce bigger price swings than a normal CPI day.
Thursday Dec 18 (global central banks)
• BoE is widely expected to cut 25 bp to 3.75%.
• ECB is expected to hold the deposit rate at 2% next week.
BOJ Dec 18-19
Baseline expectation is a 25 bp hike from 0.50% to 0.75%, with guidance as the bigger lever.
**Why the Bank of Japan Influences U.S. Stocks: An Analytical Perspective**
The Bank of Japan (BOJ) functions as a global “funding thermostat.” When its monetary policy is anchored near zero, it indirectly fosters a stable environment for risk assets globally, as funding remains inexpensive and reliable. Conversely, tightening measures from the BOJ can ripple through financial markets, impacting not only Japan but also the broader global financial system.
Here’s a breakdown of how BOJ actions affect U.S. stock indices:
1. Yen Channel (Risk Appetite):
A rate hike or hawkish signals from the BOJ typically strengthen the Japanese yen. A stronger yen can compel investors to trim risk exposure in their portfolios, especially in positions sensitive to foreign exchange fluctuations and funding costs. This de-risking effect often hits high-beta equities first, leading to notable adjustments in U.S. markets.
2. Global Discount-Rate Channel (Valuations):
As Japanese yields rise and global term premiums stabilize, the discount rate applied to U.S. equities tends to increase. This scenario generally poses challenges for long-duration equities, particularly growth-oriented stocks. A decline in this growth-heavy leadership can drag down the overall index, even amid a stable economic backdrop.
3. Cross-Border Flow and Hedging Channel (Subtle Pressure):
Japan is a significant investor in foreign assets (especially US). Changes in domestic yields can alter the appeal of these foreign investments and the associated hedging costs. It’s not necessary to witness a dramatic repatriation for market movements to occur; even modest reallocations, coupled with adjustments in hedging strategies, can tighten financial conditions incrementally.
4. Timing Channel (Gaps):
The BOJ typically makes its announcements during U.S. off-hours, heightening the likelihood of gaps in futures trading (like the E-mini S&P 500). Such gaps can disrupt typical intraday trading patterns, forcing traders to navigate wider risk parameters as they react to fresh information.
Practical Implications:
A surprise hawkish stance from the BOJ increases the odds of the E-mini S&P 500 testing lower support levels initially (S2 followed by S3/S4). Conversely, if the BOJ’s communication aligns with market expectations and is accompanied by a calm demeanor, the resultant market reaction may function as a temporary impetus, quickly yielding the spotlight back to upcoming U.S. jobs data and CPI readings.
Geopolitics and Inflation: Key Insights for the Week Ahead
This week, energy risk has resurfaced on the market’s radar. The U.S. seizure of the Venezuelan oil tanker M/T Skipper, accompanied by intensified enforcement actions, has disrupted Venezuelan export flows and sparked increased discussions about potential supply disruptions. These developments are crucial, as headlines related to oil tend to boost inflation expectations, particularly just before the Consumer Price Index (CPI) release.
The situation in the Middle East remains precarious, with ongoing developments regarding the stability of a ceasefire in Gaza heightening sensitivity to geopolitical headlines. This uncertainty adds an additional layer of complexity to market dynamics.
Meanwhile, the normalization of shipping routes is unfolding at a sluggish pace. A return to operations in the Suez/Red Sea lanes is expected to be a gradual process, with estimates suggesting a 60-90 day transition period once it officially commences.
On the economic front, the tone surrounding China’s growth appears to be softening. Recent figures show November industrial output rising by 4.8% year-over-year and retail sales increasing by just 1.3% year-over-year, indicating a weakening momentum in demand.
Analysts will be closely monitoring these developments, as they could significantly influence market trends and inflation forecasts in the near term.
Navigating NY Sessions with Precision
In analyzing the upcoming New York trading sessions, it’s crucial to establish a clear scenario map that demarcates potential trading paths based on market behavior around key data releases.
The most probable trading scenario is expected to involve two-way trades within established price shelves, characterized by potentially sharp price movements during the Tuesday and Thursday 08:30 data releases. Historically, such movements have a tendency to mean-revert towards the Volume-Weighted Average Price (VWAP) and Point of Control (POC) unless the incoming data significantly deviates from market expectations.
For traders anticipating a bearish extension, key triggers include sustained price acceptance below 6828.50, the Yearly Point of Control (Y-POC), followed by failure to reclaim 6810.50 (Yearly Value Area Low). Acceptance below 6805.00 the previous day’s low would solidify this bearish outlook. In this scenario, any rallies are likely to be viewed as opportunities to “sell the bounce” until a market reclaim signifies strength.
Conversely, a bullish surprise may unfold if prices hold above 6850.00, particularly post-data release. A reclaim of the 6889.50 to 6896.25 range, establishing it as a support floor, could trigger a short squeeze, pushing prices towards 6903.00 and subsequently 6915.50. This bullish path would be contingent on genuine acceptance above these levels.
Trading Execution Strategy
To navigate these scenarios effectively, traders should focus on optimal execution windows during the New York AM session from 09:30 to 11:00, and in the PM session from 13:30 to 16:00. It’s advisable to treat the Tuesday and Thursday 08:30 data releases as distinct trading regimes; traders should observe initial market impulses before seeking to capitalize on subsequent moves from established price shelves.
Risk management is paramount. A pass-fail gate is established whereby the first take profit (TP1) should be positioned at a minimum of 2.0 times the risk from the predefined stop, ideally anchored to a 15-minute candle wick or market structure. Limit trading attempts to two per level per session, implementing daily guardrails to exit positions at a loss of -2R and securing profits at +3R.
Good Luck !!!

ES UpdateI think ES bounces when NA hits oversold, but there is a chance that ES needs to go oversold too.
Recommend waiting until Monday to go long.

Cautious marketThe daily chart in the S&P 500 implies a cautious market as it awaits for additional economic reports coming out this week. The current bias for this market is to the downside. The expectation for Tuesday is an inside day.


Slightly lowerThe Friday structure on the daily chart in the S&P 500 implies further movement to the downside a smaller range with the objective lower at 6780.

ES (SPX, SPY) Analysis, Levels, Setups for Fri (Dec 12)CONFIRMED EVENTS - FRI 12/12 (ET)
13:00 - Baker Hughes U.S. rig count
15:30 - CFTC Commitments of Traders (COT) release (usual time)
Theme risk: liquidity headlines remain in play with the Fed starting reserve-management T-bill buying on 12/12 (not a data print, but worth respecting).
Market Analysis: Pre-Market Overview
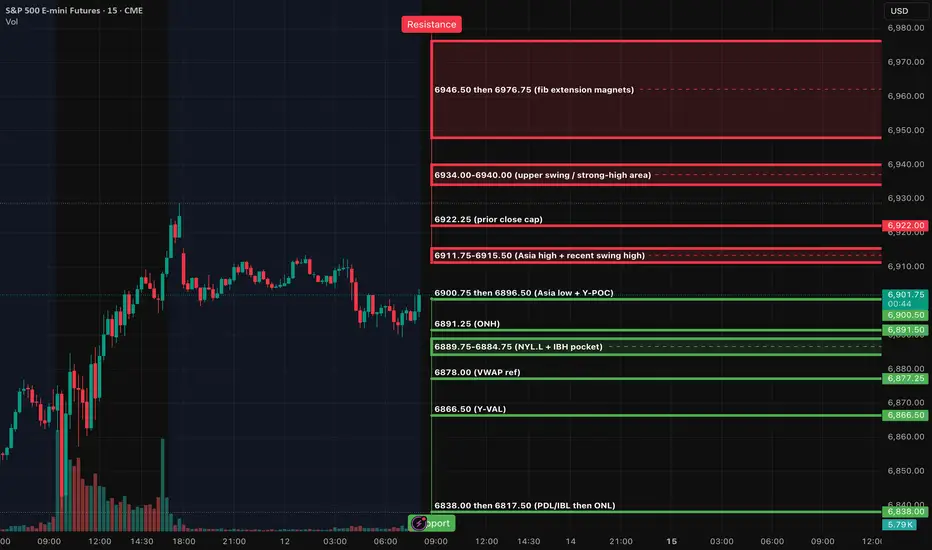
As we approach the market open, the ES is currently positioned near the main pivot point at 6896.50 (Y-POC). Overnight trading saw a rise to the 6911.75-6912.50 range, but prices have since retraced back below a critical resistance zone at 6908.50-6909.25, which includes the year’s value area high (Y-VAH) and the previous day’s high (PDH). This dynamic suggests a cautious trading atmosphere characterized by “tight range first, trend second,” unless we witness a definitive reclaim above this resistance.
When ES gets this tight, it usually means liquidity is being packed for a pop (either direction). The trap is overtrading inside the middle of the box.
Right now the clean box is:
• Premium zone: 6900.75 then 6908.50-6909.25
• Bottom zone: 6892.00 then 6889.75
Key Resistance Levels:
- 6900.75: Asia session low
- 6908.50-6909.25: Significant resistance from Y-VAH and PDH
- 6911.75-6912.50: Upper threshold to watch
If buyers can maintain a position above 6909.25 for 15 minutes, it may set the stage for a rally towards 6922.25, aligning with prior closing levels.
Key Support Levels:
- 6892.00: London session low
- 6891.25: Overnight high
- 6884.75: Further potential support
- 6878.00: Continued downside target
- 6866.50: Year’s value area low (Y-VAL)
A decisive move below 6892.00 could trigger a morning pullback towards the 6884.75-6878.00 zone, with 6866.50 acting as a deeper support reference.
Today’s market activity will likely be influenced by developments in the semiconductor sector. Broadcom is placing pressure on the AI space due to concerns over margins, while Nvidia's outlook is being scrutinized in light of recent China-related headlines. Traders should brace for increased volatility around the 6900 and 6909 levels as movements in semiconductor stocks unfold.
The only significant intraday economic release scheduled is the Baker Hughes rig count, expected at 1:00 PM ET. Investors should also note that larger US economic data releases are anticipated next week, following a backlog caused by the recent government shutdown.
A++ SETUP 1 - REJECTION FADE (SHORT) from 6911.75-6915.50
15m pushes above 6911.75/6915.50 and closes back below 6909.25 - then 5m retest fails - then 1m first pullback gives LH.
Entry: 6909.75-6911.25
Hard SL: 6916.25 (above the rejection wick)
TP1: 6896.50
TP2: 6884.75
TP3: 6878.00
A++ SETUP 2 - ACCEPTANCE CONTINUATION (LONG) above 6922.25
15m full-body close above 6922.25 - then 5m pullback holds 6915.50-6911.75 and re-closes up - then 1m HL to enter.
Entry: 6916.00-6918.00 (on the hold)
Hard SL: 6908.25 (below the hold + back under PDH/Y-VAH area)
TP1: 6934.00
TP2: 6946.50
TP3: 6976.75
Good Luck