S&P 500 (ES1!): Bullish! Wait For Valid Buy Setups!Welcome back to the Weekly Forex Forecast for the week of Oct. 27 - 31st.
In this video, we will analyze the following FX market: S&P 500 (ES1!)
The S&P500 closed last week at ATHs. I expect more of the same next week.
Look for valid dip buying opportunities, my friends.
If the market disrespects the +OB, then buys become invalidated.
Enjoy!
May profits be upon you.
Leave any questions or comments in the comment section.
I appreciate any feedback from my viewers!
Like and/or subscribe if you want more accurate analysis.
Thank you so much!
Disclaimer:
I do not provide personal investment advice and I am not a qualified licensed investment advisor.
All information found here, including any ideas, opinions, views, predictions, forecasts, commentaries, suggestions, expressed or implied herein, are for informational, entertainment or educational purposes only and should not be construed as personal investment advice. While the information provided is believed to be accurate, it may include errors or inaccuracies.
I will not and cannot be held liable for any actions you take as a result of anything you read here.
Conduct your own due diligence, or consult a licensed financial advisor or broker before making any and all investment decisions. Any investments, trades, speculations, or decisions made on the basis of any information found on this channel, expressed or implied herein, are committed at your own risk, financial or otherwise.
Trade ideas

S%P DROP AND GIVE ME 50....50K PLEASE LOLBias is BEARISH!
Hear me out tho lol!
First, we never predict; we estimate and wait! Price will tell us where it wants to go. Based on my estimate, we have big news this week that does not look very positive and could negatively affect American businesses and stocks, potentially leading to central sell pressure in the market. That, paired with no significant pullback on the D/HTF's, makes me estimate we should have nice sell ops.
4H Golden zone is around 6,809-50% and 6,801-.618%! (Great buy bounce area)
after that we have some IPP'S (important price points)
6,840 If passed and closed above we can see move to even HH's!
or
If we see a rejection to 6,801 price area we can see a dump taking out session IPP's and pushing to lower FVGs! (what I want lol)
so we are going to let the market play, while we wait....and GET PAID!!
GDluckThisWeek!

Follow through on Monday is expectedWith the momentum shown on the daily chart in the S&P 500 follow through to the upside would be expected but not a large move.

A confident close is expectedA higher close on Friday is expected in the daily S&P chart which would indicate buyer confidence.

S&P 500 E-mini: Testing Upper Channel Resistance – Potential ShoThe S&P 500 E-mini is approaching the upper boundary of a rising channel on the 1-hour chart, facing resistance near 6,762.50. The MACD is showing bearish momentum with red histogram bars, indicating weakening buying pressure. Price action suggests a potential short opportunity if the resistance holds, targeting a move back toward the channel’s midline support around 6,700. Watch for confirmation before entering.

NQ & ES Premarket Comment Thursday 23-10-2025Good morning everyone,
Today the market is sitting in a balanced zone — we’re essentially in equilibrium. This means that price action could develop in either direction, and we need to stay open to both scenarios. It might initiate a move higher or lower, or simply oscillate within a defined range — a classic “ping-pong” session.
As the session opens, if we see price sweep the previous day’s low, that could offer a potential long setup. Conversely, if we get a strong impulse to the upside early on, we can start looking for potential short opportunities afterward.
What happens in the first few minutes after the open will be critical today — it should give us clarity on directional intent. The key levels to watch are clearly marked on the chart.
If you don’t feel confident or the picture remains unclear, do nothing. Staying on the sidelines is a valid position on days like this.
Normally I provide live commentary during sessions like this, but today I won’t be doing so. Stay calm, disciplined, and aligned with your trading plan and risk parameters.
We’ll review everything in the afternoon update to see how the session played out.
PF

ES UpdateES MFI is oversold, RSI never hit it, which is why I was saying possible melt up on ES.
We'll see what happens today, I'm guessing tomorrow will be a CPI (delayed release) pump.

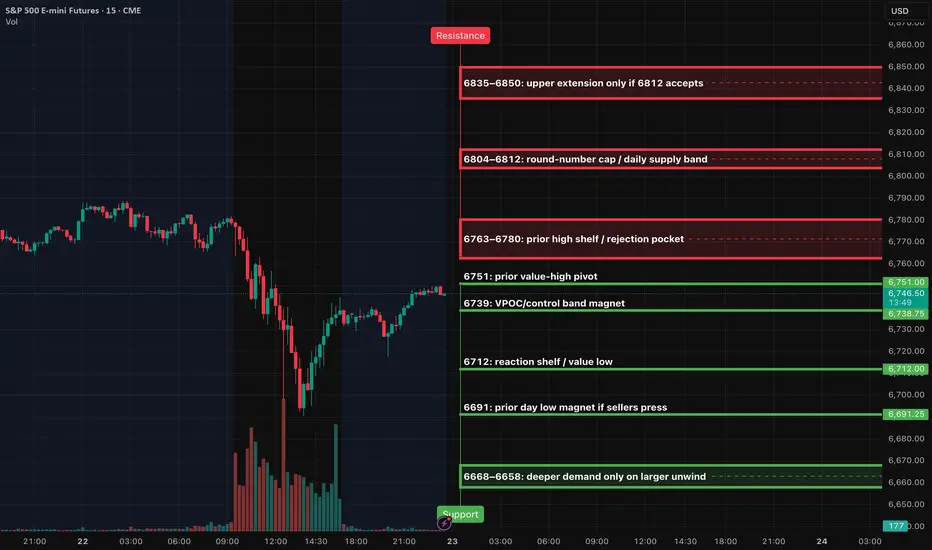
ES (SPX, SPY) Analysis, Key Levels, Setups for Thur (Oct 23)Bias: The market shows a neutral to slightly bullish outlook as long as prices remain above the 6739–6751 control band. A decisive break and sustained trading above 6780 would indicate a shift in momentum to the upside, targeting the levels of 6804 to 6812. Conversely, if we lose support at 6739, we could see a decline toward 6712, with 6691 serving as a key level that may attract selling pressure.
Execution windows: London 02:00–05:00 optional small size. NY AM 09:30–11:00 primary. NY PM 13:30–16:00 primary. Midday is manage-only; avoid initiating.
Setups
Short pop-and-fail at 6773–6780
– Trigger: 15m rejection back inside the band → 5m re-close below ~6773 → first 1m pullback stalls beneath 6773
– Entry: sell the pullback beneath 6773
– Stop: hard SL above the 15m rejection wick by 0.25–0.50
– Targets: TP1 6751, TP2 6739, TP3 6712
– Invalidation: 6780 converts to support on a full-body 15m close
Long breakout continuation above 6780
– Trigger: 15m full-body close beyond 6780 → 5m pullback holds 6777–6780 and re-closes up → 1m higher-low entry
– Entry: buy the hold at 6777–6780
– Stop: hard SL below the 15m trigger wick by 0.25–0.50
– Targets: TP1 6804, TP2 6812, TP3 6835–6850
Long sweep-and-reclaim at 6712 → 6691
– Trigger: quick sweep of 6712 (or flush toward 6691) that immediately reclaims 6712 on 5m → 1m higher-low entry
– Entry: buy first pullback after the reclaim of 6712
– Stop: hard SL below the 15m sweep wick by 0.25–0.50
– Targets: TP1 6739, TP2 6751, TP3 6773–6780
Catching its breathI am looking for an inside day on the daily chart in the S&P 500 as the market catches its breath with an inside day on Thursday

NQ & ES Premarket Comment Wednesday 22-10-2025NQ & ES Premarket Comment Wednesday 22-10-2025:
Good morning everyone,
Price remains at elevated levels, and for that reason, I believe a corrective move to the downside is likely before the market resumes its broader bullish trend. One of the key indications supporting this view is that the YM has broken above its all-time highs (ATH), while the NQ and ES have not — creating an SMT divergence, which often signals potential reversal conditions.
On the chart, two purple lines are clearly visible. I’ve divided and measured the candle structure in two different ways, resulting in two potential support zones. Once price moves below either of these, it could provide the momentum needed for a continuation higher.
The lower purple line represents the stronger support level, although the first one also remains a valid short-term zone of interest. Exercise caution with longs around the first support, as setups near the second level are likely to offer cleaner, higher-probability opportunities.
It’s not impossible that we may see a short opportunity develop before price reaches the support zones, but such a trade would be highly speculative and carries elevated risk. Until we get clearer confirmation, patience remains the best approach — let’s wait to see how the market reacts at support.
If neither of these scenarios unfolds, we simply stay on the sidelines, observe, and learn from the price action while maintaining discipline until our bias aligns with our model’s framework.
I’ll post an updated commentary in the afternoon.
Wishing everyone a productive trading session.
PF
Disclaimer: This analysis reflects personal market observations and is for educational purposes only. It does not constitute financial advice.

ES (SPX, SPY) Analysis, Key Levels, Setups for Wed (Oct 22)Key catalysts and schedule (ET): The federal shutdown continues, pausing most government statistics. There is no 8:30am tier-1 macro release expected. The energy markets will receive the EIA Weekly Petroleum Status Report at 10:30am. Of particular note, the Fed’s Michael Barr is scheduled to speak during the U.S. day, a potential market-moving event. Earnings reports from AT&T, Thermo Fisher, Boston Scientific, and Vertiv before the open, and IBM after the close, could also sway the index mood.
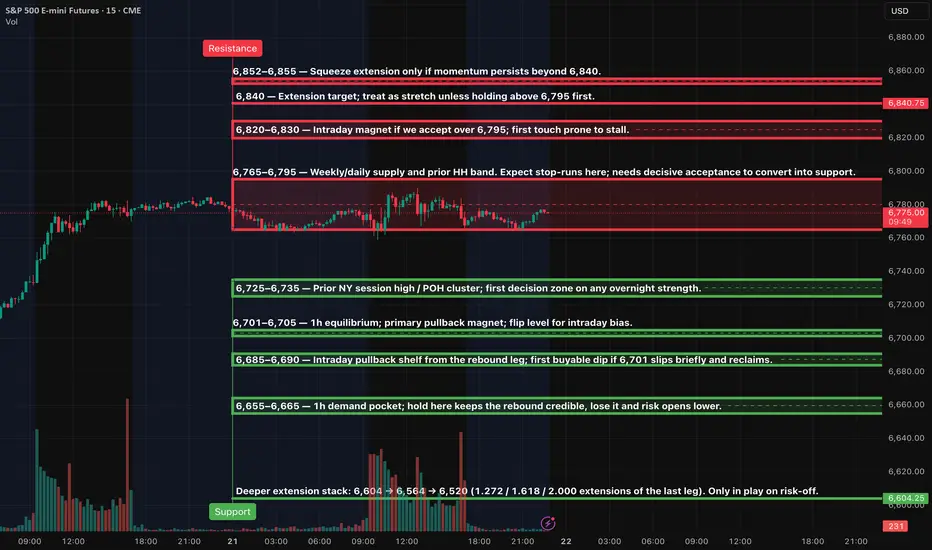
Key zones — resistance: The 6,765–6,795 zone, serving as the weekly/daily supply and prior high-high band, remains a crucial area of focus. It is the first ceiling to consider. The 6,820–6,830 zone becomes an intraday magnet if we manage to hold above 6,795. The 6,840 stretch target is a significant level that requires time above 6,795 first. The 6,852–6,855 zone is a potential squeeze extension, but only if momentum persists beyond 6,840.
Key zones — support: 6,725–6,735 is the prior NY session high / POH pocket and first decision area on any overnight strength that fades; 6,701–6,705 is the 1h equilibrium and flip line for intraday bias; 6,685–6,690 is the intraday pullback shelf and first buyable dip if 6,701 briefly slips and reclaims; 6,655–6,665 is the 1h demand pocket that keeps the rebound credible; 6,604 is the deeper extension stack that only comes into play on risk-off.
Overnight → NY forecast: baseline expectation is a range build under the 6,765–6,795 ceiling with stop-runs into the band and fades back toward 6,735 and 6,705; acceptance and sustained holding above 6,795 turns the tape constructive toward 6,820–6,830, with a paced push to 6,840 and only a momentum extension opening 6,852–6,855; loss of 6,701 during Asia/London that does not quickly reclaim tilts the path toward 6,690 and 6,665 before buyers try again; if 6,665 gives way decisively, risk opens to 6,604 where a larger bounce attempt is favored.
Setups (Level-KZ Protocol, 15m→5m→1m)
Short fade at the 6,765–6,795 band on the first clean test: enter on a 15m close back inside the band and a 5m re-close with a lower-high; place SL above 6,805–6,810; target 6,735 for TP1, 6,705 for TP2, 6,690 for TP3; if TP1 prints, close 70% and set the 30% runner to BE.
Long continuation only after real acceptance above 6,795: wait for a 15m full-body close above, then buy the 5m pullback that holds 6,795–6,800; SL 6,785; target 6,820–6,830 for TP1, 6,840 for TP2, 6,852–6,855 for TP3.
Quick-reclaim bounce at 6,701–6,705: if we sweep 6,701 and instantly reclaim on 1m/5m, buy the reclaim with SL 6,695; target 6,735 for TP1, 6,771–6,780 for TP2, 6,795 test for TP3.
Deeper flush-and-reverse at 6,655–6,665: buy only on confirmation (15m wick-rejection + 5m higher-low); SL 6,649; target 6,690 for TP1, 6,705 for TP2, 6,735 for TP3.
Bear continuation only if 6,701 is lost and holds below: sell the underside retest of 6,701–6,705; SL 6,712; target 6,690 for TP1, 6,665 for TP2, 6,604 extension for TP3 if momentum expands.
Bias and invalidation: The market currently exhibits a ' two-sided bias ', meaning it is neither bullish nor bearish, while we are trapped between 6,705 and 6,795. The tape turns constructive for extensions only after holding above 6,795 for multiple 15m closes. The intraday bias flips lower if we slip and cannot reclaim 6,701 on 15m closes. Invalidate any long if 6,665 breaks and holds; invalidate any short if we base above 6,830 and the first pullback defends 6,820.
Kill-zones and execution plan: Asia (20:00–00:00 ET) is optional and sized down; look for the 6,701 sweep/reclaim; London (02:00–05:00 ET) favors range probes into 6,735 or 6,705; NY AM (09:30–11:00 ET) is primary — fade the first touch of 6,795 if we gap under it, or buy the 6,795 pullback if we gap and hold above; manage lunch as maintenance only (12:00–13:00 ET); NY PM (13:30–16:00 ET) allows a final push toward 6,840 only if 6,820–6,830 converts to a floor.
Risk and management rules (applied to all plays): use a hard stop anchored to the relevant 15m wick ±0.25–0.50; take no partials before TP1; at TP1 close 70% and move the runner to BE; allow no more than two attempts per level per session; time-stop any trade that hasn’t hit TP1 or SL within 45–60 minutes.
S&P 500 (ES1!): Wait For Valid Buy Setups!Welcome back to the Weekly Forex Forecast for the week of Oct. 20-24th.
In this video, we will analyze the following FX market: S&P 500 (ES1!)
The S&P500 is ranging. More neutral than bullish. But Friday's bullish close indicates potential bullish order flow going into this week.
If price can manage to trade above the Monthly Open at 6,725, than buys become valid.
I'm not interested in selling this market, unless I see a sure enough bearish BOS.
Enjoy!
May profits be upon you.
Leave any questions or comments in the comment section.
I appreciate any feedback from my viewers!
Like and/or subscribe if you want more accurate analysis.
Thank you so much!
Disclaimer:
I do not provide personal investment advice and I am not a qualified licensed investment advisor.
All information found here, including any ideas, opinions, views, predictions, forecasts, commentaries, suggestions, expressed or implied herein, are for informational, entertainment or educational purposes only and should not be construed as personal investment advice. While the information provided is believed to be accurate, it may include errors or inaccuracies.
I will not and cannot be held liable for any actions you take as a result of anything you read here.
Conduct your own due diligence, or consult a licensed financial advisor or broker before making any and all investment decisions. Any investments, trades, speculations, or decisions made on the basis of any information found on this channel, expressed or implied herein, are committed at your own risk, financial or otherwise.

ES UpdateMFI has been overbought for 2 days now. No idea what this is doing. I bought IWM puts when it went green, and I was looking at my computer thinking "sell off already", lol. It looked like the algos were trying to get RSI to overbought. Maybe they still will, NFLX doesn't faze the algos.
Even in a melt up, what "should" happen is that the market dips as the algos sell off. It's not acting the way I expect, so be careful shorting.

ES - October 21st - Daily Trade PlanOctober 21st - 7:30am
*Before reading this trade plan, IF, you did not read yesterdays, or the Weekly Trade Plan take the time to read it first! (You can see both posts in the related publication section) *
If my posts provide quality information that has helped you with your trading journey. Feel free to boost it for others to find and learn, also!
My daily trade plan and real-time notes that I post are intended for myself to easily be able to go back and review my plan and how I did from an execution perspective.
----------------------------------------------------------------------------------------------------------------
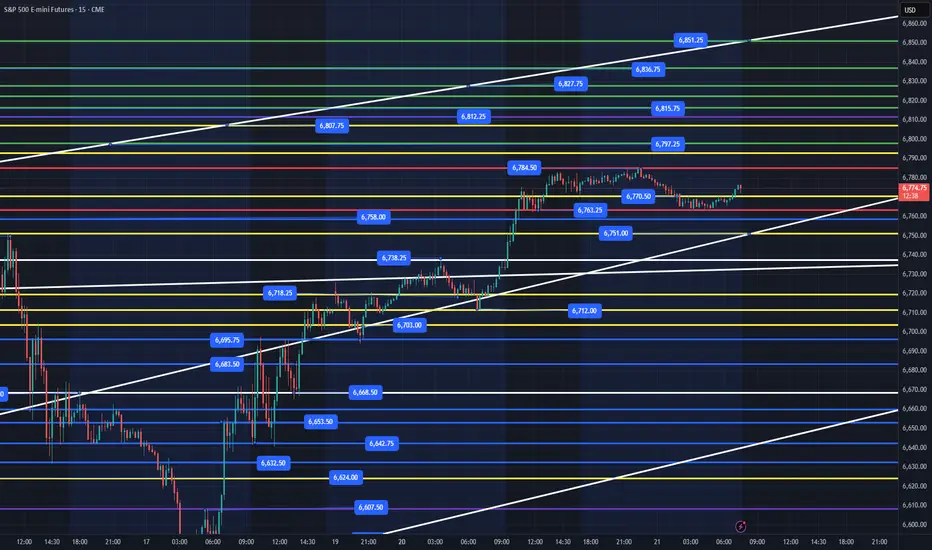
Our overnight high is 6784 and overnight low is 6763. Very tight range that should resolve higher today. Ideally, we can get a pull back to the 6750 area and reclaim 6758, 6763. Any price action below 6763 and a quick reclaim would be bullish. IF, price does clear 6784 we could get to 6791, 6800 as first targets and 6812 being a heavy resistance area. IF, price clears then fall back inside the overnight range, we could then lose the 6770, 6763 level and would not want to see price lose 6738 or we may need to retest 6703 area which has been tested a ton over the week and it is also the bull/bear line, I have been discussing since last week.
Key Levels Today:
1. Loss of 6770 and reclaim
2. Loss of 6763 and reclaim (Potentially down to 6758)
3. Loss of 6750 and reclaim
Price below 6738 and we will probably need to retest the 6703 level.
We have to remain bullish with price above 6695
Key Support Levels - 6770, 6763, 6750, 6738, 6712, 6703, 6695
Key Resistance Levels - 6784, 6797, 6807, 6812, 6815, 6827, 6836, 6851
I will post an update around 10am EST.
----------------------------------------------------------------------------------------------------------------
Couple of things about how I color code my levels.
1. Purple shows the weekly Low
2. Red shows the current overnight session High/Low (time of post)
3. Blue shows the previous day's session Low (also other previous day's lows)
4. Yellow Levels are levels that show support and resistance levels of interest.
5. White shows the trendline from the August lows
Tuesday, Oct 21st Weekly Forecast UPDATES!Welcome to the Weekly Forecast Updates!
In this video, we will analyze the following markets: DXY, EURUSD, GBPUSD, NASDAQ, S&P500
Enjoy!
May profits be upon you.
Leave any questions or comments in the comment section.
I appreciate any feedback from my viewers!
Like and/or subscribe if you want more accurate analysis.
Thank you so much
Disclaimer:
I do not provide personal investment advice and I am not a qualified licensed investment advisor.
All information found here, including any ideas, opinions, views, predictions, forecasts, commentaries, suggestions, expressed or implied herein, are for informational, entertainment or educational purposes only and should not be construed as personal investment advice. While the information provided is believed to be accurate, it may include errors or inaccuracies.
I will not and cannot be held liable for any actions you take as a result of anything you read here.
Conduct your own due diligence, or consult a licensed financial advisor or broker before making any and all investment decisions. Any investments, trades, speculations, or decisions made on the basis of any information found on this channel, expressed or implied herein, are committed at your own risk, financial or otherwise.

ES (SPX, SPY) Analysis, Key Levels, Setups Tue (Oct 21)Market Update for Traders:
Context:
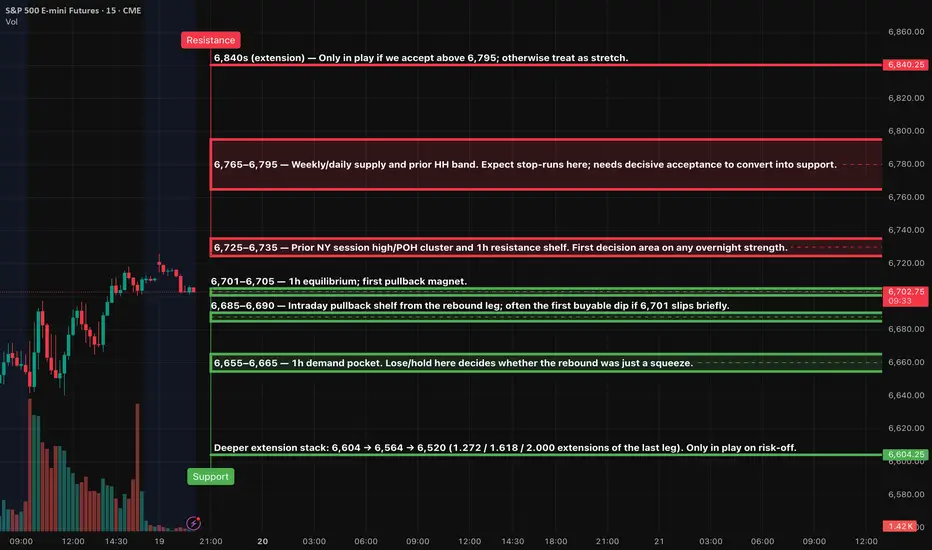
Currently, the price is approaching a key supply zone between 6,765 and 6,795. While we have seen a series of higher highs on the 1-hour chart, the momentum appears to be flattening. Below this supply level, we have identified some significant areas to monitor. The first clean value area on the 1-hour chart is around 6,701 to 6,705, with a visible pullback shelf located between 6,685 and 6,690. There's also a stronger demand zone in the 6,655 to 6,665 range. If we manage to break above the supply cap at 6,795, the next measured extension target is around 6,840, but this should be treated as a stretch unless we see solid acceptance above 6,795.
Key Zones to Watch:
Resistance:
- 6,765–6,795 (this is the current cap)
- Extension potential at 6,840, provided we see firm acceptance above 6,795.
Support:
- Look for the first decision point around 6,725–6,735, which reflects overnight strength.
- 6,701–6,705 is a key equilibrium area.
- The shelf for the first buyable dip lies at 6,685–6,690.
- Further support is found in the demand pocket at 6,655–6,665.
- If we encounter a deeper risk-off scenario, watch for extensions down to 6,604, 6,564, and 6,520, but only if we see a decisive failure in the rebound.
Setups:
Setup 1 — Rejection Short at 6,765–6,795 (A++)
Entry: 6,788–6,793 after a 5m re-close back below 6,795 and a 1m lower-high
Stop (SL): 6,804.50 (above rejection wick/upper edge)
TP1: 6,729–6,733
TP2: 6,701–6,705
TP3: 6,686–6,690
Setup 2 — Acceptance Long above 6,795 (A++)
Entry: 6,796–6,799 on first pullback that holds after decisive 15m acceptance over 6,795
Stop (SL): 6,785.00 (back inside the band)
TP1: 6,822–6,828
TP2: 6,840 stretch
TP3: 6,852–6,855 if squeeze persists
Setup 3 — Quick-Reclaim Long at 6,701 (A+ Bounce)
Entry: 6,702–6,705 only if 6,701 briefly slips and then a 5m candle re-closes back above it
Stop (SL): 6,694.50
TP1: 6,729–6,733
TP2: 6,765–6,775
TP3: 6,788–6,793
Setup 4 — Shelf Long at 6,685–6,690 (A Bounce)
Entry: 6,686–6,689 with a 1m higher-low and 5m hold
Stop (SL): 6,678.00
TP1: 6,701–6,705
TP2: 6,729–6,733
TP3: 6,765–6,775
Setup 5 — Demand-Pocket Long at 6,655–6,665 (A Bounce)
Entry: 6,657–6,663 on stabilization and 1m higher-low
Stop (SL): 6,647.00
TP1: 6,686–6,690
TP2: 6,701–6,705
TP3: 6,729–6,733
Setup 6 — Breakdown Short if 6,701 Turns to Resistance (A+)
Entry: 6,698–6,701 after a 5m close below 6,701 and a retest that fails
Stop (SL): 6,707.50
TP1: 6,686–6,690
TP2: 6,665–6,660
TP3: 6,604–6,564 only if momentum stays risk-off
Management (apply to all)
take the setup only if TP1 ≥ 2.0R using the stated SL. At TP1 close 70% and set the 30% runner to break-even; runner attempts TP2→TP3 if structure supports it. Time-stop 45–60 minutes if neither TP1 nor SL is hit. Primary execution windows: NY AM 09:30–11:00 ET and NY PM 13:30–16:00 ET.

Buyers continue momentum to the upsideThe daily structure in the S&P 500 implies buyers have returned to the market and follow through to the upside would be expected. The next objective would be 6812.

#ES_F Daily TF Longer OutlookSince February break down price has broke out and traveled through two full Daily Ranges.
Roll Gap in September has pushed us into New Range which is around 640 - 940 +/- price holding over the Edge brought more buying but as we can see we only had enough strength to get pushes into VAL / Mean, every push over VAL had returns back towards lower Edge until the Flush on the 10th broke the trend after we reached and consolidated at the Mean. When there is a lot of strength inside the range price will usually travel at least through the mean into VAH which so far we have not done, the flush found HTF Support at Medium MA and below lower Edge which was able to take in all the selling and make price rotate back into the Mean to fill the Single Prints which we left on the way down.
Of course we can start holding over the smaller MA, the consolidation under can be considered as Support and price can continue grinding higher towards next targets into VAH but few things we have to think about, price spent over a month in this range since the roll gap got us in, we are inside New Range without strong transaction fully through it, lots of uncertainty going around even if things seem good, market has also made a huge move into here from February flush after hitting a big bid at 4800s without many breathers. We are also forming topping patterns up here if you are into patterns then those are clearly visible, this current bounce could be nothing more than a market rotation once selling was taken in and we popped back over smaller MA.
IF this buying doesn't stick over this MA and either start moving away over 6800s with holds over or doesn't hold/balance while it lets smaller MA catch up into us to give us a push higher then we could see price return back under Smaller MA and continue with Trend Change process which will require us holding and tightening up between Smaller and Medium MAs to then push us under lower Edge, IF that happens and we start holding under Medium MA and under VAL/Edge then than will change HTF Trend and could start a correction to current trend towards lower targets which would be VAH / Mean and at some point push Into and Under %5 correction, how much we would get from there we would have to see as areas under 6500 - 6400 is our bigger Cost Basis and could be where we would be taking in all this Supply and start building up again.
Something to remember is this is Larger TF outlook and over the years we got used to fast flushes, not spending much time at the lows with quick bounces away as everyone just kept buying every chance they get, it takes a while for one trend to finish and so far over the years every time trend tries to or changes into down trend it does not last long instead returns quick into uptrend, something I will be watching out for is for this time IF it happens to be more of a longer period or at least a longer consolidation at/around lows before trend changes to the upside again.
All being said we have to watch for IF this then that playing out from here to keep confirming this possibility as it may not happen at all but a lot of signs are currently pointing to this playing out. First steps would be no continuation over current Mean into above VAH and a return back towards Smaller MA/ VAL below us, then holding under Smaller MA would be where we would get more confirmation and start building up for next move.
IF This does not play out and instead market will stay in this New Range then what we could see happening is us finding balance and spending some time between current VAH / VAL with pushes above/below coming back inside without much continuation over or under.

NQ & ES After Hours Comment Monday 20-10-2025Ultimately, no high-probability opportunity presented itself today, as price simply continued to drift higher. The market did not create the conditions necessary for a confident trade.
We were trading within a Premium Zone, which meant our focus was solely on short opportunities—none of which materialized.
The lesson for today: sometimes the best trade is to stay on the sidelines. Days like this are when we cultivate discipline and consistency, proving to ourselves that we can stick to our plan and avoid unnecessary risk.
Back here tomorrow at 08:45 AM NY time (45 minutes ahead of the market open).
PF
Disclaimer: This analysis reflects personal market observations and is for educational purposes only. It does not constitute financial advice.

NQ & ES Premarket Comment Monday 20-10-2025These are the key levels and the main factors I’m watching for today.
We’re currently trading within a Premium Zone, and that alone speaks volumes about the market’s current positioning.
PF
Disclaimer: This analysis reflects personal market observations and is for educational purposes only. It does not constitute financial advice.

ES - October 20th - Daily Trade PlanOctober 20th - 6:32am
*Before reading this trade plan, IF, you did not read yesterdays, or the Weekly Trade Plan take the time to read it first! (You can see both posts in the related publication section) *
If my posts provide quality information that has helped you with your trading journey. Feel free to boost it for others to find and learn, also!
My daily trade plan and real-time notes that I post are intended for myself to easily be able to go back and review my plan and how I did from an execution perspective.
----------------------------------------------------------------------------------------------------------------
Our overnight high is 6738 and our overnight low is 6695. I mentioned on Friday that we needed to hold the 6703 level for us to continue higher. We have been chopping around above 6703 since Friday afternoon. You can clearly see that we tested 6695 on Friday afternoon 3x, before clearing that level, gapping up at the open on Sunday evening and then closing that gap and holding the 6695 resistance now turned into support! 6570 was our low overnight Thursday/Friday and I do not think we reach that level today. Let's look and find other areas that could be good areas to grab points today.
Key Levels for Today:
1. Loss of 6718 and reclaim
2. Loss of 6695 and reclaim
3. Loss of 6668 and reclaim
4. Loss of 6642 and reclaim
Price below 6642 and we will need to see a flush and reclaim of 6632 or we will need to wait patiently for the 6591 or 6570 levels.
Key Support Levels - 6718, 6703, 6695, 6683, 6668, 6653, 6642, 6632, 6624, 6607, 6591, 6570
Key Resistance Levels - 6738, 6749, 6767, 6779, 6797, 6815
We have to remain bullish with price above 6695. 6765 is a key resistance and that level needs to clear for us to really continue higher. We could easily chop around between 6750-6695 today and continue to work inside this range. We can't be bearish until we see price lose 6642, with 6624 being the very lowest or we will be going to retest Friday's lows.
I will post an update around 10am EST.
----------------------------------------------------------------------------------------------------------------
Couple of things about how I color code my levels.
1. Purple shows the weekly Low
2. Red shows the current overnight session High/Low (time of post)
3. Blue shows the previous day's session Low (also other previous day's lows)
4. Yellow Levels are levels that show support and resistance levels of interest.
5. White shows the trendline from the August lows

ES (SPX, SPY) Analysis Week-Ahead (Oct 20th - 24th)Market Structure Overview
Price has shown a robust rebound from last week's discount levels, now trading back near the 6,720 area following a swift flush and subsequent V-shaped recovery.
Currently, we remain capped under the supply zone between 6,765 and 6,795, which represents the previous swing-high levels. As long as we trade below this resistance, our primary strategy will be to sell into strength and buy on dips within the established range, rather than pursuing breakouts.
On the hourly chart, key equilibrium is noted around the 6,701 to 6,705 range; this serves as the pivotal point around which price action is currently oscillating.
Setups (Level-KZ style)
Reclaim-and-go long (Tier-1 / Tier-2):
Asia/London: hold above 6,701–6,705 after a shallow dip → in NY AM, take the first 5m re-close + 1m HL toward 6,725–6,735.
Scale/target: TP1 6,725–6,735, runners toward 6,765–6,780 if strength persists. Invalidation: 15m body back below 6,701.
Flush-and-reclaim long (Tier-3 bounce):
• Quick sweep into 6,655–6,665 (or even 6,685–6,690) during London → immediate reclaim → first HL entry.
• Targets: back to 6,701 then 6,725–6,735. Invalidation: 15m close back inside/under the swept zone.
Pop-and-fail short (fade):
• Squeeze into 6,725–6,735 that fails to accept (15m rejection back inside) → take the first 5m LH.
• Targets: 6,701 then 6,685–6,690. Invalidation: 15m body acceptance above 6,735.
Stop-run reversal short:
• Spike into 6,765–6,795 (look for wick/absorption) → 15m rejection → 5m LH entry.
• Targets: 6,735 then 6,701. Invalidation: sustained 15m/30m acceptance above 6,795.
Management:
Anchor hard SL to the relevant 15m wick of the trigger ± a small buffer; require TP1 ≥ 2R to the next major level.
At TP1, trim most and put the runner to BE; max 2 attempts per level per session.
Overnight to Tomorrow NY Forecast
Base Case: Anticipate a range build between 6,685 and 6,735 overnight as the market absorbs the recent rebound. During the NY AM session (09:30–11:00 ET), initial attempts may test the 6,725–6,735 resistance before pulling back towards 6,701, potentially moving within the 6,685–6,690 range. Should buyers maintain support at 6,701 on a 15-minute chart, watch for a late-morning rebound back to the 6,725–6,735 zone, with a potential squeeze toward 6,755–6,780 if we see acceptance above 6,735.
The bias shifts to a bullish trend only with clear acceptance above 6,795, which would indicate multiple strong closes in that area, potentially targeting 6,820 and beyond. On the other hand, a decisive move below 6,655 would trigger a downward extension toward 6,604, 6,564, and 6,520.
Execution windows (ET)
• London: 02:00–05:00 — look for the sweep/reclaim plays.
• NY AM (primary): 09:30–11:00 — best momentum/rotation.
• NY PM: 13:30–16:00 — continuation or mean-revert back into the day’s pivot.
What changes the plan
Acceptance above 6,735 early: favor continuation to 6,765–6,780 rather than fading.
Hard failure at 6,701 with sellers defending on 15m: expect a deeper test into 6,685 → 6,655–6,665.
Elevated macro headlines/data at 08:30/10:00 ET windows can temporarily override levels; let the impulse print, then trade the retest.
Rising wedge formationRising wedge forming along an upper resistance line. May possibly enter short around 6735-6740
