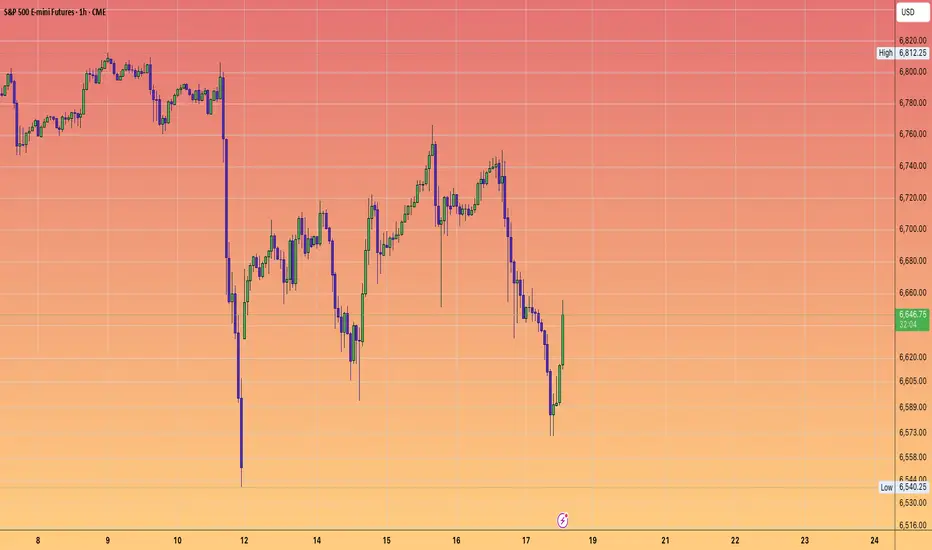
SANTA RALLY OR BLACK FRIDAY ..... ZOOMThis is a zoom into the 1hour detail up til the predicted November low (dead cat bounce zone)
Trade ideas

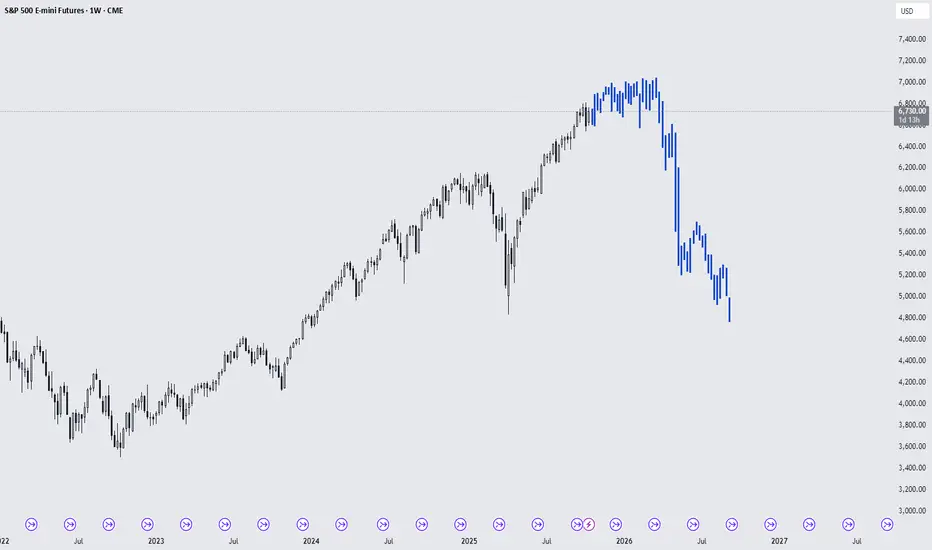
SANTA RALLY OR BLACK FRIDAY ...... THOUGHTS?This is this weekend's whiteboard projections for the next 6months.
This shows a slight reclaim this week but a continuation of lower highs and lower lows.
Then a drop to the bottom of the narrower channel when China tariffs & rare earth restrictions are reflected in earnings guidance as Mag7 reports Q3 results.
Dead cat bounce into Thanksgiving after the market pullback on guidance.
Then only a Trump tweet can give us a Santa Rally, otherwise the other shoe falls and we get a Black Friday/Monday after Thanksgiving.
Followed by a controlled selloff through Q4/Q1 earnings & poor guidance.
Chart forecasts finding a bottom in April 2026.
Please share your charts/forecasts into April 2026. (I am pretty new to this if you can't tell by my charts)

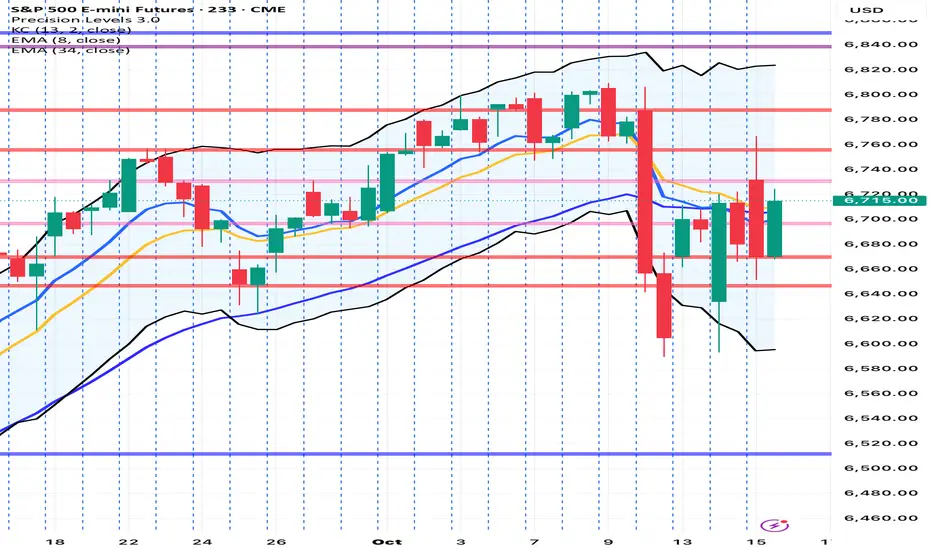
Neutral zone trade still dominantThe structure of the S&P 500 daily chart implies that the neutral zone trade continues which means a sideways market is expected with a bias to the upside for Monday.

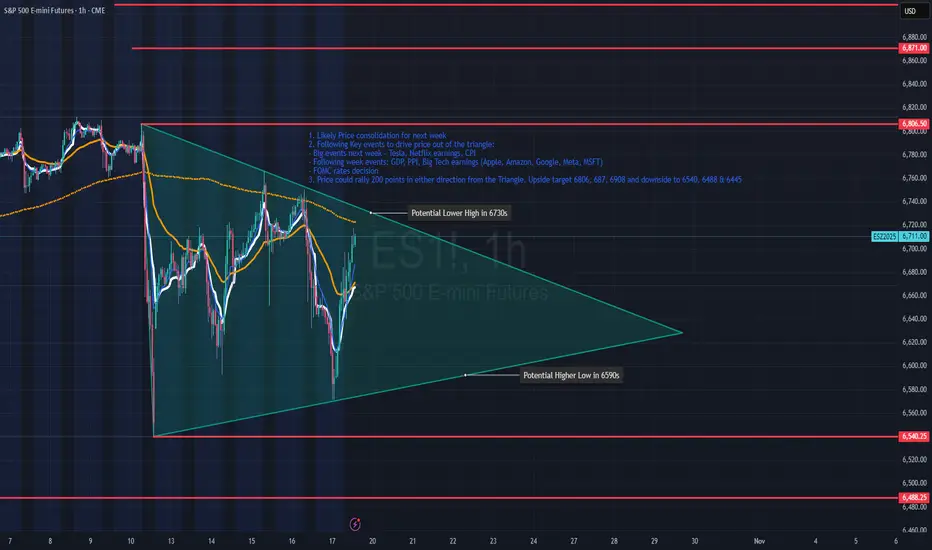
ES - Triangle Pattern - Plan for rest of OctoberSince last Friday's sell off based off Trump's tariff announcement on China, the price has been chopping in the range set by last Friday's high and low. The price has since made Lower Highs and Higher Lows driven by easing of Trump's sentiment towards China and Powell's dovish comments.
Next two weeks bring more volatility, with Tesla and Netflix reporting their earnings next week followed by the CPI report on Friday. The triangular pattern seems to converge on the 29th October which coincides with Fed's rate cut decision. To add to the fire, we have Big Tech earnings coming up as well starting 29th.
Additionally, the last day of the month is falling on a Friday, and since August 2024, when that happened, ES ended the day positive on 4 out of 6 occasions (August 2024, Nov 2024, Feb 2025 and May 2025). In 3 of these 4 occasions, ES ended up gaining over 50 points in the second half of the day, with Feb 2025 witnessing over 100 point gain in the last 2 hours.
The price could remain in this triangle and induce fake-outs leading up to the Fed meeting post which the upside and downside targets are as follows:
Upside: 6806, 6871 and 6908
Downside: 6540, 6488 and 6445
Hope this helps!
gameplan for $ES_F – 10/20**Trade Plan – 10/20: $ES_F #ES_F**
📊 **Setup Overview:**
• $ES_F held above key **support at 6540**, bouncing off the daily trendline and reclaiming short-term strength.
• The broader **ascending wedge** remains intact, with **6806** as major resistance and **6540** acting as the line in the sand for bulls.
• The market is consolidating between **6540–6800**, awaiting a breakout catalyst — likely earnings or macro data.
🐂 **Bullish Scenario:**
• Stay above **6540** and push through **6700 → 6750** for continuation.
• Break and hold above **6806** targets **new highs** into the **6850–6900** zone.
🐻 **Bearish Scenario:**
• Lose **6540** → watch for a quick drop toward **6240 → 6169**.
• Below **6169**, momentum breaks the long-term structure and opens **5822** as the next major demand zone.
⚖️ **Key Levels:**
• Resistance → 6700 / 6750 / 6806
• Support → 6540 / 6240 / 6169
🕓 **What I’m Watching:**
• Daily close above **6700** confirms bullish continuation.
• Breakdown under **6540** confirms the first leg of a potential trend reversal.
• Earnings and Fed speakers could drive volatility — stay nimble near resistance zones.
---
💬 If you found this helpful, drop a like and comment if you’re trading $ES_F.
Follow **@optibiz_trades** for more market setups, trade plans, and daily insights!

Day 52 — Trading Only S&P Futures | +$145 & 0DTE WinsRecap & Trades
Day 52 — woke up to an X7 buy signal that already ran hard premarket. I tried to grab a long at my preferred level, missed it by 2 points, and decided not to chase.
That patience saved me from chop. I waited for resistance, watched the structure, and just let the algo play out.
On the side, I took a few 0DTE option plays that hit +200%. It’s always satisfying when both systems line up — futures for structure, options for leverage.
Lesson & Mindset
Today’s takeaway: patience pays more than precision. Missing a trade is fine — what matters is staying aligned with structure, not emotion.
News & Levels
Headline: Trump said “China wants to talk, we like talking to China.”
Markets might be pricing in some optimism on trade headlines again.
Tomorrow’s levels: Above 6700 bullish, below 6640 bearish.

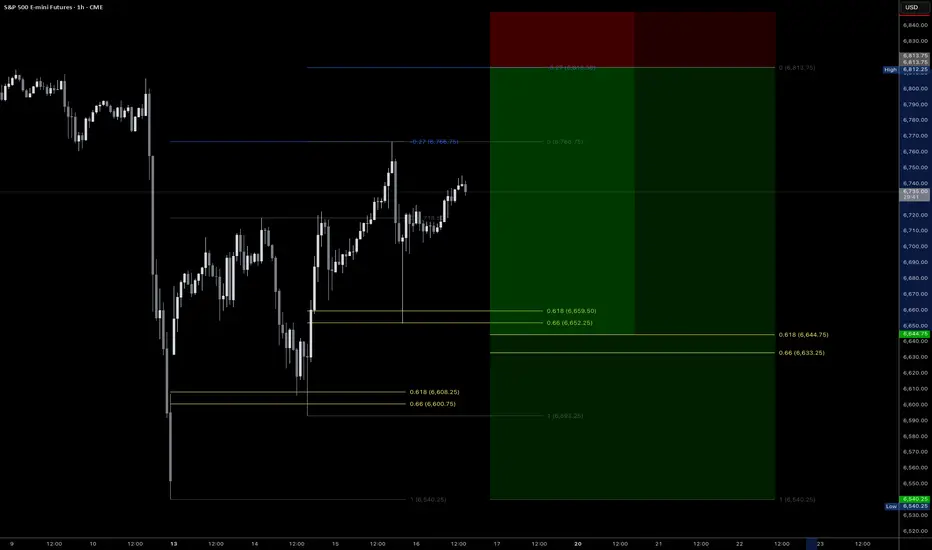
Watch out for 3 drives patternWith the last two retracements to the 0.618 and a perfect touch of the 0.272, we currently have an ideal setup for a potential three drives pattern.
If it hits the final 0.272, it will coincide with CME_MINI:ES1! reaching new all-time highs before reversing for a possible 150-point drop.
Let's see how it evolves.
NQ & ES Premarket Comment Friday 17-10-2025Good morning everyone.
Today, we’re operating within a balanced range — an equilibrium state. The daily bias remains neutral.
The potential scenarios for today are as follows:
1. Bullish scenario: Price could extend above yesterday’s high (PDH), as illustrated in the left-hand NQ chart.
2. Bearish scenario: Price could move lower, targeting last Friday’s low — this setup is shown in the right-hand ES chart.
The market structure will become clearer after the cash session opens at 09:30. By observing price action at the open, we’ll gain insight into the market’s true intent.
If the landscape remains unclear and your model does not align with price behavior, stay on the sidelines.
It’s Friday — the final trading day of the week — and price may exhibit unpredictable behavior or reactive moves. The key intraday levels are marked on the charts.
Stay disciplined, focused, and loyal to your model. Don’t let short-term volatility or choppy sessions affect your mindset. Relax, observe the price action, and let the market teach you.
See you later for the final market update of the week.
PF

TRUMP TWEET: High Tariffs on china will NOT remain.I expect a deal with Xi to be announced at the APEC meeting
#ES
#STOCKS
#SPX
ES UpdateES and NQ are a lot closer to the gap fill.
I leave open the possibility that RSI goes deeper into oversold so that at least ES and NQ can fill the gap then bounce.

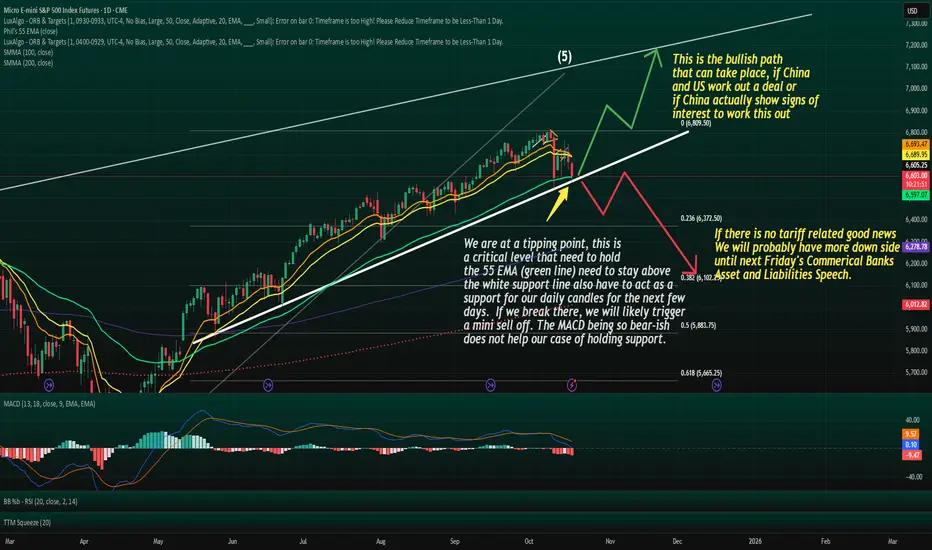
We are at a tipping point that can potentally trigger a bear run
The 55 EMA is widely watched by institutions and swing traders as a medium-term trend gauge.
When price tests this line after a strong run or selloff:
Holding above often leads to trend continuation or strong bounce as seen in the path on my chart.
Losing it convincingly tends to signal a deeper correction or even a trend reversal.
Right now, ES is coiling around the 55EMA, which is the kind of tension point where volatility can explode.
Lower Trend Line = Structural Support
The fact that the EMA test with the lower trend line can adds weight to the downward movement.
When a support trend line and EMA level line up, it becomes a confluence zone meaning breakouts or breakdowns from here are often decisive.
A breakdown of this confluence could open the door to:
A larger corrective Wave A or C leg down.
Possibly a multi-month correction into year end if macro news doesn’t provide support.
Fundamental Catalyst Is Lurking
Tariff or trade-deal headlines can be the kind of fundamental catalyst that aligns perfectly with this technical pressure point.
That alignment is classic in Elliott Wave:
The technicals create the setup.
The news provides the spark.
The breakout or breakdown is fast and aggressive.
⚠️ This is why these zones are dangerous for complacent positioning both bulls and bears can get steamrolled when the move starts.
Two Clear Scenarios
Bullish: candle hold above 55 EMA + trend line then bounce toward upper channel, possibly Wave B or new Wave 3
Bearish: clean daily close below support with 55 EMA dropping below can trigger a multi week(s) correction, potential acceleration downward if no positive news
Bull case → initial target near upper trendline / Fib extension levels.
Bear case → retest of previous swing lows or even 0.618 retrace of the entire rally.
Risk Management Matters Most Here
This is the kind of zone where:
Stops should be clearly defined — not “mental.”
Position size should respect that a big move can be triggered fast.
Targets should be realistic, because reactions off the 55 EMA can be sharp.
“When technicals and fundamentals line up, the market doesn’t tiptoe, it sprints.”
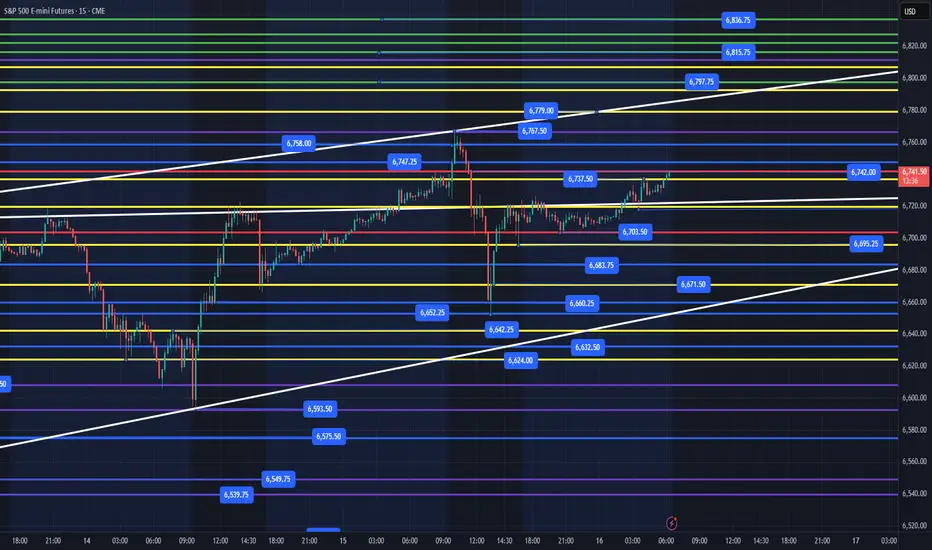
ES - October 17th - Daily Trade PlanOctober 17th - 6:32am
*Before reading this trade plan, IF, you did not read yesterdays, or the Weekly Trade Plan take the time to read it first! (You can see both posts in the related publication section) *
If my posts provide quality information that has helped you with your trading journey. Feel free to boost it for others to find and learn, also!
My daily trade plan and real-time notes that I post are intended for myself to easily be able to go back and review my plan and how I did from an execution perspective.
----------------------------------------------------------------------------------------------------------------
Yesterday we had some really good levels to grab points for those traders that were patiently waiting for a pullback. 6717 was our first level and we had some great points at this level. You can review the daily trade plan and see the real-time notes of what trades I took.
Let's discuss today's plan!
When I woke up around 4am EST I was not too surprised to see we had sold off overnight. Mainly due to the fact we back tested the massive bear flag resistance, yesterday. I had mentioned yesterday that IF, we lose 6650, we would most likely head lower. I also wrote that price needed to clear 6703 for price to go higher.
Our overnight high is 6668 with our overnight low at 6571. Around 4:20am price held this 6571 level a couple of times, and I was actually able to grab points this morning with the failed breakdown of 6575. 6592 is a previous weekly low and as of writing this price is holding this level at the moment. 6592 will be a key level to hold or we will need to test 6559, 6549 or 6539. We currently have an inside weekly candle that IF, price holds 6540 today, would give us next week's candle close to help determine the direction in the short term as to where price may continue either above 6700 or below. (I will go into more detail on the weekly trade plan that comes out on Sunday).
Since I already got lucky this morning being up while price was building a nice base and reclaimed 6575 and made a very nice trade to end the week. I will not be trading anymore the rest of the day.
Today is OPEX and with this can come volatility. You have to be even more disciplined on days like today.
Key Levels for Today:
1. Any loss and reclaim of 6592
2. Reclaim of 6607 (Potentially wait for a back test of this level, it has been tested 2x this am, so probably will rally and may not provide much of a back test).
3. Loss of the overnight low of 6571 and reclaim for a move higher.
My general lean is that Institutions will sell off price in the first hour down to 6559, 6549 and potentially 6540. Any loss of these levels and reclaim of them to move higher is what you need to be looking for. I do believe, IF, price clears 6607 we will most likely test the 6632-level minimum. IF, price can make it 6642 that is a bonus. IF, we are in a longer-term downtrend, price should not reclaim 6700. Today is ripe for a short squeeze and I would be patient and wait for some good levels to grab points from. IF, price loses 6540, I would wait for a reclaim of that level. IF, price does lose the level and can't reclaim it quickly, I would get out the way and take the rest of the day off.
Key Support Levels - 6592, 6571, 6559, 6549, 6539, 6514, 6495
Key Resistance Levels - 6607, 6624, 6632, 6642, 6652, 6668, 6683, 6703
I will post an update around 10am EST.
----------------------------------------------------------------------------------------------------------------
Couple of things about how I color code my levels.
1. Purple shows the weekly Low
2. Red shows the current overnight session High/Low (time of post)
3. Blue shows the previous day's session Low (also other previous day's lows)
4. Yellow Levels are levels that show support and resistance levels of interest.
5. White shows the trendline from the August lows


Day 51 — Trading Only S&P Futures | +$177 Testing a New StrategyRecap & Trades
Day 51 — I started late today since I had stuff to take care of in the morning. By noon, I decided to test a new “buy-the-dip” setup.
The idea: if the market drops over 100 points from its highs without panic, I’ll start building long positions with a wide 100-point stop and multiple profit targets.
Today was my first run testing it, and it worked pretty well — small win, but a big step in strategy development.
Lesson & Mindset
The key lesson: once you’ve built consistency, the next step isn’t more aggression — it’s refinement.
Testing new setups helps expand your edge while maintaining control.
News & Levels
Headline: Trump declared “We’re in a trade war with China now” — a reminder that volatility can return anytime.
Tomorrow’s levels: Above 6700 bullish, below 6655 bearish.

ES (SPX, SPY) Analysis, Key Levels, Setups For Fri (Oct 17)MACRO SCHEDULE (ET) — confirmed not impacted by shutdown
• NY AM: No confirmed 8:30 ET U.S. government releases (data blackout continues).
• 16:15 — Fed H.8 (weekly bank data) — after cash close; limited intraday impact.
BIAS:
• Short-term momentum is down; price sits in the lower half of this week’s range.
• Expect a liquidity probe lower in London, then a bounce attempt into NY AM if key demand holds.
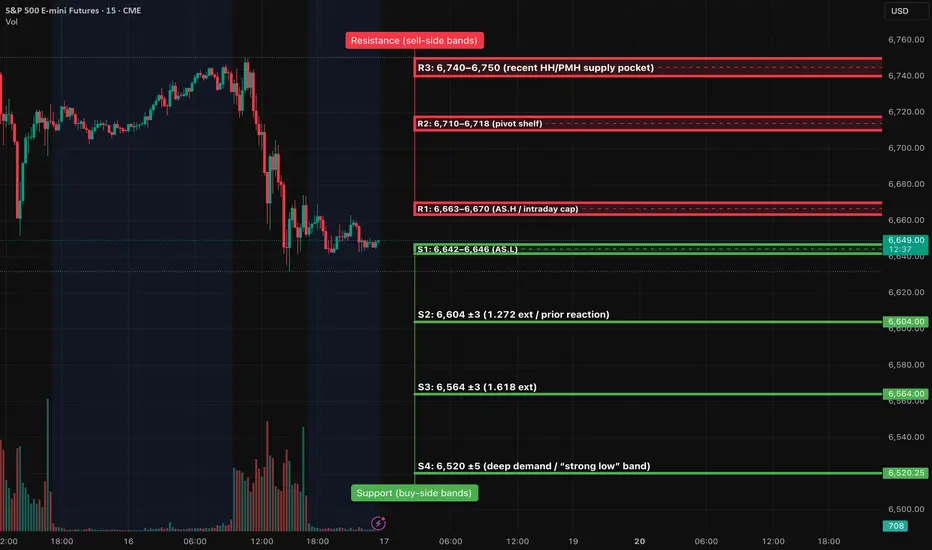
SETUPS — Level-KZ Protocol (15m→5m→1m)
Tier-1 (A++) — Continuation SHORT from R1/R2
Trigger: 15m rejection back below 6,663–6,670 ➜ 5m re-close below with LH ➜ 1m first pullback fails.
Entry: 6,658–6,662.
SL: Above 15m trigger wick +0.25–0.50.
TP1: 6,604 (≥2.0R gate). TP2: 6,564. TP3: 6,520.
Tier-1 (A++) — Acceptance SHORT below S1
Trigger: 15m full-body close < 6,642 ➜ 5m pullback holds below ➜ 1m LH entry.
Entry: 6,638–6,641.
SL: Above 6,646 +0.25–0.50.
Targets: TP1 6,604; TP2 6,564; TP3 6,520. Management as above.
Tier-2 (A+ Bounce) — Quick-Reclaim LONG at S2
Trigger: Fast sweep below 6,604 with immediate 15m reclaim ➜ 5m hold/re-close above ➜ 1m HL entry.
Entry: 6,605–6,609.
SL: 6,596–6,598 (15m wick low −0.25–0.50).
TP1: 6,663; TP2: 6,690–6,700. Size ¾.
Tier-3 (A Bounce) — Exhaustion LONG at S3
Trigger: Flush into 6,564 ±3 with capitulation wick and 15m momentum pivot ➜ 5m HL ➜ 1m trigger.
SL: Below 6,556–6,558.
TP1: 6,604; TP2: 6,663. Size ½.
INVALIDATION:
• Invalidate long bias if 15m accepts below 6,564 (two 15m bodies or one decisive close ≥1.5pt).
• Invalidate short bias if 15m accepts above 6,718 and holds.
• Max 2 attempts per level per session; stop trading at −2R net or after +3R net.
NEWS / HEADLINE NOTES
With government data paused, price will be more technically driven. Fed headlines can spark brief moves; prioritize level reactions over narrative.
Earnings/gamma flows may add noise near R1 (6,663–6,670) and R2 (6,710–6,718).
Neutral zoneThe daily structure in the S&P 500 implies a neutral zone which is a sideways market and in this case it has a bearish bias.

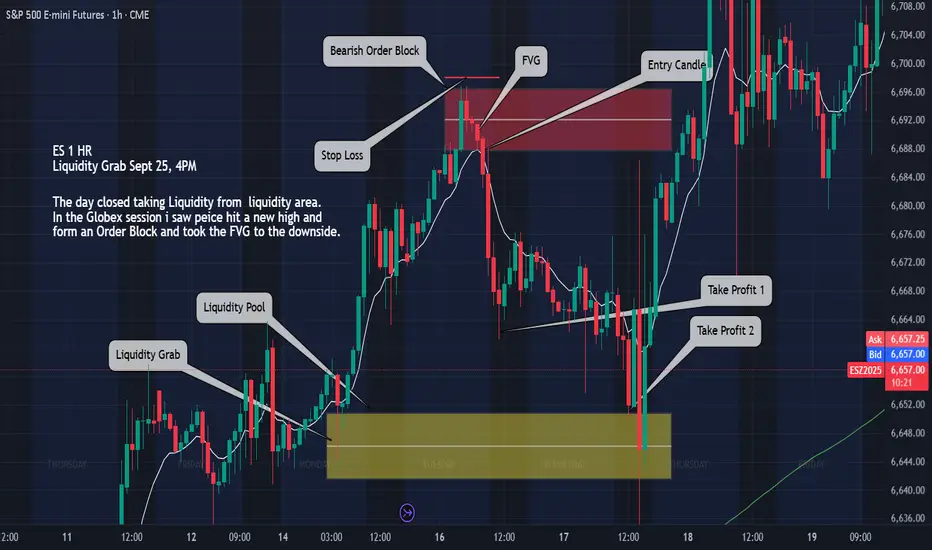
ES Chart Homework Liquidity Grab to FPRHere is my ES chart showing the liquidity grab to the Fair Price Redelivery on a 1 hour timeframe chart.
S&P 500 E-mini: Approaching Key Resistance Zone with Bullish MomThe S&P 500 E-mini is showing signs of recovery with price approaching a significant resistance zone near 6,800. The 4-hour MACD indicates growing bullish momentum, while the 30-minute chart suggests a potential push toward the resistance area. Traders should watch for a breakout above this level to confirm continuation or a rejection that could signal a pullback.

The Game of RiskWith the futures creeping up after the numbers it's looking more and more like a B wave is completing this morning, with a C wave down next for today and tomorrow. Holding support at 6500 (on futures) would likely get the 4 hour rsi in a divergent low posture. That divergent low could propel the SPX to new highs into next week.

NQ & ES Premarket Comment Thursday 16-10-2025Good morning everyone.
Today, we are trading within a Premium Zone, which indicates that any long opportunities should ideally emerge only after a retracement into one of the blue-marked demand areas highlighted on the chart.
The daily bias remains bullish, but given that price is currently positioned near the upper range, we may look for short-term countertrend setups, with the first blue zone serving as a potential short-term downside target.
Possible scenarios:
Scenario A: Price retraces to the first blue zone, where we’ll monitor for bullish confirmation signals to establish long positions.
Scenario B: Price extends deeper into the second blue zone, offering a more favorable long entry.
If neither scenario materializes, we’ll remain on the sidelines — patience and selectivity are key.
It’s important to approach short setups with caution. Trading against the dominant trend requires experience, precise execution, and algorithmic-level accuracy. Even in that case, risk should remain limited, as countertrend positions inherently carry higher exposure.
As the market opens, we’ll closely monitor the initial price action. Once volatility stabilizes and provided that price evolves in line with our outlined scenarios, the market structure will become clearer, giving us a defined framework for execution.
Avoid placing blind Buy Limit orders at the marked support levels. Instead, wait for clear confirmation of support and a shift in momentum before engaging.
The primary upside target for long setups remains yesterday’s high, followed by the all-time highs of the corresponding indices, should bullish momentum extend further.
Each session is an opportunity to sharpen our discipline, patience, and market awareness. Sit calmly in front of your charts, observe price action, learn from its behavior, and let the market guide you. If the anticipated setup does not unfold, treat that as valuable screen time rather than a missed opportunity.
Wishing everyone a focused and disciplined trading day — we’ll revisit and update our outlook in the afternoon commentary.
It doesn’t matter if price initially runs above the previous day’s high (PDH) — we still need price to retrace back into the predefined zones before considering any long entries. Wait for structure, not impulse.
PF

ES - October 16th - Daily Trade PlanOctober 16th - 6:30am
*Before reading this trade plan, IF, you did not read yesterdays, or the Weekly Trade Plan take the time to read it first! (You can see both posts in the related publication section) *
If my posts provide quality information that has helped you with your trading journey. Feel free to boost it for others to find and learn, also!
My daily trade plan and real-time notes that I post are intended for myself to easily be able to go back and review my plan and how I did from an execution perspective.
----------------------------------------------------------------------------------------------------------------
Yesterday we had some really good levels to grab points for those traders that were patiently waiting for a pullback. I wrote multiple times yesterday that I was anticipating a pullback. I gave plenty of updates including the following:
10am - Update
"Price opened up and held the 6725 level in the first 30 mins. Price is coming into the 6750-52 resistance. IF, price loses 6725, we could flush pretty hard and I would get out the way. I am still patiently waiting on lower levels, but 6720 will no longer be an option for me, especially, now that we have held that level and rallied into resistance at the open. 1hr RSI is at 97 and we should still get a healthy pullback if this rally is to keep going higher. I would NOT BE CHASING at this level. I could be very wrong, but I would rather wait on a pull back to enter than trying to chase after the open."
We rallied into the high of the day at 6767 (which is now the weekly high) and by 10:15am we started to sell off.
In the daily trade plan, I stated the following levels I would be looking to grab points at:
Levels I am looking to grab some points at today:
1. Any loss and reclaim of 6705
2. Loss of 6683 and reclaim (maybe getting as low as 6666 and then reclaim 6674)
3. Loss of 6660 and reclaim
All 3 levels created opportunities to grab points and IF you were patient, prepared, and acted in real-time you could have grabbed some nice points, yesterday.
(* I would go back and look at all my real-time updates from yesterday. I especially discuss the reclaim of 6660, WHY I did not take that level reclaim, and why I decided to wait for the 6683 reclaim. This was also the overnight low)
--------------------------------------------------------------------------------------------------------------
Let's discuss today's plan!
As of writing my plan, we are coming into and making the overnight high at 6742 with our low at 6704. We have been grinding higher in this range all night. The trend is up and we should always defer to the trend. Ideally, we can get a pull back to 6695 and reclaim 6705. We could also pull back to 6717 and reclaim 6720. IF, price is to continue higher, we should not lose the 6650-52 level. Since this was yesterday's low, I do not anticipate us losing that level today and we may need to use levels within the current overnight range to take us higher. Above 6742 and we should re-test the 6767 level and potentially target the 6797 level.
Levels I am looking to grab some points at today:
1. Any loss and reclaim of 6717
2. Any loss and reclaim of 6705
3. Any loss and reclaim of 6695 (We could pull back to 6686, 6692 and then reclaim of 6695 would be bullish)
Key Support Levels - 6737, 6717, 6705, 6695, 6683, 6671, 6660, 6652
Key Resistance Levels - 6742, 6747, 6758, 6767, 6779, 6797
I will post an update around 10am EST.
----------------------------------------------------------------------------------------------------------------
Couple of things about how I color code my levels.
1. Purple shows the weekly Low
2. Red shows the current overnight session High/Low (time of post)
3. Blue shows the previous day's session Low (also other previous day's lows)
4. Yellow Levels are levels that show support and resistance levels of interest.
5. White shows the trendline from the August lows
Next move for SPX in 2026This photo takes into account several factors and indicators, i expect the decline begin in March-April 2026. we are waiting seasonality
What next ! Bull and Bears. Who is strongest I have few levels above 6730 & 6755 to keep going up and I have 6669 and 6646 below to keep going down .. in between very lateral .. CME_MINI:ESU2025