ES UpdateLooks like another TACO trade, I noticed that ES had formed a wedgie and probably should've dropped soon anyways.
TACO or no TACO, I can't get bullish with such a huge open gap below, cashed out of everything because I made a bunch of money on gold on a HUGE bet. Gonna wait for indicators to tell me something.... I think MFI will hit overbought sometime this week.
Also, watch for financials earnings tomorrow morning.
Trade ideas

S&P 500 E-mini Inside Day: Consolidation Before Next Big MoveToday’s price action formed a classic inside day on the 30-minute chart, signaling market indecision and a potential buildup before a significant breakout or breakdown. Watch key volume profile levels and Fibonacci retracements for clues on the next directional move. Market breadth remains mixed, so confirmation on a break of the inside day range will be crucial for trading decisions.

How to Trade with Stochastics in TradingViewMaster Stochastics using TradingView’s charting tools in this comprehensive tutorial from Optimus Futures.
The Stochastic Oscillator is a momentum indicator that helps traders identify potential turning points in the market by comparing the current closing price to the recent high–low range. It’s designed to show when momentum may be shifting from buyers to sellers — or vice versa.
What You’ll Learn:
- Understanding the Stochastic Oscillator as a momentum tool plotted from 0 to 100
- How the %K line represents the current close relative to the recent high–low range
- How the %D line acts as a moving average of %K and serves as a signal line
- Key thresholds: readings above 80 suggest overbought conditions, while below 20 suggest oversold conditions
- Why overbought and oversold levels are not automatic buy or sell signals — and how strong trends can keep Stochastics extended
- Identifying bullish and bearish crossovers between %K and %D
- Spotting bullish and bearish divergence between price and momentum
- Using Stochastics to confirm trend direction across different timeframes
- How to add Stochastics on TradingView via the Indicators menu
- Understanding the default settings (14, 3, 3) and how adjusting them affects responsiveness
- Practical examples on the E-mini S&P 500 futures chart
- Applying Stochastics across multiple timeframes — daily, weekly, or intraday — for confirmation signals
This tutorial will benefit futures traders, swing traders, and technical analysts who want to incorporate Stochastics into their trading process.
The concepts covered may help you identify momentum shifts, potential reversal zones, and trend confirmations across different markets and timeframes.
Learn more about futures trading with TradingView:
optimusfutures.com
Disclaimer
There is a substantial risk of loss in futures trading. Past performance is not indicative of future results. Please trade only with risk capital. We are not responsible for any third-party links, comments, or content shared on TradingView. Any opinions, links, or messages posted by users on TradingView do not represent our views or recommendations. Please exercise your own judgment and due diligence when engaging with any external content or user commentary.
This video represents the opinion of Optimus Futures and is intended for educational purposes only.
Chart interpretations are presented solely to illustrate objective technical concepts and should not be viewed as predictive of future market behavior. In our opinion, charts are analytical tools — not forecasting instruments.

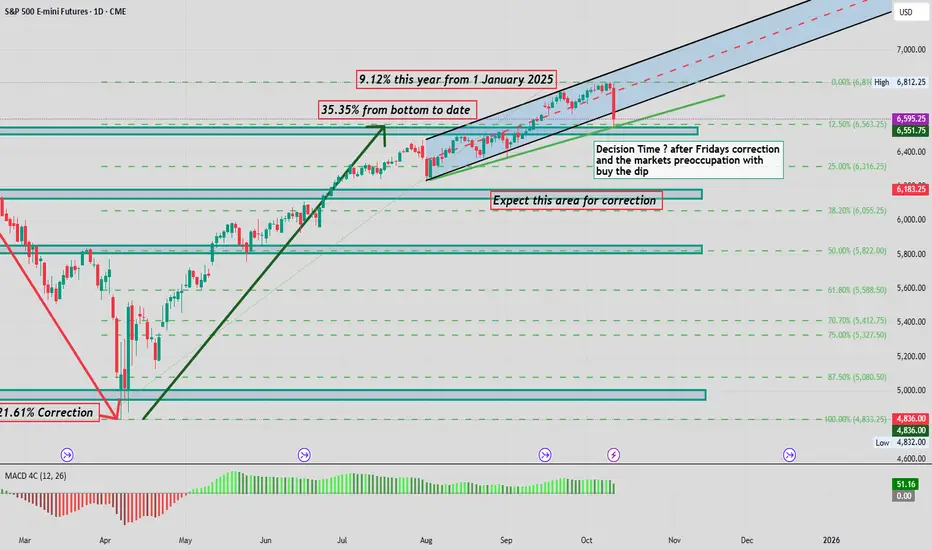
S&P500: Rebound Offers Relief, But Downtrend Likely to ContinueThe S&P 500 managed to recover somewhat, which helped to partially offset the recent sell-offs. However, we continue to expect the ongoing wave (4) in magenta to extend further to the downside. We anticipate that the low of this wave will be reached within the similarly colored long Target Zone (6,055 points – 5,822 points), before a new upward move begins that should push the index above resistance at 6,812 points. At that level, the magenta five-wave sequence should be completed, and the high of the higher-level wave (III) in blue should be established. Given recent price action, we have added a bearish alternative scenario to the chart. This scenario suggests that the most recent high has already marked the end of the large wave alt.(III) in blue, and that the index has since entered the corrective wave alt.(IV) . If support at 5,528 points is breached, this scenario will be triggered. Long positions within the magenta Target Zone could therefore be protected with a stop set 1% below the lower edge of the zone to limit risk.

NQ & ES After Hours Comment Monday 13-10-2025As mentioned earlier, we just witnessed one of the weakest consolidation sessions of the year. There was virtually no meaningful price action — nothing significant could be done from a trading perspective.
The best decision was to stay out of the market entirely. In the end, the secondary scenario played out, with the price drifting slowly and lethargically higher throughout the session.
Back here tomorrow at 08:45 AM NY time (45 minutes ahead of the market open).
PF

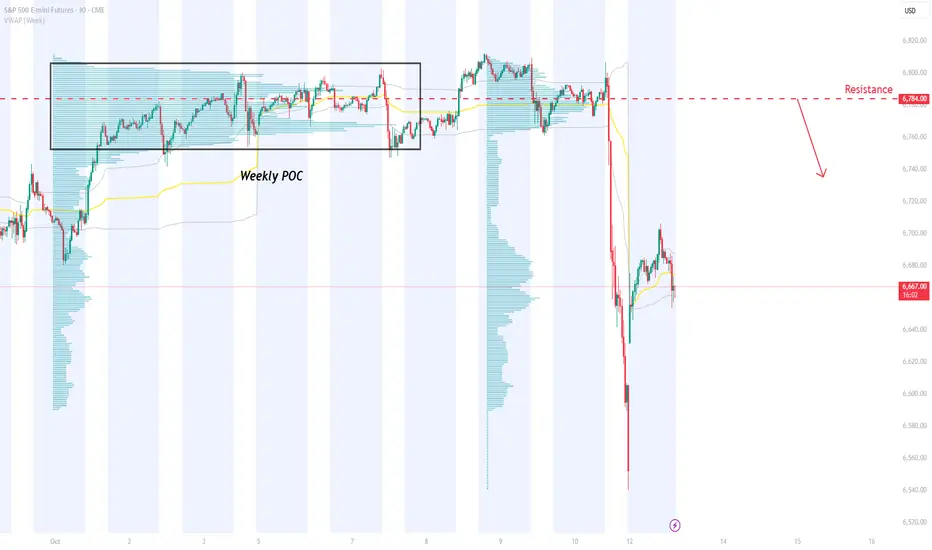
ES – Weekly POC Resistance at 6784 with Bearish Fair Value GapOn ES 30M chart, strong sellers accumulated around 6784 — the Weekly Point of Control and origin of Friday’s sharp sell-off. This heavy-volume zone marks where institutional selling began. The area also overlaps with a large bearish Fair Value Gap, reinforcing it as a key resistance. I’ll look for a pullback to this level for a short setup.
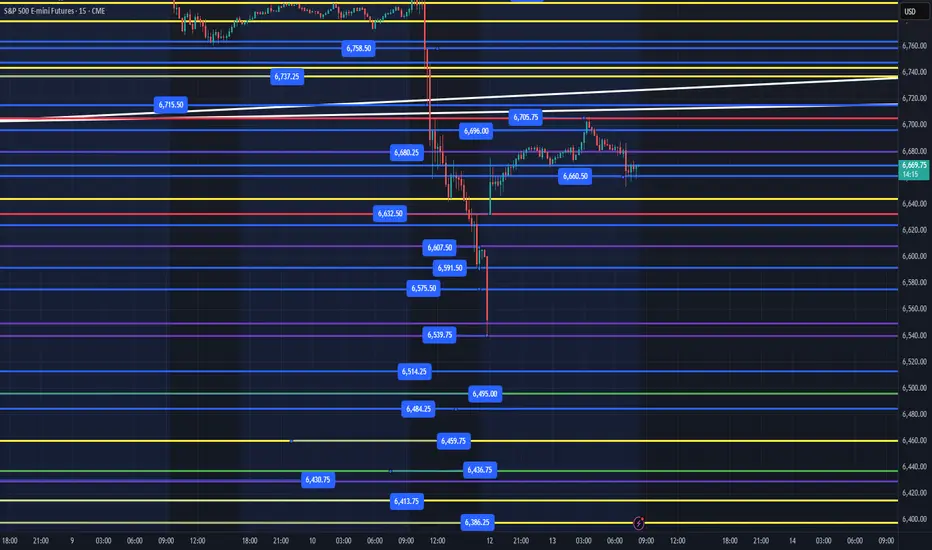
ES - October 13th - Daily Trade PlanOctober 13th - 8:15am
*Before reading this trade plan, IF, you did not read yesterdays, or the Weekly Trade Plan take the time to read it first! (You can see both posts in the related publication section) *
If my posts provide quality information that has helped you with your trading journey. Feel free to boost it for others to find and learn, also!
My daily trade plan and real-time notes that I post are intended for myself to easily be able to go back and review my plan and how I did from an execution perspective.
-----------------------------------------------------------------------------------------------------------------
ES sold off on Friday, and we gapped up last night with our overnight high at 6705 and low of 6632. We have a massive gap below that needs to be filled at some point in the coming days. Today, we should start to build some structure as we work on evaluating key levels that Institutions are looking to build positions at. When price gaps up like it did last night, I would be cautious on longs until we can fill the gap below.
Today I will look to find some points at the following levels:
1. Flush and reclaim of 6632
2. Flush and reclaim of 6540
IF, price does fill the gap and retest the 6540 level, we could go to 6495, 6436 and any reclaim of level above those levels, should take us higher.
Key Support Levels - 6660, 6645, 6632, 6607, 6591, 6575, 6540, 6514
Key Resistance Levels - 6680, 6705, 6715, 6737, 6750-56
IF, we lose 6632 and can't reclaim quickly, we should fill the gap below pretty quickly. Be patient today and let's see what happens in the first hour of trading.
I will post an update around 10am EST.
----------------------------------------------------------------------------------------------------------------
Couple of things about how I color code my levels.
1. Purple shows the weekly Low
2. Red shows the current overnight session High/Low (time of post)
3. Blue shows the previous day's session Low (also other previous day's lows)
4. Yellow Levels are levels that show support and resistance levels of interest.
5. White shows the trendline from the August lows
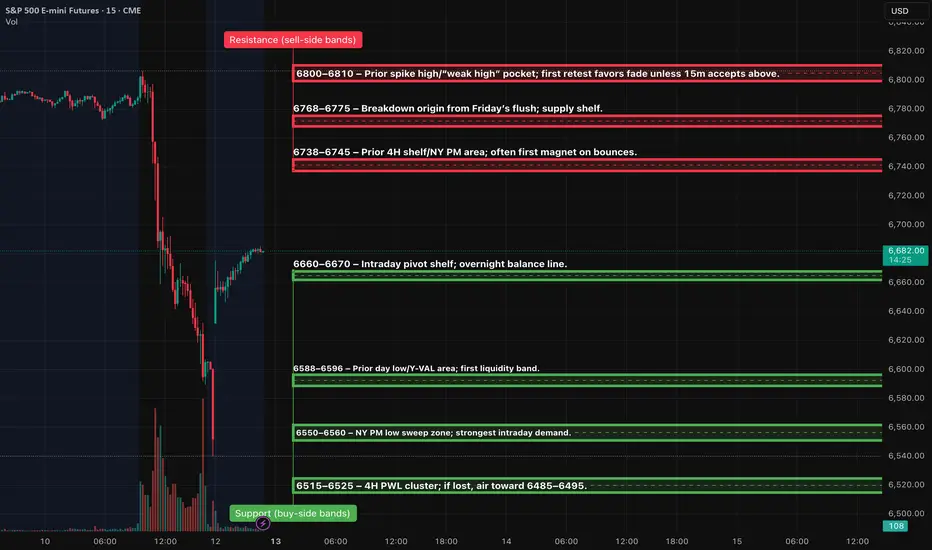
ES (SPX, SPY) Analyses, Key-Zones, Week (Mon 10/13 → Fri 10/17)Macro drivers to watch (ET)
Powell (NABE) — Tue 10/14 ~12:20. Markets will parse tone on growth/inflation. (Fed official calendar confirms time & venue.)
PPI (Sep) — Thu 10/16 8:30. First major U.S. inflation print of the week. (BLS “Next Release”.)
Advance Retail Sales (Sep) — Thu 10/16 8:30. Key read on demand into holiday season. (Census “MARTS” note; FRED release calendar.)
CPI (Sep) — not this week; rescheduled to Fri 10/24 8:30 due to the shutdown. (BLS reschedule notice; CPI schedule.)
Earnings kick-off (could move ES): JPM Tue 10/14, BAC Wed 10/15. (Company IR pages/press.)
Market conditions: U.S. bond market closed Mon 10/13 (liquidity thinner); NYSE equities open. (SIFMA; NYSE hours.)
Options expiration: standard monthly Fri 10/17. Expect pinning flows. (Cboe 2025 calendar.)
Setups (Level-KZ Protocol — 15m→5m→1m; NY kill-zones preferred)
TIER-1 (A++) — Rejection Short at 6790–6810 (NY AM)
Trigger: 15m full-body fails to hold above 6790–6810 → 5m prints a lower-high and re-closes back inside → 1m first pullback “pop-and-fail”.
Entry: 6796–6803 on the 1m failure.
Invalidation: Hard SL above the 15m fail-wick (guide 6814).
TPs: TP1 6738–6745, TP2 6690–6700, TP3 6625–6635.
TIER-1 (A++) — Quick-Reclaim Long at 6550–6560 (Asia/London → carry to NY)
Trigger: Liquidity sweep into 6550–6560, immediate 15m re-close back above 6600, 5m holds ≥6620, 1m higher-low entry.
Entry: 6602–6610 on the first pullback that holds.
Invalidation: Hard SL below the 15m sweep-low (guide 6544).
TPs: TP1 6690–6700, TP2 6738–6745, TP3 6768–6775.
TIER-2 (A+ Bounce) — 6590–6596 fast reclaim
Trigger: Wick through 6590–96 that immediately reclaims ≥6620 on 5m.
Entry/SL: Enter 6615–6622; SL below sweep-low −0.5pt.
Targets: 6690 then 6738–45. ¾ size.
TIER-3 (A Bounce) — 6515–6525 exhaustion flush
Trigger: Capitulation into the 4H PWL band with 15m reversal signal.
Entry/SL: Scale inside the band; SL below the 15m reversal wick.
Targets: 6590–96 then 6690. ½ size; only first touch.
ES Sunday UpdateHuge gap up that now needs to be filled. If the gap doesn't fill by open, I'm buying more puts Monday. I don't think this is a TACO trade, I think he has to follow through this time.
Gold and Bitcoin both up as well.

This is a quick view of the ESThis is Sunday 6:40 PM and the es made a very large move higher but now we need to be concerned that there could be a reversal here that could lead to the swing to go even lower than it did on Friday and we determine that by being patient

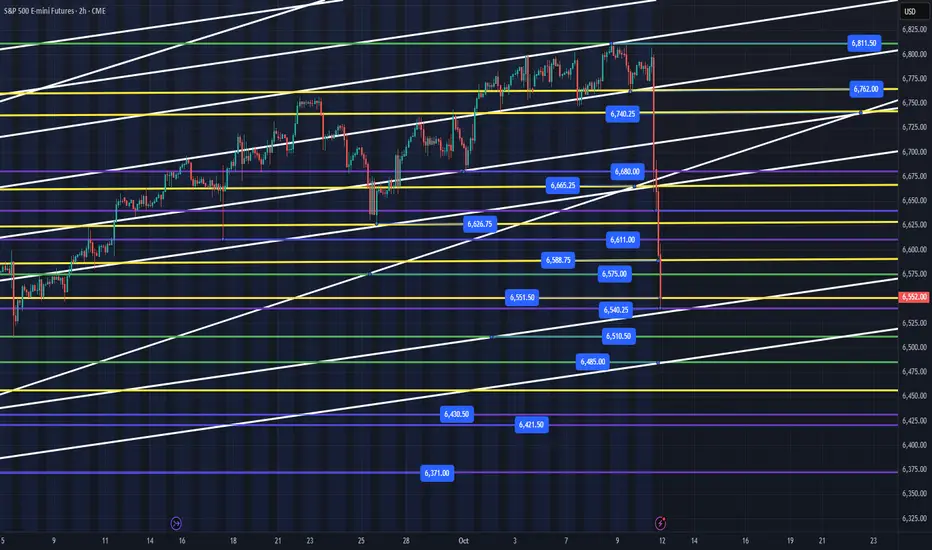
ES - Weekly Trading Plan - October 12th - 17thOctober 12th - 5:45pm
We had a great week, and Institutions continued to buy and keep price moving higher to our first weekly targets of 6807, 6813. On Friday, price looked like it was trying to go higher and then we got our first big "Trump Tweet" that gave Institutions an opportunity to sell! When we sell off like we did, it tells me that Institutions have been distributing heavily since FOMC in September. They had been building a nice base between 6741 - 6813 and with the right headline, it is time for them to sell. This level of selling, also shows you how leveraged retail traders were long, heading into this week!
I said last week that "we really need to hold the 6750 level, or we will need to pull back further for us to find liquidity to move higher. Ideally, we pull back to the 6720-25 level and then continue higher. IF, we lose the 6705 level, we will most likely need to retest last week's low at 6680-85."
I stated on my daily trade plan at 9:54am - Update
"Big sellers stepped in at 6807 level. Price really needs to hold 6790 lowest or this could be a false breakout, and we would continue lower down the levels. Bullish if price reclaims 6794."
Then on the 11:01am- Update
"Big sell off and not something you want to stand in the way of trying to pick a bottom. I mentioned that we needed to hold 6750 or we would see lower prices at 6729 first level, then 6705. The way the market just sold off, it will take a while for a base to build and shorts to get squeezed. I would be patient, and I may not trade again today. I will see how price does this afternoon."
My edge never gave me another opportunity for a trade the rest of Friday and honestly, anyone that said they went long on Friday, was gambling and, IF, profitable was lucky. IF, you truly watched price action it was running 10+pts up and down ranges so fast that it was very difficult trading conditions.
Let's talk about this week!
--------------------------------------------------------------------------------------------------------------
I have tried to clean up the weekly chart to keep it as simple as possible since we lost some major levels and are down at early September levels. We did sell off in the after-hours even further down to around 6540. Any loss this evening of that level and reclaim of it in the overnight session, will be a good start for us to back test the levels higher. IF, this is just a regular buy the dip after a sell off, we should be able to reclaim 6740 and hold 6680 by end of the week. The strength over the next couple of weeks will really determine, IF, we can continue the bull run above 6813. We have not had 2 red weeks back-to-back since the April low. We have to take price day to day and week to week. Overall, we are still in a bullish trend and that really won't change until we lose 6300 level as first big warning sign. Until then, we need to expect a buy the dip regime to continue!
When ES sells off the way it did, we have a very high probability that a short squeeze is coming in the next day or so.
How do we ride with the institutions for the back test of the loss of the 6762-66 level?
We find good levels that we can enter at and ride price higher.
Key Support Levels - 6540, 6510, 6485, 6460, 6430, 6421, 6371
Key Resistance Levels - 6551, 6575, 6588, 6611, 6626, 6665, 6680, 6705, 6740
Ideally, we will start to build a base below 6540 overnight and then we can catch the reclaim of that level for a move higher. I could also see us lose 6540, flush down to 6510 or 6485, bounce to retest the 6540 level, come back down overnight, get everyone scared it's going to flush again and then provide a massive, short squeeze.
IF, price does reclaim 6540, the reclaim of 6575, 6588, 6611 are next 3 levels above that we can try and find some structure built at for a move up the levels.
I have no idea what price will do at the open and during the overnight session. I will post my Daily Trade Plan by 6am EST after the overnight session to get a sense for what levels we want to try, and grab points out of tomorrow.
-------------------------------------------------------------------------------------------------------------
Purple Levels - Weekly High/Low
Green Levels - Weekly Targets
Yellow Levels - Daily Key Levels (See Daily Trade Plan)
White - Trendlines that may produce support/resistance alongside the horizontal trendlines
RENEWED US-CHINA TRADE TENSIONS COULD DRAG S&P500 TO ITS MEANWith renewed trade tensions between the US and China creating market uncertainty, the S&P 500 could be pushed significantly lower. The key support level to watch is the 6255 - 6468 range (1), which may act as a buffer. A break below this level could accelerate the move down toward the Feb - Apr 2025 monthly pullback zone (2). In either scenario, this volatility could cause a repricing of many stocks toward their perceived fundamental values.
N.B!
- ES! price might not follow the drawn lines . Actual price movements may likely differ from the forecast.
- Let emotions and sentiments work for you
- ALWAYS Use Proper Risk Management In Your Trades
#S&P500
#nasdaq
#nyse

Update on a chart i outline in September after FridayWe stopped at a pivot point Friday afternoon and Monday will determine whether we stop and consolidate or push lower into 6115. Be careful out there
SP500 | High Volume Zone, Watching for Retest and TrapWeeks ago, I marked the blue box as a potential demand zone — you can still see it in my earlier analyses.
Now that price has reached it, the question is simple: will I buy here? Absolutely not.
CDV looks terrible, showing no sign of accumulation. If this zone fails and we get a retest from below, I’ll consider a short position.
It’s also possible that price makes a new ATH just to trap late buyers before reversing — and I’m willing to take that risk.
The last weekly candle was a high-volume bar, and anyone familiar with my methods knows what that means.
When these bars are retested, they often produce high-probability trades. My retest zone sits between 6702 and 6773 dollars.
In short: I expect one more potential push higher before any major correction, but the structure favors waiting for confirmation rather than guessing bottoms.

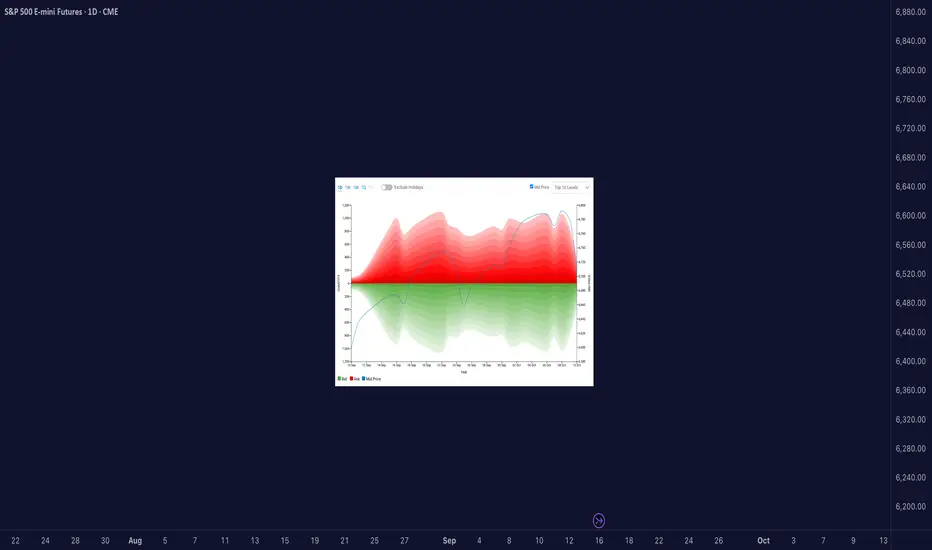
When Liquidity Dried Up — The True Story Behind the Oct 10 Crash█ We Actually Saw It Coming
There were clear signs of potential reversals across major markets before the Friday, October 10, 2025 crash. You can see it in the liquidity heatmaps: Gold, Bitcoin, S&P, and other futures all trading above their top 10 liquidity levels.
When that happens, it’s usually a warning flag. Price is moving into areas with less visible liquidity, meaning fewer resting orders available to absorb aggressive buyers. That’s when the market becomes fragile and doesn’t take much to trigger a sharp reversal.
█ When Price Trades Beyond Visible Liquidity
It’s easy to think big moves happen just because of news, but beneath the surface, microstructure signals often show when markets are already vulnerable.
One of the clearest is when the mid-price extends beyond the visible liquidity, above the top few ask levels or below the top few bid levels in the order book.
Suppose price pushes beyond the visible top levels. In that case, it often means that liquidity was consumed faster than it could replenish, either because aggressive orders cleared it out, or market makers pulled their quotes. That’s when we get what’s called a liquidity vacuum.
Research from the Federal Reserve, Bank for International Settlements, and academic studies (Lo & Hall, 2014; Meldrum & Sokolinskiy, 2025) all point to the same thing:
When order book depth is shallow, markets become more fragile. Prices overreact, spreads widen, and shocks travel faster.
█ What the Heatmap Really Shows
Those heatmaps are a visual snapshot of this structure.
The green and red bands show the depth of buy and sell orders — the liquidity zones.
The blue line is the mid-price — the true current market price.
When the blue line (mid-price) moves above the red zone, it means price has traded beyond the top available asks. That can happen because:
Buyers lifted all nearby sell orders (aggressive buying), or
Sellers pulled liquidity (passive withdrawal).
In both cases, the effect is the same, the book thins out, and volatility risk increases.
Heatmaps don’t show everything though. They don’t reveal:
Hidden or iceberg orders deeper in the book,
Off-exchange liquidity or block trades,
Or how quickly the book replenishes in real time.
But as a visual proxy, they’re incredibly useful for spotting moments when price runs ahead of available liquidity, often right before sharp reversals.
█ Why the Crash Hit So Hard
So while the crash came from unexpected news, the speed of that drop wasn’t random. Markets were already fragile. Liquidity across assets was thin. When the shock hit, there weren’t enough resting orders to slow it down.
Gold, Bitcoin, and S&P futures all had their mid-prices trading above visible liquidity, making them more sensitive to aggressive selling; that’s why the market fell almost simultaneously and so fast.
█ How I Handle These Setups
Whenever I see price trading above visible liquidity, I start managing risk differently. I might keep existing longs, but I won’t add new ones. Instead, I scale out gradually and watch for potential short setups if other signals confirm it.
It’s not about predicting crashes, it’s about recognizing when the market’s structure is fragile.
█ Quick Takeaway
When the mid-price trades above visible liquidity, the order book is telling you something simple but powerful:
“There’s not much support up here.”
That’s often when it pays to get defensive, not aggressive.
Access the CME Liquidity tool at this link
-----------------
Disclaimer
The content provided in my scripts, indicators, ideas, algorithms, and systems is for educational and informational purposes only. It does not constitute financial advice, investment recommendations, or a solicitation to buy or sell any financial instruments. I will not accept liability for any loss or damage, including without limitation any loss of profit, which may arise directly or indirectly from the use of or reliance on such information.
All investments involve risk, and the past performance of a security, industry, sector, market, financial product, trading strategy, backtest, or individual's trading does not guarantee future results or returns. Investors are fully responsible for any investment decisions they make. Such decisions should be based solely on an evaluation of their financial circumstances, investment objectives, risk tolerance, and liquidity needs.
Smaller range day for MondayThe expectation is a smaller inside the only slightly lower movement in the daily chart of the S&P 500 for Monday's price action

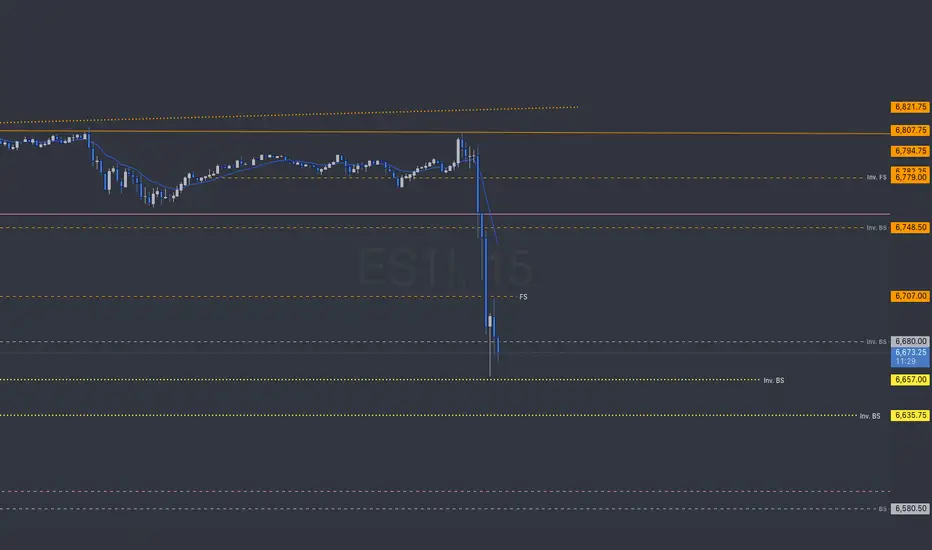
ES Levels of interestThe T.A paints the picture.
INV. levels. are resistance unless solid lines.
FS / BS levels are support unless solid lines
1x dotted are tested
2x dotted. are Origin levels where Trends originate from; a vertices in the fractals of time.
Each level is color coded to the timeframe the candle was found on.
Strength favors the higher timeframes
Pink = month
grey = week
red = day
orange - 4hr
yellow - 1 hr
15min - blue
5min - green
ES 10/10Same Weekly ES chart. I leave the same lines and update the levels to dotted when tested. I adapt trends if needed or leave them and start new as range trends develop.
other replays show the week progression from previous days.

ES - October 10th - Daily Trade PlanOctober 10th- 6:20am EST
*Before reading this trade plan, IF, you did not read yesterdays, or the Weekly Trade Plan take the time to read it first! (You can see both posts in the related publication section) *
If my posts provide quality information that has helped you with your trading journey. Feel free to boost it for others to find and learn, also!
My daily trade plan and real-time notes that I post are intended for myself to easily be able to go back and review my plan and how I did from an execution perspective.
-----------------------------------------------------------------------------------------------------------------
Yesterday, we had our first sell off that was lower than most of the local levels we have been seeing the dips bought at. It took price a couple of hours of basing in the afternoon before the 3pm rally. When price sells off like yesterday, it is important to remember that you do not have to rush in at every level. It is also important to make sure you take profits at the next level up. Depending on your strategy, Ideally, you will have a minimum of 2 contracts that you buy, with 1 being sold at the first level and the other being a runner. This way you can catch the move up, while still being profitable.
-----------------------------------------------------------------------------------------------------------------
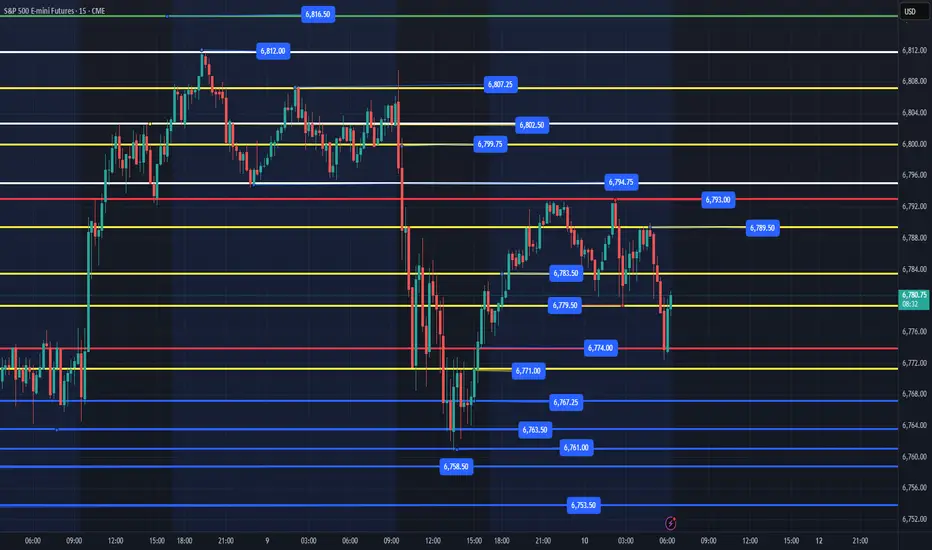
The overnight high is 6793 and we just made a new overnight low at 6773. Price needs to reclaim 6790-92 to continue higher. IF, price loses 6773, we will need to come back down and retest yesterday's low at 6761. I have mentioned in the weekly trading plan and in my note yesterday at 4pm -
"Price found a nice low at 6760 and built a base this afternoon and broke out to back test the overhead resistance at 6783. Any flush and reclaim of 6763 this evening is a good immediate spot. Price will most likely hold 6766-70 level and continue higher. 6750-56 is a key level for price to hold tomorrow. IF, we close below that level tomorrow, we may need to go all the way back down to 6729, 6705 to continue higher. IF, price loses 6756 overnight, I would wait until 6729 area as first good spot, IF, that area cannot clear 6756-58 on any back test, it may need to see 6705."
We should get some opportunities today at some quality points.
Highest Quality setups are the following:
1. Flush and reclaim of 6773
2. Flush and reclaim of 6761-63 area, with 6767 being the safer spot to enter with price clearing 6774 being bullish.
3. Flush and reclaim of 6753
4. Flush and reclaim of 6741
IF, price gets below 6741, we will need to look at 6729, 6705.
Key Support Levels - 6773, 6767, 6761, 6753, 6747, 6741, 6729, 6705
Key Resistance Levels - 6783, 6789, 6793-95, 6802, 6807, 6812
As of writing, we are in a clear downtrend with price on the 15 min chart. Any base that is built above 6773 and the reclaim of 6789 would be bullish in the current range.
I still think we need to find liquidity lower by flushing the 6761 level with a reclaim of 6763-65 being a great spot to try for some points.
I will post an update around 10am EST.
----------------------------------------------------------------------------------------------------------------
Couple of things about how I color code my levels.
1. Purple shows the weekly Low
2. Red shows the current overnight session High/Low (time of post)
3. Blue shows the previous day's session Low (also other previous day's lows)
4. Yellow Levels are levels that show support and resistance levels of interest.
5. White shows the trendline from the August lows
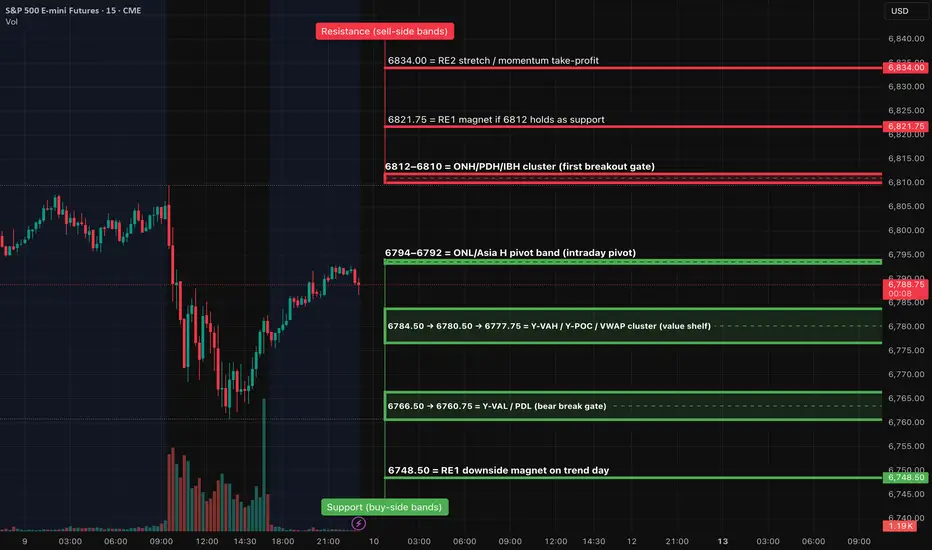
ES (SPX, SPY) Analyses, Key Zones, Setups Fri (Oct 10)Session Roadmap (London → NY)
London (02:00–05:00 ET): Expect balance 6792–6807. A sustained London hold above 6802–6805 increases odds of a pre-NY probe into 6809–6812. A London slip below 6784.5 shifts risk to a VWAP check 6777–6780 and potentially 6766–6761 into NY AM.
NY AM (09:30–11:00): Two-way opening likely unless 6812 converts rapidly; watch 9:45–10:05 for the sentiment print impulse.
NY PM (13:30–16:00): If morning sets a trend, expect continuation toward RE1/RE2; otherwise back-to-value rotations inside 6780–6795.
TIER-1 (A++) — Breakout LONG above PDH/ONH
Trigger: 15m full-body close above 6810–6812, then a 5m hold/re-close with HLs.
Entry: 6810.75–6812.25 on the first clean retest/hold.
Invalidation (hard SL): 6804.75 (below retest & today’s open region).
TPs: TP1 6821.75 (RE1), TP2 6834.00, TP3 6841.25.
TIER-1 (A++) — Breakdown SHORT through Y-VAL/PDL
Trigger: 15m full-body close below 6766.5 and then 6760.75, with a 5m retest 6764–6766 that fails.
Entry: 6764.00–6766.00 on the rejection.
Invalidation (hard SL): 6772.50 (back above value shelf).
TPs: TP1 6748.50, TP2 6736.50, TP3 6729.00.
TIER-2 (A+ Bounce) — Quick-reclaim LONG at Value Shelf
Trigger: Fast flush into 6777–6780 with a 1m reclaim of 6780.5 and 5m re-close above.
Entry: 6778.00–6780.50 after the reclaim.
SL: 6771.25.
TPs: TP1 6792.75 (Asia H pivot), TP2 6805.50 (today’s open/nearby shelf), runner eye 6810–6812 if momentum.
TIER-3 (A Bounce) — Exhaustion-flush LONG at PDL
Trigger: Liquidity sweep 6758–6752 that reclaims 6761 on 1m and 5m holds.
Entry: 6754–6756 on the reclaim.
SL: 6750.75.
TPs: TP1 6777.75 (VWAP), TP2 6789–6792 (pivot band).
===
Price-Path Scenarios (most to least likely)
Balance → Break Probe: Early churn inside 6792–6807; successful lift through 6810–6812 post-10:00 unlocks 6821.75 (RE1).
Fade to Value: Early rejection at 6809–6812 leads to a drift back into 6784/80 → 6777.75; buyers defend value and keep the range intact.
Bear Extension (data-shock needed): Clean 15m close below 6766.5/6760.75 opens 6748.50 with potential follow-through to 6736.50.
They bought the breakShadow on the bottom of the S&P 500 Thursday session implies it got low enough for buyers to return and it appears that in the Asia session buyers are continuing to drive prices higher. A positive close going into the weekend is expected for the S&P 500.

Day 48 — Trading Only S&P Futures | Risk Down, Focus UpRecap & Trades
Day 48 — I slept 10 hours to recover from the flu, woke up a bit foggy, and just eased into the day.
Took my time reviewing market structure and waited for clean confirmation before taking any trades.
The 11:40 VXAlgo DD Sell Signal lined up perfectly with the bearish flip and 10-min MOB zone — I shorted the recovery and let the market do the work.
Missed a few bottom orders, but overall execution was clean and controlled.
Lesson & Mindset
The key lesson today: when you’re on a hot streak, the best move isn’t to press harder — it’s to protect the gains.
That’s why I’m reducing my position size for the next few sessions. This isn’t about making more; it’s about keeping what I’ve earned.
News & Levels
Headline: The IRS plans to furlough 34,000 employees as the U.S. government shutdown continues — something to keep an eye on for market volatility.
Tomorrow’s levels: Above 6785 bullish, below 6765 bearish.

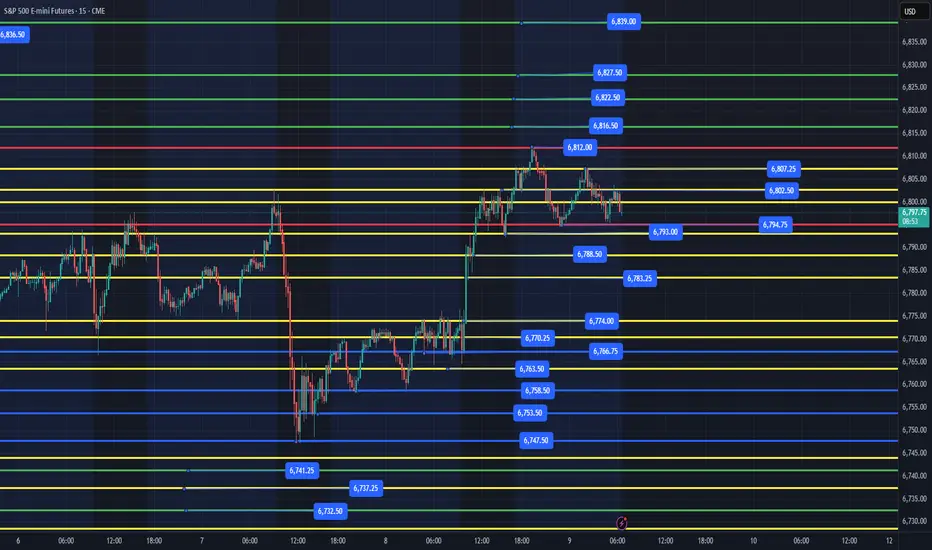
ES - October 9th - Daily Trade PlanOctober 9th- 6:3am EST
*Before reading this trade plan, IF, you did not read yesterdays, or the Weekly Trade Plan take the time to read it first! (You can see both posts in the related publication section) *
If my posts provide quality information that has helped you with your trading journey. Feel free to boost it for others to find and learn, also!
My daily trade plan and real-time notes that I post are intended for myself to easily be able to go back and review my plan and how I did from an execution perspective.
-----------------------------------------------------------------------------------------------------------------
Yesterday we held the 7663 range and rallied higher, meeting the first 2 weekly targets at 6807 and 6813. I wrote in my 12:28pm Update - Note the following: IF, you zoom out on the chart to a higher time frame and even down to a 1-hour time frame, you can clearly see that Institutions have been buying any dips below 6750-6765 and we then sold off 2x at the 6802 zone. IF, price can clear this level and hold we should have a new range between 6800 - 6850. I still think we can get one more pull back before we go higher. I am going to take the afternoon off and let price this afternoon decide what it wants to do and will look for new entry's tomorrow. IF, price does lose the 6750-56 level on any pullback, that would be bearish and a warning to the bigger/current market structure. Price really should not lose 6770-74, with 6760-63 being the very lowest, IF, price wants to continue higher.
Since the overnight session we have been building a base with the overnight low at 6794 and the high of 6812. We need to keep price above 6788 with a flush and reclaim of 6793-94 being bullish and should take us higher to the 6818, 6822+ targets.
IF, price loses 6788, we will most likely need to test 6766-70 and see if we have much liquidity left at this level.
Highest quality setups are the following:
1. Flush 6793 and reclaim for a move higher
2. Flush 6788 (maybe down to 6783) and reclaim for a move to back test the 6794 level
Key Support Levels - 6793-94, 6788, 6783, 6774, 6763, 6758, 6747, 6741, 6732, 6715, 6705
Key Resistance Levels - 6802, 6807, 6812+
IF, price rallies above 6812 (Overnight High) and then comes back into the overnight range after the NYSE Open, and ES starts to sell off fast, DO NOT try and RUSH into grabbing points. Wait for it to build a base at one of the levels outlined above.
I will post an update around 10am EST.
----------------------------------------------------------------------------------------------------------------
Couple of things about how I color code my levels.
1. Purple shows the weekly Low
2. Red shows the current overnight session High/Low (time of post)
3. Blue shows the previous day's session Low (also other previous day's lows)
4. Yellow Levels are levels that show support and resistance levels of interest.
5. White shows the trendline from the August lows