Automating TradingView Alerts to Tradovate (Step 1: Webhook + JSWelcome to the first video on my channel, Quant by Boji.
In this series, I’m walking you through how to build a complete end-to-end automation pipeline that takes alerts from TradingView and turns them into real trades on Tradovate, with confirmations sent to Telegram.
In this first episode, I cover the foundation:
Creating an indicator in TradingView using Pine Script
Adding the alertcondition() function so alerts know when to fire
Setting up an alert in TradingView with the Webhook URL
Writing a JSON message in the alert so your server has all the data it needs
By the end of this video, you’ll understand how TradingView can send structured alerts directly to your server, which is the first step in connecting it all to Tradovate.
⚠️ Disclaimer: This content is for educational purposes only. I’m not providing financial advice. Futures trading carries substantial risk, so always start in paper trading and do your own due diligence.
🔔 Subscribe and follow along — in the next episode, I’ll show you how to capture these alerts on AWS and move closer to live automation.
MES1! trade ideas

price returns to proven buyers providing cheap entry 1->3 : proven buyers at number 2
3->4 : return to proven buyers
next ?
* hidden bull rsi and mfi +oversold
* vpoc
*vwap 1st standard deviation

return to support during uptrend presents a cheap entry 1->3 : push up marking 2
as proven buyers
3->4 : return to proven buyers
next?
* hidden bull divergence
* behind vpoc 1->3 swing(s)
*uptrend continuation
*bullish bar entry at support
*zone trading 75% probability follow through to profit, though the invalid is below our stop as the zones are too big to align stop with zone stop also

Non Farm Payrolls 0830 EST Non Farm Payrolls (NFP) main event is tomorrow. Big show down between Bulls vs Bears. ADP was a market miss today, will NFP be a market miss?
If jobs report is no bueno will markets blast a roo up because they like the potential for Fed Rate cuts confirmed or will risk markets do a dumpster fire? Only time will tell. 0730 CST is the time to sit by the ringside to find out who wins.
#nonfarmpayrolls
#volitilemarkets

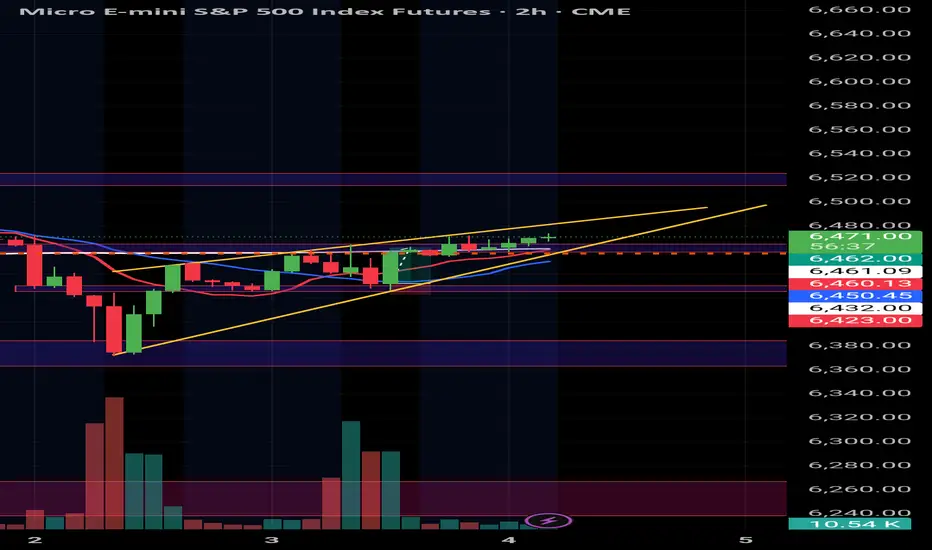
Bullish energy Just an idea …..I mostly scalp. 20-30% targets. Because the market is respecting higher lows, sustaining above moving averages, and showing momentum confirmation, my bias is bullish. I expect that as long as price holds above the most recent support zone, buyers will continue to press toward the next resistance level.

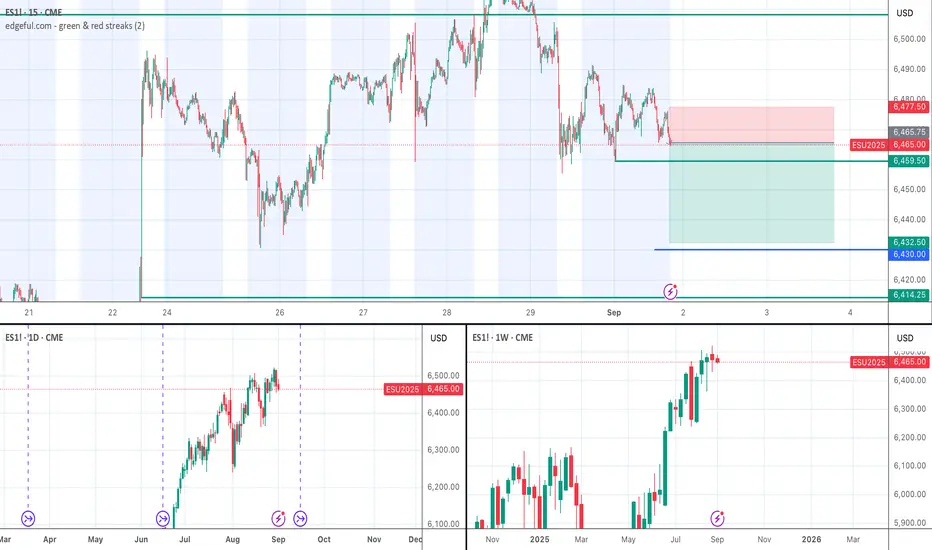
(ES) – Key Resistance at 6475The ES is approaching a significant resistance zone around the 6475 level, which has the potential to act as a short-term cap on price action. Given the current structure and momentum, ES may struggle to break and hold above this area.
This presents a possible short opportunity near 6475, with a tight stop just above the resistance. If this level holds as resistance, we could see a rejection leading to lower levels in the coming sessions.
Monitor price action closely around this zone for confirmation and manage risk accordingly.

Possible flush or continuation?Appears to be forming a falling wedge. Waiting to see how it plays out. Could go either way
OTEUM EXPERT CALL: SP500 – Jackson Hole Fade OTEUM EXPERT CALL: SP500 – Jackson Hole Fade 🏔️🐻
We’re looking for a SHORT(s) in spot and options for a macro swing down into Jackson Hole and the immediate aftermath 📉. Plan is to sell rallies into value (red box), ride the drift lower, and bank along staged targets. After that, we’ll be hunting the first-cut squeeze back up 🏦✂️🚀.
Risk: a surprise dovish leak / policy jawbone that front-runs the cut and squeezes shorts. Size smart, trail tight, don’t overstay.
#SP500 #ES #Macro #JacksonHole #ShortSetup #OTEUM

A conservative update for ThursdayA conservative update for Thursday is expected on the S&P 500 daily chart. The objective to the upside would be 6477 as the market waits for Friday's numbers.

SPX to 8,111 Trump Channel is Established !!!!SPX to 8,111 Trump Channel is Established !!!!
Sell all your bonds

Day 22 — Trading Only S&P Futures & Market analysisWelcome to Day 22 of Trading Only S&P Futures!
Today I kept things simple — waited for the 10am JOLTS report to set direction and only got long after we held the 1-min MOB. Even then, I stayed cautious since price was still under 6465 resistance.
I focused on gamma levels, which played out clean on both the buy and sell side. The only real slip-up was a FOMO long, and that reminded me of an important rule: I should only size up when I’ve got 2+ confirmations. If I take a trade with less, it needs to be 1 contract only — risk management first.
Closed the session with +256.25, ending the day disciplined and green.
📰 News Highlights
U.S. JULY JOLTS JOB OPENINGS FALL TO 7.181M (EST. 7.380M, PREV. 7.357M) — LOWEST SINCE MARCH 2021
🔑 Key Levels for Tomorrow
Above 6470 = Flip Bullish
Below 6450 = Remain Bearish

idea for S&P500 9/3i wanna play it long as long as market holds on my demand zone or pop up strongly and keep above the last supply around 6.466

Inside dayThe structure expected for the S&P 500 daily chart is for Wednesday to trade inside of Tuesday's range. It will take new fundamental information to drive volatility in this market.


Upcoming playLooking for this gap fill and then determine a continued upward direction or breakdown to retest the lower area of the day.

Upside continuation or retest and breakdown?Waiting to see how price holds in the 6430 range. Possible continuation to 6480 and back down to 6380.

Day 21 — Trading Only S&P Futures | -$417 Tilted LossDay 21 — Trading Only S&P Futures | -$417 Tilted LosWelcome to Day 21 of Trading Only S&P Futures!
Today was a tough one — I turned a positive morning into a -417.18 loss.
I started the day green, up about +150, but made the mistake of assuming the market had already bottomed at 6384. When it broke lower to 6374, I got stopped out at the true bottom of the day.
Frustration set in, and I tilted. I put on a 10-contract short at the MOB, expecting a rejection, but the EOD MOC imbalance and strong news from Google pushed the market higher, blowing past my stop.
The lesson today? Don’t fight the market, and never size up when you’re on tilt.
📰 News Highlights
DOW ENDS DOWN 250 POINTS, VIX JUMPS AS STOCKS DROP TO KICK OFF SEPTEMBER
🔑 Key Levels for Tomorrow
Above 6465 = Flip Bullish
Below 6450 = Remain Bearish

ES - September 3rd - Daily Trade Plan September 2nd - 4:10pm - Update & Trade Plan
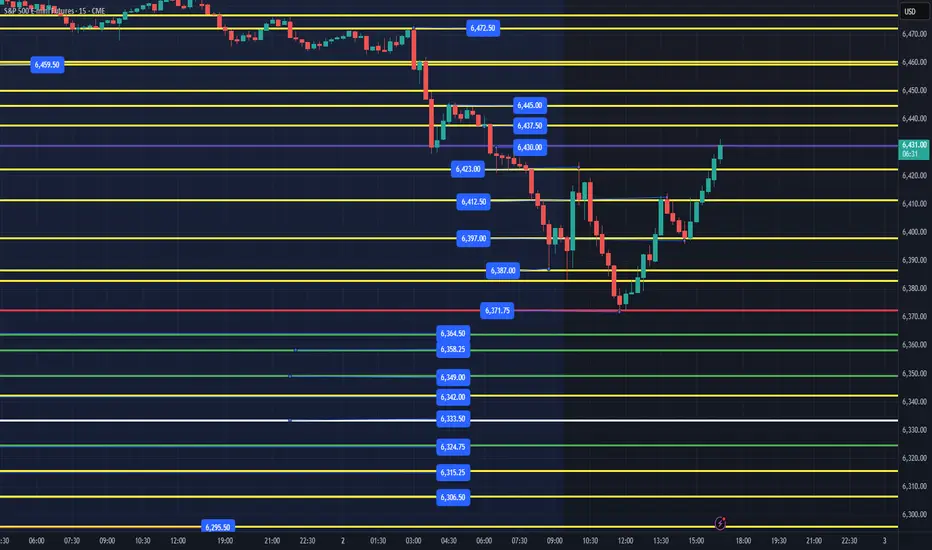
I said last night that " Below 6459 and we will need to most likely get out the way and let price flush a few levels". That we did overnight right before the European open, we flushed 6459 and could not reclaim the level, then tested last week's 6430 level, bounced around 20pts and flushed again down to 6382, bounced and back tested the 6423 resistances. I posted a note at 11:20am EST " IF, price can't hold 6383, look for a flush to 6372, 6358 and a reclaim of those levels above. At 11:53 we flushed down to 6371.75 and started to build a nice base and then went higher the rest of the session. Where are we closing? Right into the 6445 resistance that is important to clear to keep things moving higher!
Plan for the overnight session/tomorrow am as follows:
Our first support down is 6421, 6412 then 6397. Ideally, overnight we can pull back to the 6383-86 level, flush, then reclaim or even better, flush 6371.75 then reclaim for continuation higher.
I did say yesterday that "I am still bullish above 6390, but a break below this level would be a warning to the current trend." We broke below and recovered it today. We could have another bounce left in the tank at the levels discussed above but would ideally see a slow grind into those areas, and not a big flush. Pretty simple for tomorrow, still cautiously bullish until we clear the 6455 level that we broke down from last night.
My lean is we chop around overnight between 6445-6397 with 6385-87 the lowest we would want to chop down to, or we will most likely need to retest 6371 sessions low. IF, we lose the session low, the levels below are of interest and level reclaims will be expected bounces higher. IF, price is flushing, 6368-64, 6333.50 are the 2 big levels of interest to me.
I will send out an update tomorrow around 6am EST after price digests the overnight session.
selling opportunity at market edge for downtrend continuation 1->3 : 2 is proven sellers
3->4 : return to proven sellers
what next?
* hidden divergence
* obv trendline uptrend rejection,
potential sellers entry
* zone trading 76% accuracy if close
below

Futures Slip From Highs as Trend Width Flattens, Bias Still UpMarket Overview:
Pullback day near recent highs: breadth softens (12–2), trend width remains wide but begins to flatten, and futures hold above the first momentum threshold with corrective zones well below.
Bullish/Bearish Trend Analysis
Trend Condition:
Bullish Trends: 12
Bearish Trends: 2
Overview: The market is bullish, with 12 trend lines signaling upward momentum, though two bearish lines appear—showing a mild softening in breadth.
Trend Condition
Current Trend State:
The 14-line trend stack is slightly compressing versus yesterday.
Width: Wide—elevated, beginning to flatten.
Implication: Wide-but-flattening often precedes consolidation; a re-widening would argue for continuation.
Price Action and Momentum Zones
Current Price and Change:
Currently, the S&P 500 Futures are at 6,423.00, down by 51.00 pts or 0.79%.
Market Behavior:
Orderly pullback from recent highs; buyers faded, sellers testing the upper momentum band but no decisive breakdown.
Momentum Zones:
Price remains above the 23.6% threshold (6,123.92), the bullish momentum zone. The 38.2%–61.8% band at 5,877.04–5,477.96 is the countertrend, corrective demand area on deeper weakness.
Fib Retracement Levels
Current Position Relative to Levels:
The market is above the 23.6% Fib retracement.
Key Fibonacci Levels:
23.6% → 6,123.92
38.2% → 5,877.04
50.0% → 5,677.50
61.8% → 5,477.96
Analysis:
Staying above 6,123.92 preserves bullish momentum. Continued compression or a close beneath momentum support would shift focus toward the corrective band.
Overall Market Interpretation
Uptrend intact but cooling at the top of the range. Slight breadth deterioration and a flattening stack raise consolidation risk unless trend width re-expands and buyers reclaim control.
Summary
The tape slipped from recent highs with breadth easing to 12–2. Trend width is still wide but flattening, keeping the bias modestly bullish while increasing the odds of a short consolidation if compression deepens.

Short ES to Last Week's LowES is looking heavy with a steady decreasing Cumulative Volume Delta this evening. There is a 500 order block sitting at last week's lows just below 6430, so I'm thinking we head down to that level and test the support there.
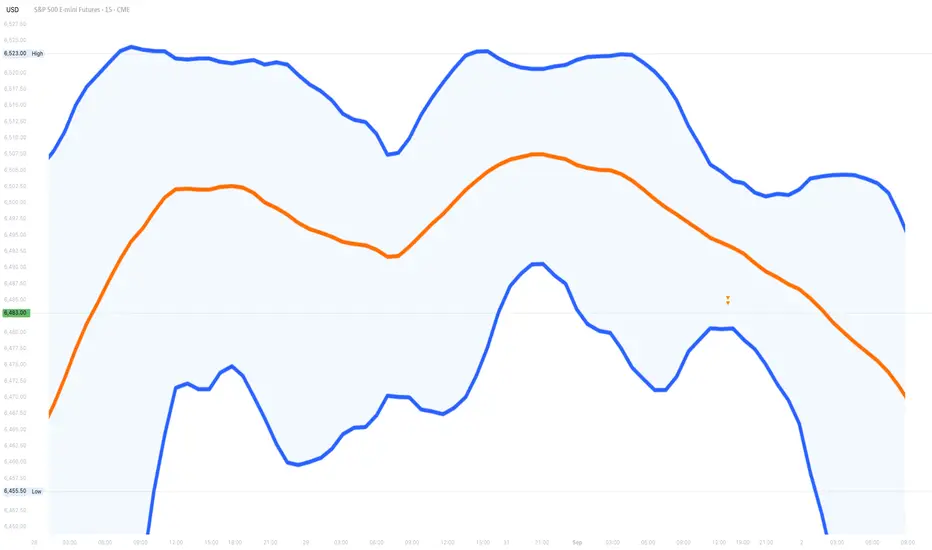
Understanding Bollinger Bands In Trading🔹 1. What are Bollinger Bands?
Bollinger Bands are a popular technical analysis tool used to measure market volatility and identify overbought or oversold conditions. They consist of three lines plotted relative to price movements, helping traders assess price trends and potential reversal points. Developed by John Bollinger in the 1980s, these bands dynamically adjust based on market conditions, expanding during high volatility and contracting during low volatility.
🔹 2. Components
Middle Band (SMA - Simple Moving Average)
The Middle Band is typically a 20-period Simple Moving Average (SMA).
It represents the average price over the selected period and acts as a trend indicator.
Upper Band
The Upper Band is calculated as:
Upper Band=Middle Band+(k×σ)
Where:
kkk is a constant (usually 2)
σ\sigmaσ is the standard deviation of price over the same period
This band represents an area of potential resistance and an overbought condition if the price approaches it.
Lower Band
The Lower Band is calculated as:
Lower Band=Middle Band−(k×σ)
This band represents an area of potential support and an oversold condition if the price nears it.
🔹 3. Role of Standard Deviation in Bollinger Bands
Measuring Volatility
Standard deviation (σ\sigmaσ) is a statistical measure of price dispersion.
Higher standard deviation means larger price swings, causing the bands to expand.
Lower standard deviation means smaller price swings, causing the bands to contract.
Adaptive to Market Conditions
When volatility increases, the bands widen, signaling strong price movement.
When volatility decreases, the bands contract, indicating a consolidation phase.
Identifying Overbought & Oversold Conditions
When price touches the Upper Band, it suggests the asset might be overbought.
When price touches the Lower Band, it suggests the asset might be oversold.
However, these conditions alone do not guarantee a reversal—other confirmations are needed.
🔹 4. History
1. John Bollinger and the Creation of Bollinger Bands
John Bollinger is a financial analyst, trader, and technical analyst. He is the president of Bollinger Capital Management and a Chartered Market Technician (CMT). He has written books and conducted extensive research on market analysis, risk management, and trading strategies.
2. How Did He Develop Bollinger Bands?
In the late 1970s and early 1980s, traders commonly used fixed-percentage bands, which plotted price channels around a moving average. However, these bands were ineffective because they did not account for changing market volatility.
John Bollinger introduced the concept of standard deviation to measure volatility and dynamically adjust the bands. His key contributions were:
Using a moving average (typically 20-period SMA) as the base.
Calculating upper and lower bands by adding and subtracting a multiple (usually 2) of the standard deviation from the moving average.
Recognizing that market volatility changes over time, meaning bands should expand and contract accordingly.
This approach allowed traders to identify periods of low and high volatility, trend reversals, and breakout opportunities with much greater accuracy.
🔹 5. How Bollinger Bands Work
Bollinger Bands are a technical analysis tool designed to measure market volatility and identify potential trading opportunities.
They consist of three lines:
Upper Band – The Middle Band plus two standard deviations.
Middle Band – A 20-period Simple Moving Average (SMA).
Lower Band – The Middle Band minus two standard deviations.
These bands dynamically adjust to price movements, expanding and contracting based on market volatility. The wider the bands, the higher the volatility, and the narrower the bands, the lower the volatility.
🔹 6. Bollinger Bands Formula
Bollinger Bands are built upon a statistical concept called standard deviation, which measures the dispersion of prices from their average. This allows the bands to expand and contract dynamically based on market volatility.
🔹 7. Interpreting Bollinger Bands
1. Identifying Overbought and Oversold Conditions
Bollinger Bands are widely used in trading because they provide insights into market conditions, trend strength, and potential reversal points.
Overbought Condition: When the price touches or moves above the Upper Band, it may indicate that the asset is overbought, meaning the price has risen too far, too fast. Traders may anticipate a pullback or a trend reversal. However, if a strong uptrend is in place, the price may continue to "ride" the Upper Band.
Oversold Condition : When the price touches or moves below the Lower Band, it may indicate that the asset is oversold, meaning the price has fallen too sharply. This may signal a potential buying opportunity, especially if other indicators confirm it.
📌 Important: Just because the price touches an outer band does not guarantee a reversal. Always use Bollinger Bands with other indicators, such as RSI (Relative Strength Index) or MACD (Moving Average Convergence Divergence), for confirmation.
2. Understanding Price Action Near the Bands
Strong Trends:
If the price moves along the Upper Band during an uptrend, it suggests strong bullish momentum.
If the price moves along the Lower Band during a downtrend, it indicates strong bearish momentum.
Reversal Signals:
If the price moves outside the bands and then quickly re-enters, it may signal a trend reversal.
This can be useful in spotting fake breakouts or exhaustion moves.
Mean Reversion:
Prices tend to revert to the Middle Band (SMA) after touching the Upper or Lower Band.
Traders use this principle to buy near the Lower Band and sell near the Upper Band in ranging markets.
3. Understanding Market Signals
Support & Resistance
If the price is above a band, it may act as support.
If the price is below a band, it may act as resistance.
Trend Analysis
Uptrends: Rising middle and upper bands. Downtrends: Falling middle and lower bands. Consolidation: Flat bands signal sideways movement before a breakout.
Compression & Expansion
Compression (bands tighten) breakout. Indicates low volatility before a breakout.
Expansion (bands widen) → trend continuation. Confirms volatility increase and trend continuation.
🔹 8. Strategies
1. Squeeze Strategy
The Bollinger Band Squeeze occurs when the bands contract tightly, indicating low volatility.
This signals a potential breakout, but it doesn’t predict the direction.
How to Trade the Squeeze
1. Identify when the bands are narrowing after a period of expansion.
2. Wait for the price to break above the Upper Band or below the Lower Band with strong momentum.
3. Enter a trade in the direction of the breakout.
4. Confirm the breakout with other indicators like RSI or MACD to avoid false signals.
5. Set stop-loss orders near recent price consolidation areas.
📌 Example:
If the price breaks above the Upper Band, enter a long position (buy).
If the price breaks below the Lower Band, enter a short position (sell).
✅ Best for: Trending markets, breakout traders.
2. Breakout Strategy
A breakout occurs when the price moves outside the bands, signaling strong momentum.
Traders use this as an opportunity to ride trends rather than fade them.
How to Trade the Breakout
1. Look for the price to close outside the Bollinger Bands (not just touch them).
2. Enter a trade in the direction of the breakout after confirming with volume or another momentum indicator.
3. Place a stop-loss near the Middle Band or recent swing low/high.
4. Exit the trade when the price starts consolidating or shows a reversal pattern.
📌 Example:
If a stock closes above the Upper Band, enter a long trade.
If a stock closes below the Lower Band, enter a short trade.
✅ Best for: Trend-following traders, breakout traders.
🔹 9. Key Takeaways
Structure : Bollinger Bands consist of three lines —middle band (SMA), upper band (SMA + 2 * standard deviation), and lower band (SMA - 2 * standard deviation).
Volatility Signals : The bands expand during high volatility and contract during low volatility, helping to identify potential breakouts or consolidations.
Trend Indicators : The middle band acts as a trendline, with prices above it indicating an uptrend and below it suggesting a downtrend.
Support and Resistance : The upper and lower bands typically act as dynamic resistance and support levels, respectively.
Mean Reversion : In range-bound markets, prices tend to revert toward the middle band, offering potential entry points.
Combination With Other Indicators : Bollinger Bands work best when used with other tools like RSI or Moving Averages to confirm signals and enhance trading strategies.
Quiet holiday marketThe shortened session in the S&P 500 for Monday was relatively quiet for a holiday market. This implies an up move for Tuesday.
