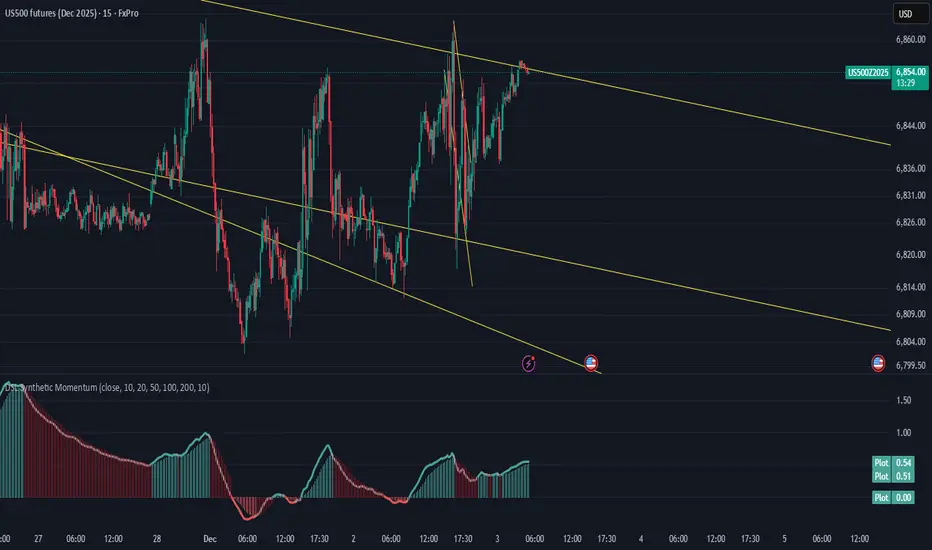
Optimistic attitudeThe structure of the daily chart in the S&P 500 implies an optimistic attitude in the market is positioning itself for follow-through to the upside with an objective of 6890.
Micro E-mini S&P 500 Index Futures
No trades
Market insights

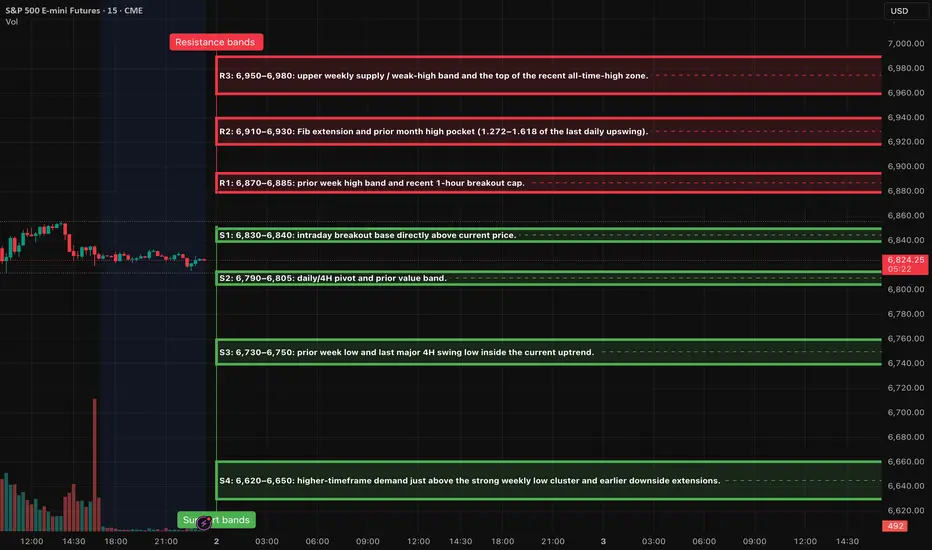
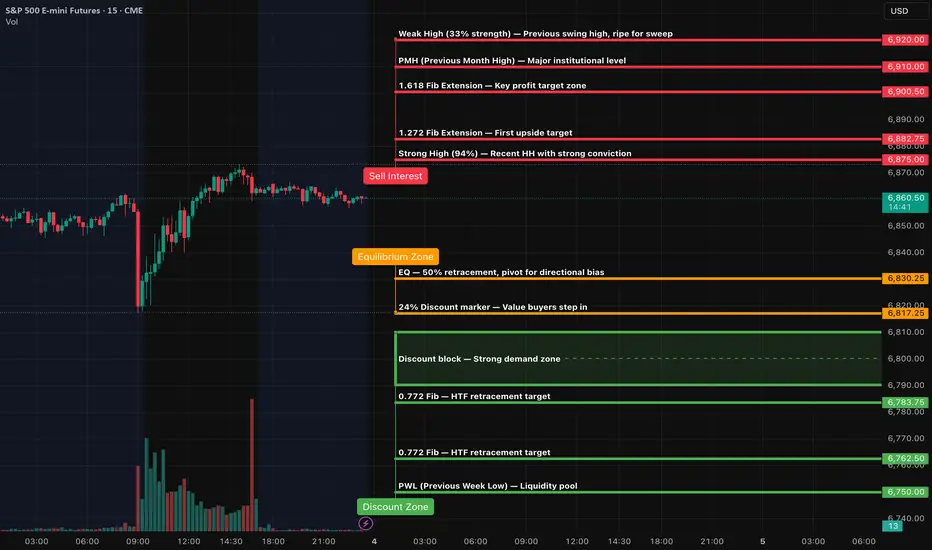
ES (SPX, SPY) Analysis, Key-Zone, Setups for Fri (Dec 5th)Market Overview
The daily trend remains firmly upward, with prices pressing against the November swing-high band, characterized by a sequence of higher lows and a gradual ascent toward previous peaks. Momentum indicators on both the daily and 4-hour charts are on the rise, yet they have not entered extreme levels, suggesting a likelihood of continued upward movement into the upper premium band rather than an imminent substantial reversal.
On the 4-hour and 1-hour charts, the E-mini S&P 500 (ES) has been consolidating in a narrow range, roughly between 6835 and 6880, as it builds energy just below the prior high. This range coincides with the 1.272 to 1.618 Fibonacci extension zone, located around 6895 to 6917. Given this setup, the outlook for tomorrow appears slightly bullish, provided the price remains above the mid-range support levels.
Market Brief: Key Developments for December 5, 2025
As we approach the final Federal Open Market Committee (FOMC) meeting of the year scheduled for December 9 -10, market participants are increasingly pricing in a substantial likelihood of a 25 basis point rate cut, along with further easing anticipated in the coming year.
For tomorrow, however, it’s important to note that the widely followed November employment situation report (including Non-farm Payrolls and the unemployment rate) has been officially postponed to December 16 due to the ongoing government shutdown. While some generic calendars may still reflect the original December 5 date for the payroll figures, this information has become outdated. At this time, it appears unlikely that any partial wage data will be released in lieu of the full report.
Nevertheless, many calendars are still marking U.S. hourly earnings and related labor indicators for the morning session. Expectations are set for hourly earnings, nonfarm payrolls, and unemployment rate placeholders around 8:30 AM ET, alongside the University of Michigan consumer sentiment and inflation expectations reports at 10:00 AM ET.
In practical terms, traders should expect regular liquidity levels in Asian and London markets. However, be prepared for potential volatility spikes around the 10:00 AM ET release of the U. Michigan data, especially if any unexpected headlines arise concerning the delayed labor report.
Market Outlook: Overnight Trends into New York Trading Session
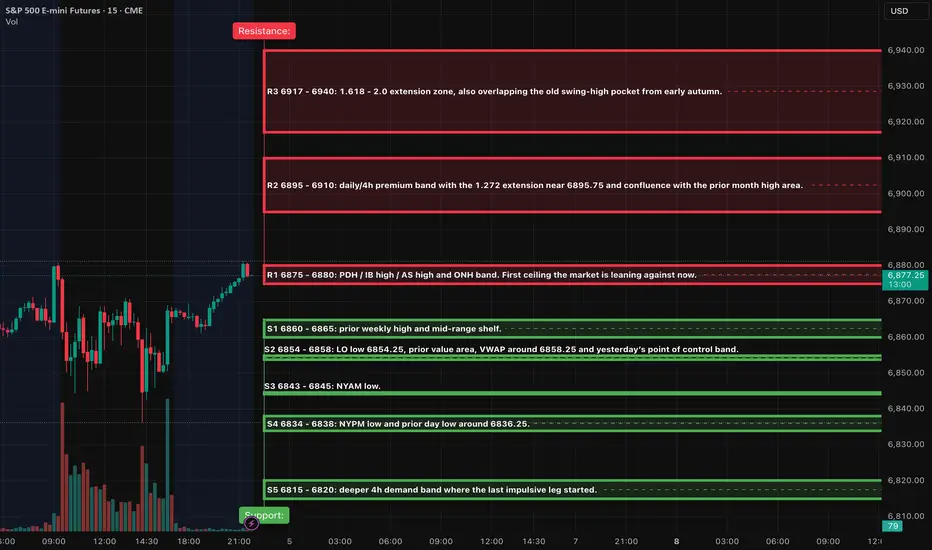
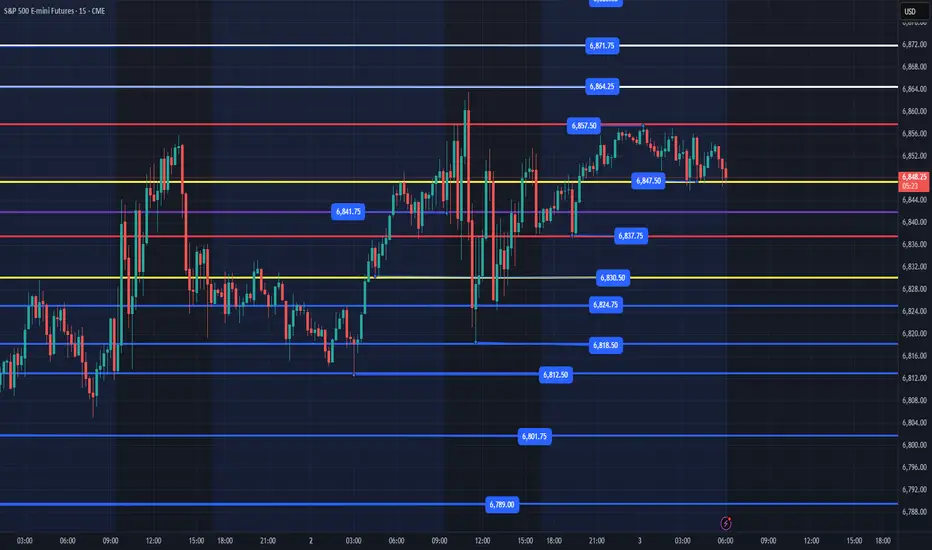
As we head into the New York trading session, the key focus remains on the E-mini S&P 500 (ES). The base case scenario suggests that as long as ES maintains support above the significant range of 6854 to 6858 - often referred to as S2 - during any dips seen in the Asian and London sessions, we can anticipate a gradual upward movement. This trajectory would likely involve repeated testing of resistance levels around 6875 to 6880 (R1). Should we witness consistent hourly closes that approach this resistance with only modest pullbacks toward 6860, the likelihood of a breakout toward the premium zone of 6895 to 6910 increases, potentially occurring before or during the New York session.
On the other hand, the alternative scenario would unfold if the market decisively breaks below S2, resulting in a series of hourly closes beneath 6854. Such a development would signal a shift in sentiment and a potential rotation toward support levels S3 and S4, which target 6835. This would likely create a mean-reversion environment, with trading in New York focused more on the lower half of the 6835 to 6880 range rather than pushing for a breakout above resistance. Investors should tread carefully as these scenarios develop.
A++ setup 1 - Long breakout continuation above 6875
Bias: continuation long, only if we see real acceptance above R1.
Trigger conditions:
15m candle closes with a solid body above 6880, turning the 6875 - 6880 band from
Entry zone: 6878 - 6882 on the first 1m/5m higher low after that pullback holds.
Initial stop: 6869, tucked below the 6870 intraday pivot and just under the reclaimed band.
• TP1: 6904 - 6908, inside the 6895 - 6910 premium band, giving you roughly 2R or better if you are filled near the middle of the entry band and respect the tight stop.
• TP2: 6915 - 6918, near the 1.618 extension.
A++ setup 2 - Short reversal from failed break 6895 - 6910
Bias: high-quality fade only if the market runs stops into the premium band and then traps longs.
Entry zone: 6890 - 6896 on a retest of 6895 from below after that rejection is confirmed.
Initial stop: 6908, above the rejection high and inside the upper part of the premium band.
• TP1: 6858, back into the VWAP / prior value area pocket. That gives you roughly 2R or better if you are filled near mid-band with a 10 - 12 point stop.
• TP2: 6843 - 6845, test of NYAM low.
Tomorrow is shaping up to be a pivotal decision point following a robust advance in the market. As long as the support level around 6855 remains intact, any dips should be viewed as buying opportunities, particularly targeting the premium range of 6895 to 6917. However, a decisive rejection from this premium zone, with prices falling back through 6870, may signal an A++ short opportunity, potentially driving prices down toward 6858 and beyond.
Good Luck !!!
Day 80 — From Green to Red: The Danger of OverstayingEnded the day -$256 trading S&P Futures. I was actually up +$250 early in the session, but I made the mistake of itching for more after playing it safe with small gains all week. I decided to size up to 6 contracts on a Buy signal that looked solid, but the market had other plans. We saw a "flash crash" out of nowhere that stopped me out, only for price to rip all the way back up after tagging the 10-minute MOB. It felt scammy, stressful, and honestly, it ruined the day. It’s a harsh reminder that right now, the longer you stay in this market, the more dangerous it gets.
🔔News Highlights: *S&P 500, NASDAQ END HIGHER, VIX FALLS AS INVESTORS BRACE FOR KEY INFLATION DATA
📈
Key Levels for Tomorrow:
Above 6840= Bullish Level
Below 6830= Bearish Level

ES - December 4th - Daily Trade PlanDecember 4th- Daily Trade Plan - 8:30am
*Before reading this trade plan, if you did not read yesterday's take the time to read it first! (You can view the posts in the related publication section) *
If my posts provide quality information that has helped you with your trading journey. Feel free to boost it for others to find and learn, also!
My daily trade plan and real-time notes that I post are intended for myself to easily be able to go back and review my plan and how I did from an execution perspective.
--------------------------------------------------------------------------------------------------------
You can review my trade plan from yesterday and the daily note updates to see which levels we grabbed points from.
Overnight we have been building a nice bull flag between 6854-6870. Looking at the bigger picture price looks like it wants to go higher and break out of this range we have been. My general lean today is that we have a flush and reclaim of 6854 before heading up. We might only get as low as 6861. IF price loses 6818 then we should move lower.
Key Levels Today
1. 6861 flush and reclaim
2. 6854 flush and reclaim
3. 6847 flush and reclaim
4. 6837 flush and reclaim
5. 6818 flush and reclaim (wait for reclaim of 6824)
Below these levels and price will most likely be selling off and I would be getting out the way and let price find a level below to reclaim and move higher.
I will post an update around 10am EST
----------------------------------------------------------------------------------------------------------------
Couple of things about how I color code my levels.
1. Purple shows a current or prior weekly low
2. Red shows the current overnight session High/Low (time of post)
3. Blue shows the previous day's session Low (also other previous day's lows)
4. Yellow shows core support/resistance levels
5. White shows overhead resistance/targets
Types of Trading in the World Market1. Equity (Stock) Trading
Stock trading is one of the most popular forms of trading globally. Traders buy and sell shares of publicly listed companies on exchanges such as NYSE, NASDAQ, London Stock Exchange, Tokyo Stock Exchange, and NSE/BSE in India.
Types of Stock Trading
Intraday Trading:
Buying and selling within the same trading day. Traders use technical analysis, chart patterns, and indicators to exploit short-term price movements.
Swing Trading:
Positions are held for several days or weeks. Swing traders focus on medium-term trends and market cycles.
Position Trading:
Long-term trading, where traders hold stocks for months or years based on fundamentals, economic outlook, and company growth.
Momentum Trading:
Traders enter stocks showing strong upward or downward movement with high volume, aiming to profit from continued momentum.
Equity markets are influenced by earnings reports, corporate news, economic data, interest rates, and geopolitical events.
2. Forex (Foreign Exchange) Trading
The Forex market is the largest and most liquid financial market in the world, with daily turnover exceeding $7 trillion. Traders buy and sell currency pairs such as EUR/USD, GBP/JPY, USD/INR, etc.
Key Features
Market remains open 24 hours, five days a week.
Influenced by macroeconomic indicators, central bank policy, and global events.
Types of Forex Trading
Scalping:
Ultra-short-term trading where traders make dozens of trades in a day for small profits.
Day Trading:
Similar to intraday trading in stocks but applied to currency markets.
Carry Trade:
Traders borrow in low-interest currencies and invest in high-interest currencies to profit from rate differences.
Algorithmic Forex Trading:
Automated systems trade based on programmed strategies.
3. Commodity Trading
Commodities include gold, silver, crude oil, natural gas, wheat, coffee, copper, and more. These are traded on global exchanges like the Chicago Mercantile Exchange (CME), London Metal Exchange (LME), and Multi Commodity Exchange (MCX) in India.
Two Types of Commodity Trading
Spot Trading:
Immediate purchase and delivery of commodities.
Futures Trading:
Buying and selling commodity futures contracts, where traders speculate on future prices rather than owning the physical commodity.
Commodity prices are influenced by weather, supply-demand dynamics, geopolitical tensions, and macroeconomic trends.
4. Derivatives Trading
Derivatives derive their value from underlying assets like stocks, indices, commodities, interest rates, or currencies. The most common derivatives are Futures and Options.
Futures Trading
A legally binding agreement to buy or sell an asset at a predetermined price on a future date. Traders use futures for speculation and hedging.
Options Trading
Options give traders the right, but not the obligation, to buy or sell an asset at a certain price.
Two types:
Call Option – right to buy
Put Option – right to sell
Common option strategies include straddle, strangle, iron condor, and covered call.
Index Trading
Indices like S&P 500, NASDAQ 100, NIFTY 50, FTSE 100, and DAX are traded via futures and ETFs.
5. Cryptocurrency Trading
Crypto trading has become a major global phenomenon. Traders buy and sell digital currencies like Bitcoin, Ethereum, Solana, XRP, Dogecoin, and thousands of altcoins on exchanges such as Binance, Coinbase, and Kraken.
Types of Crypto Trading
Spot Crypto Trading:
Actual buying and selling of coins.
Margin Trading:
Using borrowed funds to amplify returns (high risk).
Futures and Perpetual Swaps Trading:
Popular for leveraged speculation without owning crypto.
Arbitrage Trading:
Profiting from price differences across exchanges.
Crypto markets operate 24/7 and are influenced by global sentiment, technological innovations, regulations, and market cycles.
6. Bond and Fixed-Income Trading
Bonds are debt instruments issued by governments, corporations, and municipal bodies. They are traded mostly in OTC markets.
Major Types of Bond Trading
Government bonds (U.S. Treasuries, Indian G-Secs)
Corporate bonds
Municipal bonds
High-yield bonds
Bond traders focus on interest rates, inflation data, monetary policy, and credit ratings.
7. ETF and Mutual Fund Trading
Exchange-Traded Funds (ETFs) trade like stocks but represent a basket of assets such as indices, sectors, commodities, or bonds.
ETF Trading Types
Index ETFs: Track major indexes
Sector ETFs: Technology, banks, energy
Commodity ETFs: Gold ETF, oil ETF
Leveraged ETFs: 2x or 3x exposure
Mutual fund trading is not intraday; purchase and redemption occur at day-end NAV.
8. Algorithmic & High-Frequency Trading (HFT)
Algorithmic trading uses automated computer programs to execute trades based on predefined rules. High-Frequency Trading focuses on extremely fast trades using powerful servers and low-latency connections.
Common Algo Strategies
Market making
Statistical arbitrage
Trend-following
Mean reversion
These strategies dominate global equity and forex markets.
9. Social & Copy Trading
Platforms like eToro allow traders to copy the strategies of top-performing traders. New traders benefit by following experienced professionals.
10. Dark Pool Trading
Dark pools are private exchanges where large institutional investors trade without publicly revealing their orders. This prevents price distortion caused by large trades.
11. OTC (Over-the-Counter) Trading
OTC trading happens directly between parties rather than on centralized exchanges. It is common in:
Forex
Bonds
Derivatives
Small-cap stocks
OTC trading provides flexibility but may involve higher counterparty risk.
Conclusion
The world market offers a wide spectrum of trading types, each with unique characteristics, risk levels, and opportunities. From stock and forex trading to advanced derivatives and algorithmic trading, the global financial landscape is vast and dynamic. Traders choose their preferred style based on time availability, capital, market knowledge, and psychological comfort. Understanding the various types of trading is the first step toward developing a strategy aligned with personal goals. As markets continue to evolve with technology and globalization, traders have more tools and asset classes than ever before, making the world of trading accessible and full of potential.
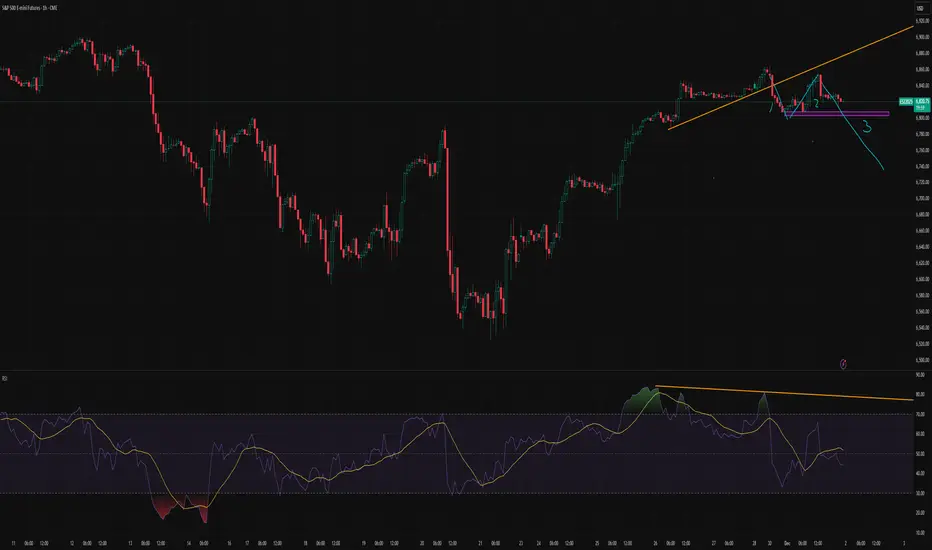
Inside and only slightly higher dayThe structure in the daily chart for the S&P 500 implies an inside day and slightly higher for the Thursday trading session.

ES (SPX, SPY) Analysis, Levels, Setups for Thursday (Dec 4th)Market Outlook: Key Event and Trading Strategy
Main Event: Tomorrow's primary focus will be the release of US Initial Jobless Claims at 8:30 AM ET. Market participants should anticipate a significant increase in volatility during the premarket session surrounding this announcement. Notably, no other major US economic indicators of similar significance are scheduled to be released, which typically influence the E-mini S&P 500 (ES) as consistently as Jobless Claims does.
Investors should consider the 8:30 AM release as the initial decision point. It is advisable to allow for the initial volatility spike to materialize before assessing market levels as they begin to normalize. The A++ trading setups detailed below are designed to activate following the 8:30 move, ideally capitalizing on opportunities that arise during the morning session in New York.
Market Analysis: Current Landscape and Outlook
Daily Overview: The E-mini S&P 500 (ES) has maintained an upward trajectory, approaching the swing high levels from November. Currently, the price is positioned within the upper range of recent activity, just below a significant resistance zone situated in the high 6800s to low 6900s. While daily momentum indicators remain in positive territory, they are showing elevated levels, suggesting potential for upside continuation. However, the reward for initiating new long positions in proximity to resistance appears limited at this juncture.
An examination of the four-hour chart reveals a sideways trading band beneath the recent highs. Despite repeated attempts to breach the upper boundary, gains have not been sustained, though buyers continue to defend pullback levels. Below the current price, a notable demand zone exists between 6815 and 6825, with a deeper support area around 6780 to 6790. Should the 6815 level hold on a closing basis, the medium-term trend remains favorable.
Today’s price activity has formed a tight range, approximately between 6857 and 6865, with the previous day’s high located near 6873 and early lows today around 6820. The market appears to be consolidating near last week’s highs, with clear liquidity zones identified both above 6873 and below 6840.
For the overnight session extending into the New York trading day, the expectation is sideways-to-up as long as the price remains above 6815. This scenario suggests potential squeezes toward the 6885 to 6900 range before a more significant decision point emerges. Conversely, a decisive break and 15-minute close below the 6815 level would open the door to the 6780 to 6790 region and would likely temper the bullish outlook heading into Friday's session.
A++ Setup 1 - Short from upper band 6885-6898
Entry zone: 6882-6888 short on the first clean 5m lower high after the 15m rejection.
Initial stop: above 6898 (or 2-3 points above the rejection wick if that printed higher). From a mid-band entry, this is roughly 10-12 points of risk.
• TP1: 6860-6863 (return to the top of today’s box and prior week high zone).
• TP2: 6835-6840 (mid-band support).
• Optional runner TP3: 6818-6822 if 6840 fails and selling pressure accelerates.
Invalidation
A decisive 15m close above 6898 that then holds on a pullback. In that case, the short idea is downgraded and price is more likely aiming for 6915-6925.
A++ Setup 2 - Long from demand pocket 6815-6825
Entry zone: 6820-6826 long after the first clean 5m higher low and reclaim of 6825.
Initial stop: under 6808-6810, below the rejection wick and the lower edge of the pocket. From a 6823 entry this is about 13-15 points of risk.
• TP1: 6857-6860 (today’s box floor and first resistance on the way back up).
• TP2: 6868-6873 (prior day high and recent NYPM highs).
• Optional runner TP3: 6885-6895 if price continues squeezing toward the upper resistance band.
Invalidation
A 15m close beneath 6810 that is not reclaimed quickly. That opens the way toward 6780-6790 and downgrades the long.
Good Luck !!!
Day 79 — 100% Accuracy: When Market Structure Just Works Ended the day +$254 trading S&P Futures. Today was one of those rare "easy" days where the market structure and signals aligned perfectly. We saw some early volatility when news broke regarding MSFT, causing a quick market drop. However, once it was confirmed that the news was fake, the market pumped right back up. I stayed calm, trusted the signals, and let the market play out, resulting in a stress-free green day.
Well-Being: Good
🔔News Highlights: *DOW JUMPS 400 POINTS, VIX TUMBLES AS STOCKS END HIGHER ON RATE CUT HOPES
📈Key Levels for Tomorrow:
Above 6830= Bullish Level
Below 6800= Bearish Level

ES UpdateRTY MFI hit oversold so small caps went straight up today. Expecting the same when ES MFI hits oversold. Something to keep an eye on.

AI Stocks Started Sneezing… and Indices May Have Caught a Chill?The NASDAQ (a.k.a. the AI theme park) just printed a much lower monthly low.
ES? It dipped… but only politely.
That mismatch matters. When tech acts tired, the broader market usually needs caffeine — or a correction.
The Indicators Are Whispering… and They Don’t Sound Bullish
The CCI is saying “lower highs,” while price is saying “higher highs.”
Classic divergence.
The MACD histogram is fading like holiday lights at 4 a.m.
Momentum? Not dead — just yawning.
Three Levels That Could Decide Whether Santa Shows Up
Think of December like a video game boss fight with three phases:
6,525.00 → First alarm bell. Break it and the mood changes.
6,239.50 → “Bear trap danger zone.” Plenty could happen here.
4,430.50 → The deep level nobody wants to talk about, but everyone should mark.
If ES finds its footing near 6,239.50, Santa still has a shot.
If not… well… Grinch season might come early.
ES & MES Contract Specs + Margins
E-mini S&P 500 Futures (ES)
Tick size: 0.25 index points = $12.50
Approx. margin (as of now): ~$22,400 per contract
Micro E-mini S&P 500 Futures (MES)
Tick size: 0.25 index points = $1.25
Approx. margin (as of now): ~$2,240 per contract
Margins vary by broker and can change with volatility, but these figures reflect current exchange-level requirements.
Risk Management: The Only Real Holiday Magic
ES and MES give traders the same view of the market but with different intensity levels.
December is emotional, fast, and occasionally rude — so size positions like someone who wants to enjoy the holidays, not stress through them.
Pick a zone → define the invalidation level → cap your dollar risk → choose ES or MES accordingly.
Simple. Calm. Holiday-friendly.
Final Thought
Santa hasn’t canceled the rally yet. But AI stocks aren’t exactly singing Christmas carols either.
If the tech giants recover, December could still sparkle.
If they don’t… the sleigh might need a repair shop.
Either way: chart levels > seasonal hope.
Trade safe — and maybe hide a cookie for the market, just in case.
Want More Depth?
If you’d like to go deeper into the building blocks of trading, check out our From Mystery to Mastery trilogy, three cornerstone articles that complement this one:
🔗 From Mystery to Mastery: Trading Essentials
🔗 From Mystery to Mastery: Futures Explained
🔗 From Mystery to Mastery: Options Explained
When charting futures, the data provided could be delayed. Traders working with the ticker symbols discussed in this idea may prefer to use CME Group real-time data plan on TradingView: www.tradingview.com - This consideration is particularly important for shorter-term traders, whereas it may be less critical for those focused on longer-term trading strategies.
General Disclaimer:
The trade ideas presented herein are solely for illustrative purposes forming a part of a case study intended to demonstrate key principles in risk management within the context of the specific market scenarios discussed. These ideas are not to be interpreted as investment recommendations or financial advice. They do not endorse or promote any specific trading strategies, financial products, or services. The information provided is based on data believed to be reliable; however, its accuracy or completeness cannot be guaranteed. Trading in financial markets involves risks, including the potential loss of principal. Each individual should conduct their own research and consult with professional financial advisors before making any investment decisions. The author or publisher of this content bears no responsibility for any actions taken based on the information provided or for any resultant financial or other losses.

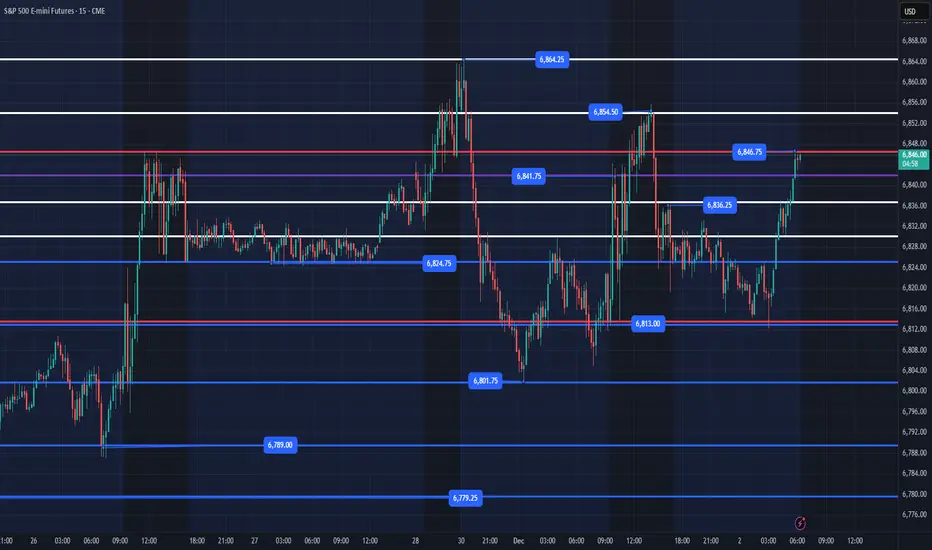
ES - December 3rd - Daily Trade PlanDecember 3rd- Daily Trade Plan - 6:10am
*Before reading this trade plan, if you did not read yesterday's take the time to read it first! (You can view the posts in the related publication section) *
If my posts provide quality information that has helped you with your trading journey. Feel free to boost it for others to find and learn, also!
My daily trade plan and real-time notes that I post are intended for myself to easily be able to go back and review my plan and how I did from an execution perspective.
--------------------------------------------------------------------------------------------------------
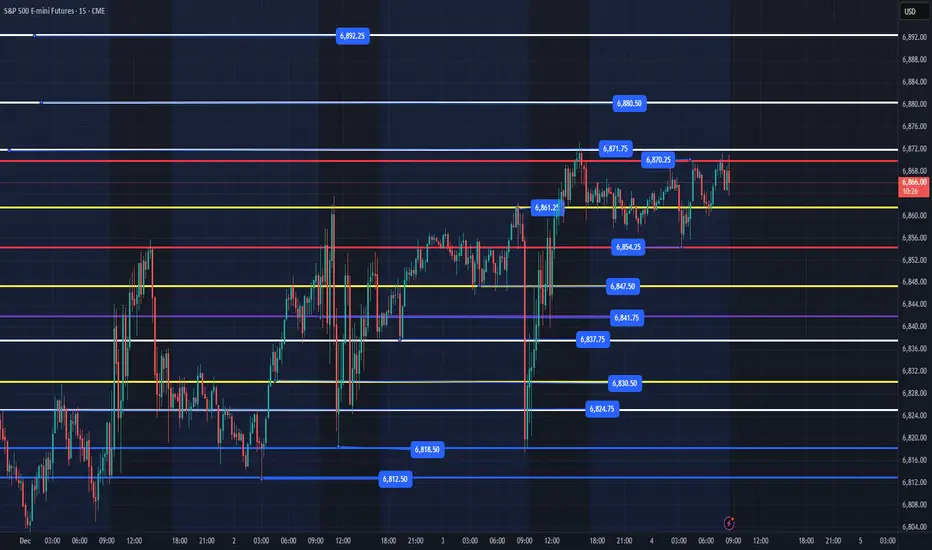
Yesterday we had some really good intraday levels that price continued to respect with no overnight session low that was flushed and reclaimed. You can see that we chopped around and have continued to maintain the range between 6812-6864.
Let's discuss today and what we are looking for. Our overnight session low is 6837 and our high is 6857. Price has been building a very tight range over the past few sessions, and we are getting close to a breakout or breakdown that could trigger today or tomorrow. Since we are not fortune tellers, we will need to focus on identifying levels we can grab points from today.
Key Levels Today
1. 6847 flush and reclaim (lower quality)
2. 6837 flush and reclaim (medium quality)
3. 6824 flush and reclaim (medium quality)
4. 6818 flush and reclaim (high quality)
5. 6812 flush and reclaim (high quality)
6. 6801 flush and reclaim (high quality)
Below these levels and price will most likely be selling off and I would be getting out the way and let price find a level below to reclaim and move higher.
I will post an update around 10am EST
----------------------------------------------------------------------------------------------------------------
Couple of things about how I color code my levels.
1. Purple shows a current or prior weekly low
2. Red shows the current overnight session High/Low (time of post)
3. Blue shows the previous day's session Low (also other previous day's lows)
4. Yellow shows core support/resistance levels
5. White shows overhead resistance/targets
Day 78 — Surviving the Chop: When Nothing WorksEnded the day +$36.64 trading S&P Futures. Today was super stressful despite the small green finish. The market structure was flipping up and down constantly, with no real trend and moving averages/zones failing to hold. It honestly felt like one of those days where the Market Makers are specifically trying to break trader psychology and force mistakes. Usually, when I see this kind of chop and manipulation, it signals that a big directional move is brewing for later in the week.
📰 News Highlights
OPENAI DECLARES ‘CODE RED’ AS GOOGLE NASDAQ:GOOGL CLOSES IN
🔑 Key Levels for Tomorrow
Above 6830 = Bullish Below 6800 = Bearish

S&P 500 Key Levels to Monitor:Trading Approach:
If you're LONG now: Consider taking partial profit or tightening stop
If you're FLAT: Wait for retest at 6,814-6,780 to enter long
If it bounces hard at 6,814: That's your buy signal for 7,000 target
You're reading the chart well — the rejection at 6,864 + weak 15-min candle = retest is likely beginning. Stay patient! 🎯
123 Pattern, The decline will find support.Divergence occurred before the broader market declined. Currently, it has broken below the trendline and is likely to resume the downtrend after a pullback. The medium-term top has not yet formed—following the decline, the market is highly probable to find support and may continue to hit new highs this month.
Buyers made an attemptBuyers in the daily chart of the S&P 500 made an attempt to push the market to new lies but it failed to hold onto those highs and backed off to lower prices by the close. The expectation is buyers will make another attempt towards the upside with an objective of 6881.

S&P500: Futures Stuck in Tight Range S&P 500 futures traded mostly sideways yesterday, remaining confined within a tight range. In our primary scenario, however, we anticipate that magenta wave (4) will soon resume its downward move. During this phase, the index is expected to initially break below the support levels at 6540 and 6371 points. We then look for the final low of the wave (4) correction to occur within our green Long Target Zone between 6163 and 5912 points. Once this low is established, the subsequent wave (5) should propel prices above resistance at 6952, marking the peak of the broader blue wave (III). Immediately after, we expect the onset of magenta wave (1), which should kick off a significant corrective phase. However, if the index continues to fall below the Long Target Zone, our alternative scenario may come into play (probability: 31%). In that case, it would suggest that the alternative blue wave alt.(III) has already completed and the major correction is already in progress.

ES - December 2nd - Daily Trade PlanDecember 2nd- Daily Trade Plan - 6:20am
*Before reading this trade plan, if you did not read yesterday's take the time to read it first! (You can view the posts in the related publication section) *
If my posts provide quality information that has helped you with your trading journey. Feel free to boost it for others to find and learn, also!
My daily trade plan and real-time notes that I post are intended for myself to easily be able to go back and review my plan and how I did from an execution perspective.
--------------------------------------------------------------------------------------------------------
I was on vacation with my family last week and received a lot of messages asking about my daily trade plan. I have not posted since the 25th as I was travelling and enjoying time with my family. I hope you had a great Thanksgiving and spent time with your families!
Let's get into today!
The overnight low is 6813 and overnight high is 6846. Since my last daily trade plan, we have been consolidating between 6789 - 6864. We have had some great trades around the 6800-6815 level that has been a magnet over the past sessions. We still have not made a higher high during this time. Until we clear 6854, 6864 we are technically in a range that has been bought and sold between 6813-6864. Price should continue higher and I do not expect price to lose 6779 (lowest) for us to continue higher. IF price loses 6779, we will most likely need to head lower to find levels to engage to take us higher. Until then, let's look at areas that could produce some points today.
Key Levels Today
1. 6813 flush and reclaim
2. 6801 flush and reclaim
3. 6789 flush and reclaim
Below these levels and price will most likely be selling off and I would be getting out the way and let price find a level below to reclaim and move higher.
I will post an update around 10am EST
----------------------------------------------------------------------------------------------------------------
Couple of things about how I color code my levels.
1. Purple shows the weekly Low
2. Red shows the current overnight session High/Low (time of post)
3. Blue shows the previous day's session Low (also other previous day's lows)
5. White Levels are previous day's session High/Low
Understanding CPI (Consumer Price Index)1. Headline CPI vs Core CPI
Headline CPI represents the total inflation, including all goods and services, such as food and energy. It is the most commonly cited figure in news reports.
Why headline CPI matters: It shows the immediate impact of inflation on consumers, reflecting changes in everyday expenses.
Core CPI excludes volatile items such as food and energy, which can fluctuate sharply due to seasonal changes or geopolitical events. Core CPI provides a clearer view of underlying, persistent inflation trends.
Why core CPI matters: Policymakers, especially central banks, prefer core CPI to guide interest rate decisions since it is less affected by short-term price swings.
For example, if headline CPI jumps due to a spike in oil prices, the core CPI may remain steady, indicating that the broader inflation trend is stable.
2. CPI Components and Categories
CPI is broken down into categories that reflect typical consumer spending patterns. These categories are weighted according to their importance in the average household budget. Common CPI components include:
Food and Beverages
Covers groceries, dining out, non-alcoholic beverages, and alcohol.
Highly sensitive to seasonal changes, supply chain disruptions, and agricultural output.
Housing
Includes rent, owners’ equivalent rent (OER), and utilities.
Often the largest component in CPI, reflecting the substantial share of housing in household budgets.
Transportation
Includes vehicle purchases, gasoline, public transit, and airline fares.
Sensitive to fuel prices, geopolitical risks, and transportation demand.
Medical Care
Covers health insurance, hospital services, and prescription drugs.
Price increases in healthcare can impact the middle and lower-income population disproportionately.
Education and Communication
Tuition, books, digital communication, and phone services.
Rising costs in education often drive broader inflation concerns.
Recreation
Includes leisure activities, electronics, and entertainment services.
Generally less volatile but contributes to long-term inflation trends.
Apparel
Clothing and footwear.
Seasonal sales and fashion trends influence price changes.
Other Goods and Services
Personal care, tobacco, and miscellaneous items.
Weighting in CPI: Each category is assigned a weight reflecting its share of total consumer spending. For example, in the US CPI, housing constitutes about 40% of the total index, making it the dominant driver of inflation changes.
3. Monthly vs Yearly CPI Changes
CPI reports provide two main types of comparisons:
Month-over-Month (MoM) Change:
Measures price changes compared to the previous month.
Useful for short-term analysis and monitoring immediate inflation trends.
Example: If CPI rises 0.5% MoM, it shows the average prices increased by half a percent in the last month.
Year-over-Year (YoY) Change:
Compares prices to the same month in the previous year.
Indicates long-term inflation trends.
Central banks often focus on YoY CPI for monetary policy decisions.
Seasonal Adjustments: CPI data is often seasonally adjusted to account for predictable price fluctuations, such as holiday shopping or harvest periods, making month-to-month comparisons more accurate.
4. CPI Report Breakdown – Detailed Analysis
A comprehensive CPI report provides multiple layers of information:
a) Overall Index and Percentage Change
Shows the headline CPI and core CPI.
Includes MoM and YoY percentage changes.
b) Sub-Index Analysis
Each category’s price change is reported separately.
Example: Food +0.4%, Housing +0.3%, Transportation +0.7%.
c) Contribution to Overall CPI
Categories are weighted to show their influence on the total CPI.
Example: Even if food prices rise sharply, their small weight in the index may result in a modest overall CPI increase.
d) Regional or Demographic Breakdown
Some countries provide CPI data by region or city.
Enables policymakers to assess localized inflation pressures.
e) Special Notes and Revisions
CPI reports include methodological notes, such as changes in survey methods, seasonal adjustments, or revisions to previous months.
5. CPI Interpretation for Policy and Investment
Central Banks and Monetary Policy:
CPI informs interest rate decisions to control inflation.
If CPI rises above the target range, central banks may increase rates to curb spending.
If CPI falls too low, it signals deflation, prompting rate cuts or stimulus.
Investors and Financial Markets:
Rising CPI may lead to higher bond yields and stock market volatility.
Traders monitor CPI closely for clues about inflation-driven asset performance.
Businesses and Wage Negotiations:
Companies use CPI to adjust pricing strategies, cost structures, and wages.
Labor unions and employees use CPI to negotiate cost-of-living adjustments (COLAs).
6. Limitations of CPI
Despite its importance, CPI has several limitations:
Does Not Capture All Consumer Experiences:
CPI represents an “average” basket and may not reflect specific household spending patterns.
Excludes Certain Goods:
Luxury goods, investment assets, and some services may not be fully included.
Quality Adjustments:
CPI tries to account for improvements in product quality, but this adjustment can be subjective.
Substitution Bias:
CPI assumes consumers purchase the same basket, even if prices change. In reality, people may substitute cheaper alternatives.
7. CPI and Inflation Trends
Monitoring CPI trends over time reveals the economy’s inflationary pressures:
Moderate CPI Increase: Healthy for economic growth, signaling rising demand and controlled inflation.
High CPI Increase: Indicates overheating economy, potential wage-price spirals, and higher interest rates.
Negative CPI: Signals deflation, reduced consumer spending, and economic slowdown.
Analysts often compare CPI to other indicators, such as Producer Price Index (PPI), wage growth, and commodity prices, to get a complete picture of inflation.
8. Example of CPI Report Interpretation
Imagine a CPI report shows:
Headline CPI YoY: +4.2%
Core CPI YoY: +3.5%
Food +2.0%, Energy +8.0%, Housing +4.0%
Interpretation:
The economy is experiencing moderate inflation, driven mainly by energy costs.
Excluding volatile items, the underlying inflation (core CPI) is more moderate.
Policymakers may consider gradual interest rate adjustments rather than aggressive hikes.
Consumers are feeling price pressures in daily essentials, especially fuel.
Conclusion
The CPI report is a vital tool for understanding inflation dynamics. Its detailed breakdown, including headline and core CPI, sub-indices, weights, and changes over time, allows stakeholders to assess economic conditions accurately. While it has limitations, when combined with other economic indicators, CPI provides invaluable insights for central banks, investors, businesses, and policymakers.
Understanding the CPI report is not just about numbers—it’s about interpreting how inflation impacts purchasing power, policy decisions, and overall economic health. Accurate analysis can guide investments, wage negotiations, and policy strategies, making it a cornerstone of economic literacy.
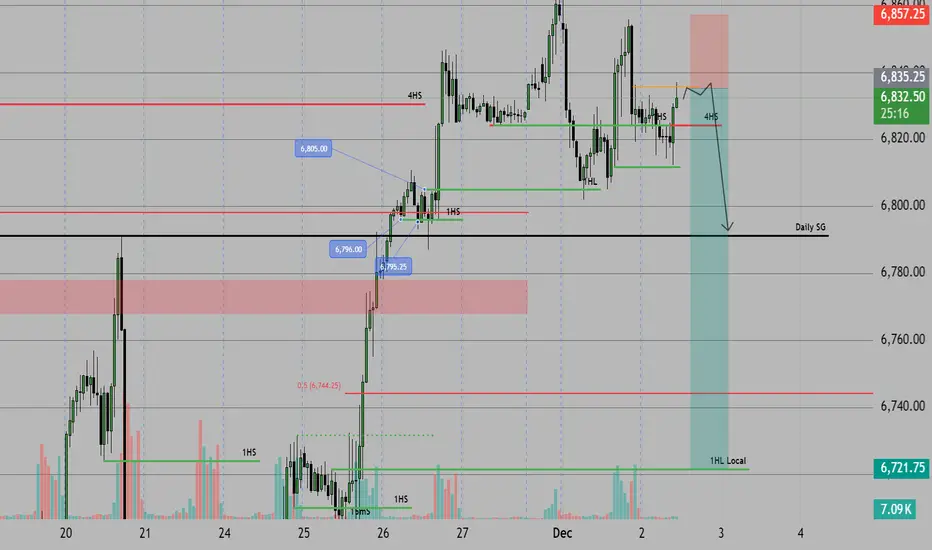
ES the big fall day ?Looking to short ES today to 6720 area.
based on yesterday movement that weren't able to make new local HOD => assuming today we will go lower .
SL close above 6855
ESZ2025 Sellsi'm looking for price to start respecting that 1h.ifvg lower, then i will join in with a 5m -OB. But overall i'm bullish. this is not a financial advice

ES - 30 min SHORT term view - Trading in balance !ES - 30 min SHORT term view - Trading in balance !; Overnite trade is totally mechanical short term hands to note. let the value build for tomorrow to check in.

S&P Futures Trading Day 77 — Locking Gains in a Scary MarketEnded the day +$247.39 trading S&P Futures. I came into the session with a bullish bias thanks to the market structure, and initially, things looked great as I caught a nice move breaking over the 1-minute MOB. However, the market had some tricks up its sleeve—I got stop-hunted trying to play the breakout zone at 6828, giving back some profits. I didn't let that rattle me, though; I went long again at support off the 11:10 signal, made the money back, and hit my ~$250 goal. With how "scary" and fragile everything feels lately, I decided to just lock in the smaller gains and call it a day.
📰 News Highlights
*BITCOIN TUMBLES 5% TO $86K AMID CRYPTO SELLOFF
🔔 VX Algo Signals
9:00 AM — MES Market Structure flipped bullish (X3) ✅
11:10 AM — VXAlgo NQ X1DP Buy Signal ✅
2 out of 2 signals worked — 100% accuracy today.
🔑 Key Levels for Tomorrow
Above 6830 = Bullish Below 6800 = Bearish

ES (SPX, SPY) Analysis, Levels, Setups for Tue (Dec 2nd)The market structure remains optimistic on the higher timeframes, bolstered by a significant rebound from the 6,520 levels. Currently, prices are fluctuating in the upper range of this move, consolidating between the intraday support and the previous weekly high. Although momentum indicators are stretched, they have yet to indicate a reversal, suggesting a potential continuation toward resistance levels R1 and possibly R2, provided that buyers can uphold the nearest support zones. Conversely, a failure to maintain support at S1 and S2 could pave the way for a deeper corrective phase targeting S3.
The levels are remain the same from yesterday analysis.
A++ SETUP 1 - LONG FROM S2 RELOAD BAND (6,790-6,805)
look for an overnight or early NY flush into 6,800 ± 10 points, followed by a strong rejection: wick below S2 on 15m, close back inside the band, plus a higher low on 5m.
Entry zone: 6,800-6,795 (inside S2 once rejection shows).
Hard stop: 6,780 (below the lower edge of S2 and recent wick structure).
TP1: 6,845-6,855 (back through S1 into the middle of the current range).
TP2: 6,870-6,885 (R1 test).
A++ SETUP 2 - SHORT LIQUIDITY SWEEP INTO R1 (6,870-6,885)
during London or NY AM, price spikes through 6,870 into the 6,870-6,885 band, takes out prior highs, but then prints a rejection: 15m candle with an upper wick and close back below about 6,875, plus a lower high on 5m.
Entry zone: 6,875-6,880 after the rejection is confirmed, not on the first blind touch.
Hard stop: 6,895 (above the top of R1; acceptance above there suggests a push toward R2).
TP1: 6,835-6,840 (back into S1).
TP2: 6,800-6,795 (retest of S2).
Key Events and Data to Watch on Tuesday
Tomorrow's U.S. session will be pivotal, focusing on key indicators of manufacturing and construction. The final S&P Global U.S. Manufacturing PMI will be released at 9:45 a.m. ET, followed closely by the ISM Manufacturing Index at 10:00 a.m. ET—both crucial for assessing factory activity and the momentum of economic growth. Concurrently, the Commerce Department will unveil October Construction Spending figures, a vital metric for understanding demand in infrastructure and housing sectors. Additionally, domestic vehicle sales data will be published, providing further insight into consumer strength.
Moreover, the OECD's latest Economic Outlook will present updated global growth projections, which could significantly influence market risk appetite. As markets remain attuned to indicators of decelerating economic activity, any surprises in these reports could lead to notable shifts between support levels (S2) and resistance levels (R1/R2), potentially reinforcing expectations for a rate cut from the Fed in December.