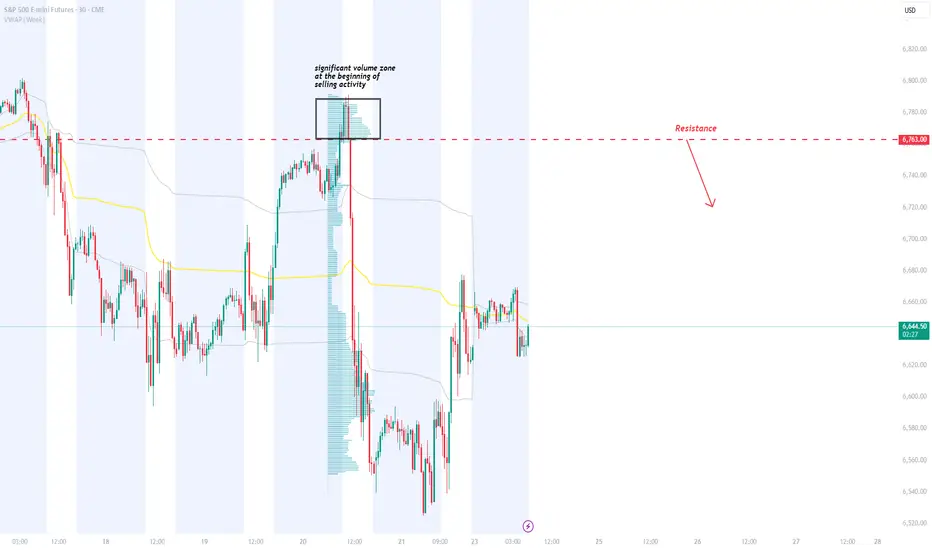
ES 6763: Heavy-Volume Resistance + FVG Confluence Short SetupPrice is approaching a strong resistance on ES at 6763. This level sits at the start of a heavy-volume zone created during a major selloff, where sellers built short positions and are likely to defend again. A bearish Fair Value Gap aligns with the same level, adding strong confluence. If price pulls back into 6763, the short setup becomes highly attractive.
Micro E-mini S&P 500 Index Futures
No trades
Market insights
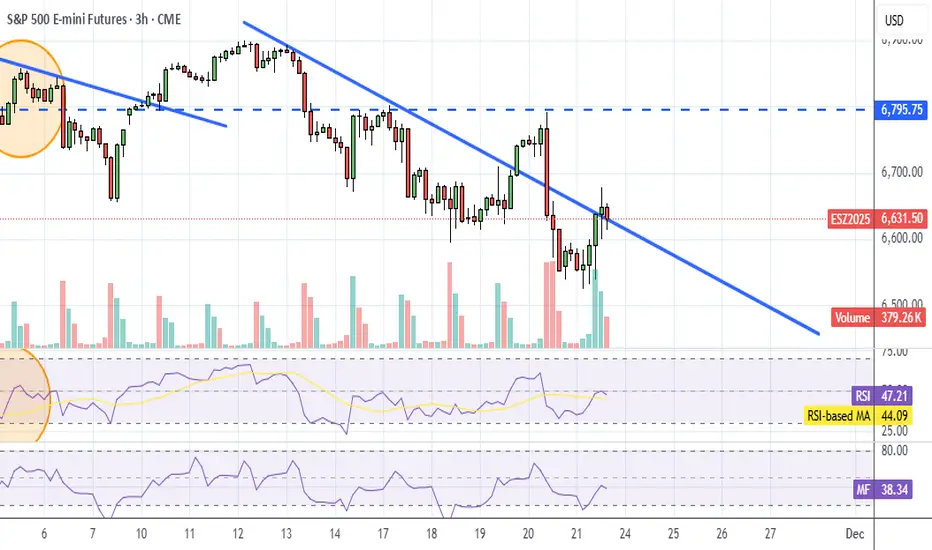
ES (SPX, SPY) Week Ahead Analysis - (Nov 24th - 28th)Executive Overview
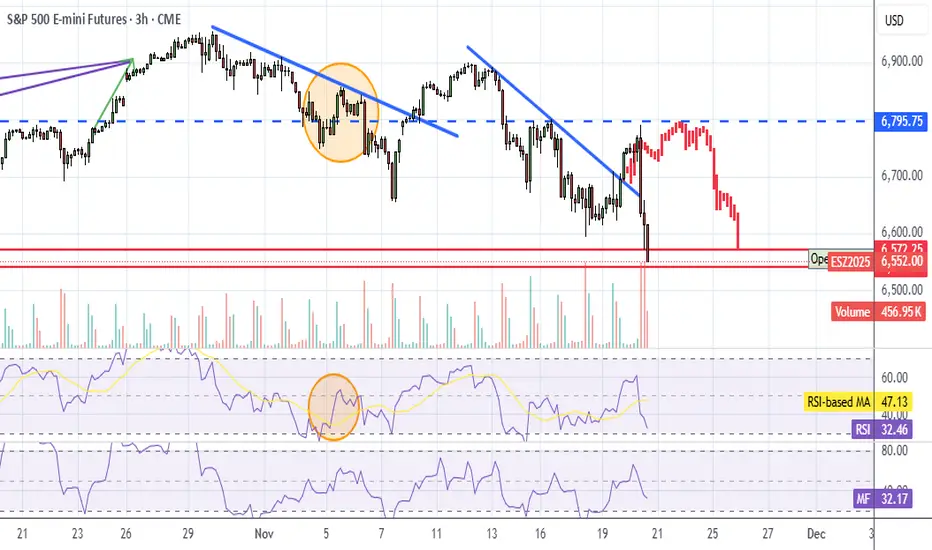
Equity markets, particularly the E-mini S&P 500 (ES), are currently navigating a broader weekly uptrend, yet have entered a phase of short-term correction after encountering resistance around the 6,900 to 7,000 level. Presently, prices hover near 6,660, finding support from a robust pocket in the mid-6,500s.
Recent volatility indices have surged, with the VIX now in the low 20s and the term structure exhibiting a near flat or slight backwardation. Meanwhile, key credit metrics, funding conditions, and spread behaviors remain stable, suggesting that the current market dynamics are more indicative of equity valuation adjustments and positioning realignments rather than a sign of systemic distress.
Looking ahead to the coming week, we anticipate a choppy trading environment characterized by two-sided price movements within a range of 6,520 to 6,780. Intraday strategies are likely to involve selling into strength around resistance levels R1 and R2, while seeking to capitalize on buying opportunities when prices approach support levels S1. Notably, the VIX is expected to remain elevated above its recent teens regime during this period.
A critical point of focus will be the 6,520 to 6,540 support zone. Should this area fail to hold on a daily closing basis, we could see the correction extend toward the 6,420 to 6,450 range, with further downside potential targeting the low-6,300s.
Multi-Timeframe Analysis of Market Structure
Weekly Trend: Premium/Discount
The current market structure remains characterized by higher highs (HH) and higher lows (HL). The last significant upward movement peaked just shy of 7,000, while the ongoing pullback has managed to hold above the previous weekly higher low band, located in the high-5,000s to low-6,000s range. A notable supply zone exists from approximately 6,850 to just above 7,000, identified as a weak high. Below this, a robust demand/value area spans from around 5,850 (at the 1.272 Fibonacci retracement) down to approximately 5,575 (the 2.0 Fibonacci level) from the previous major leg. On this timeframe, the E-mini S&P (ES) is trading at a premium in relation to the substantial 5,800–5,900 weekly value area. However, we have transitioned from momentum-driven expansion to a mean-reverting correction phase.
Daily Trend and Range
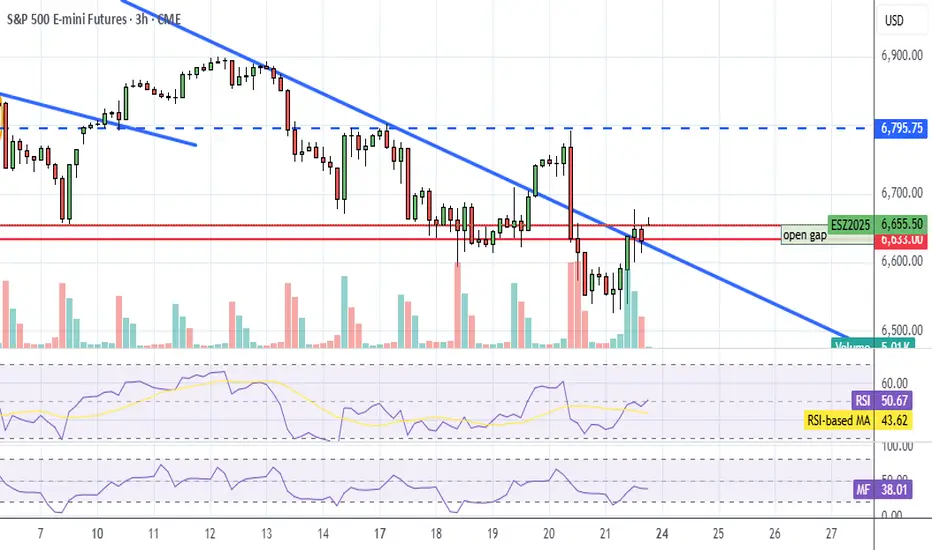
Shifting to a daily perspective, the structure has inverted to a short-term downtrend, marked by a lower high established near 6,900, followed by a lower swing low around the 6,520s. Fibonacci retracement levels from the last sell-off align as follows: 1.272 at approximately 6,521, 1.618 at around 6,418, and 2.0 at approximately 6,304. The 6,520s zone is precisely where price action found support. For the upcoming week, the operative daily range can be defined between 6,520–6,540 as the lower band and 6,760–6,780 as the upper band, coinciding with the previous breakdown area and recent four-hour lower high.
Four-Hour Structure
Analyzing the four-hour chart reveals a clear downward impulse from the mid-6,700s lower high to lows in the mid-6,500s, followed by a sharp rebound. A Fibonacci sequence applied to this movement suggests retracement levels of 1.272 at approximately 6,527, 1.618 at around 6,455, and 2.0 at roughly 6,376. These levels coincide with a notable demand block around the 6,520–6,540 range, identified as a "strong low," with additional liquidity found in the 6,450s and 6,370s. The recent upward movement from these lows appears corrective within the broader impulse, indicating a potential lower high is forming under the 6,680–6,700 area. Until price reclaims and maintains this band, the four-hour swing remains in a down-to-sideways trend.
Hourly Context
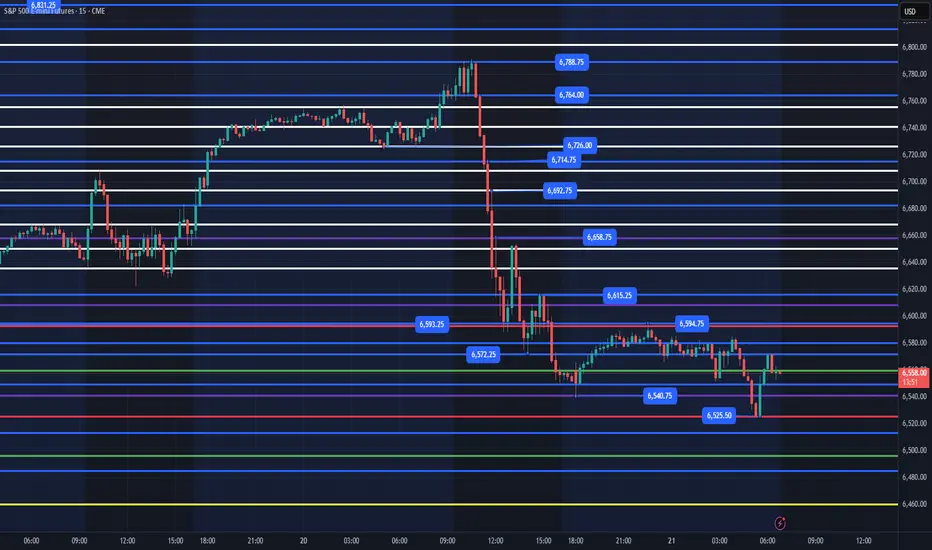
From an hourly viewpoint, the ES experienced a decline from approximately 6,770 to the mid-6,500s, subsequently establishing a series of higher lows as it grinds upward. Recent hourly activity shows price pressing against an overhead resistance zone located around 6,660–6,670, just beneath the Asia Session high of 6,662.5 and the New York PM high / previous day high at 6,677.5. The volume-weighted average price (VWAP) is situated near 6,609.75, with prior intraday lows clustering between 6,594 and 6,611.75. Intraday, the ES is currently mid-range, confined between support levels at 6,640–6,642 (Asia Session Low) and resistance at 6,662.5–6,677.5 (Asia Session High / New York PM High / Previous Day High / Yearly Value Area High).
Weekly and Daily Oscillators / Momentum
The weekly oscillator has retracted from overbought conditions but remains elevated, signifying a cool-off within a strong uptrend. Conversely, the daily oscillator is currently oversold and beginning to reverse, showing readings in the mid-20s with the first uptick following a significant downturn. This pattern is classic for potential bounces; however, confirmation of a full trend reversal is yet to materialize.
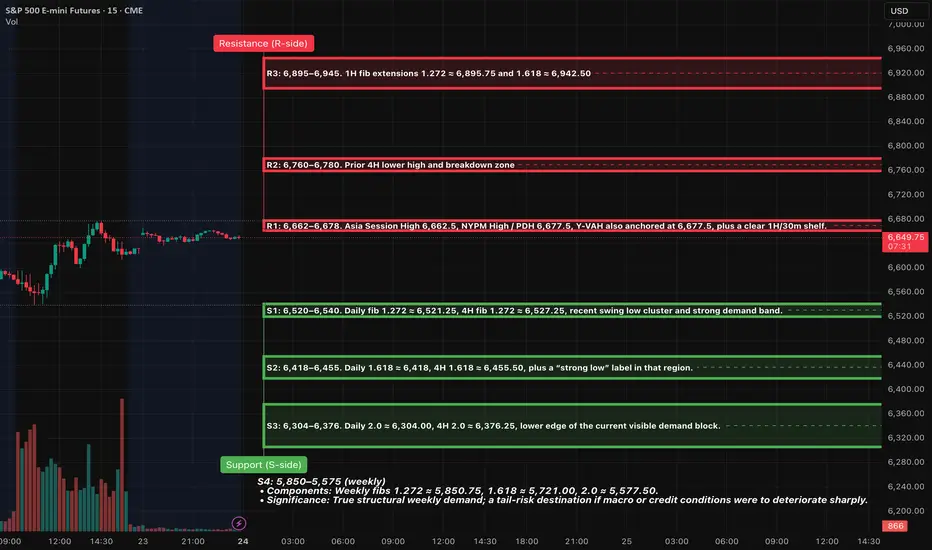
Key levels and zones
Resistance (R-side)
R1: 6,662–6,678
• Components: Asia Session High 6,662.5, NYPM High / PDH 6,677.5, Y-VAH also anchored at 6,677.5, plus a clear 1H/30m shelf.
• Significance: This is the nearest control ceiling; it capped Friday’s rebound and marks the boundary between neutral intraday and more aggressive squeeze potential.
• Role: First place to fade “pop-and-fail” wicks for short A++ plays, and the first area that must be decisively reclaimed for bulls to press a larger squeeze.
R2: 6,760–6,780
• Components: Prior 4H lower high and breakdown zone; 1H HH before the large red impulse bar; sits just below a dense daily supply band.
• Significance: A retest of broken support turned resistance. Acceptance back above here would suggest the entire recent flush was a failed breakdown, opening the path to retest the highs.
R3: 6,895–6,945
• Components: 1H fib extensions 1.272 ≈ 6,895.75 and 1.618 ≈ 6,942.50, plus prior weekly weak high / supply band just under 7,000.
• Significance: This is the larger-timeframe cap. Reaching this zone in one week would likely require either a decisively dovish Fed tone or very strong data.
---
Support (S-side)
S1: 6,520–6,540
• Components: Daily fib 1.272 ≈ 6,521.25, 4H fib 1.272 ≈ 6,527.25, recent swing low cluster and strong demand band.
• Significance: This is the primary weekly pivot for the current correction. First major A++ long location if it’s flushed and reclaimed during liquid hours.
S2: 6,418–6,455
• Components: Daily 1.618 ≈ 6,418, 4H 1.618 ≈ 6,455.50, plus a “strong low” label in that region.
• Significance: This is deeper discount inside the current swing, where larger timeframe players would be expected to defend aggressively if the broader uptrend is to remain intact.
S3: 6,304–6,376
• Components: Daily 2.0 ≈ 6,304.00, 4H 2.0 ≈ 6,376.25, lower edge of the current visible demand block.
• Significance: If price reaches here this week, the market is in a full-fledged risk-off extension, but still within the context of the broader weekly uptrend.
S4: 5,850–5,575 (weekly)
• Components: Weekly fibs 1.272 ≈ 5,850.75, 1.618 ≈ 5,721.00, 2.0 ≈ 5,577.50.
• Significance: True structural weekly demand; a tail-risk destination if macro or credit conditions were to deteriorate sharply.
---
Volatility Backdrop
The VIX spot closed at approximately 23.4 on Friday, having surged beyond 26 earlier in the week, marking the highest levels observed since spring. The VIX futures curve has shifted to a flat or mildly backwardated structure, with near-term contracts hovering around 22.9 for late November and extending into subsequent months. Meanwhile, rates volatility (MOVE) is situated near 78–79, close to its historical average, indicating it is not in crisis territory.
The volatility complex is signaling a notable expectation of an equity shock, although it does not reflect panic in the funding or rates sectors. The flat to slightly backwardated volatility curve suggests potential for larger intraday swings and gap risks, while also presenting significant reward opportunities when market entries align with critical price levels.
Options and Positioning
The total put/call ratio currently stands at approximately 0.87, with the index put/call ratio around 1.03, and exchange-traded products (ETP) at about 1.28. In contrast, the equity-only put/call ratio is at a lower 0.56. The 10-day moving average of the total put/call ratio is approximately 0.90, which is not indicative of panic extremes. The SKEW index is around 148—elevated, yet falling short of the extreme levels (150–160+) that typically signal substantial tail-risk hedging.
Institutional hedging remains present but lacks urgency; there is a distinct preference for put options in indices and ETFs, while single-stock options continue to skew toward calls. Coupled with a VIX in the low-20s and a near-flat curve, this indicates that dealers are likely moderately short gamma at current strike prices. Consequently, price movements beyond key levels may extend further than usual before reversion occurs. This inference, drawn from the volatility and put/call configurations, does not represent a direct measurement.
Market Breadth and Internals
Earlier in the week, the NYSE experienced a significant imbalance, with decliners outnumbering advancers by more than 3:1, alongside a higher count of new lows than new highs, a classic indicator of distribution. However, by Friday, the breadth reversed sharply, with approximately 2,237 advancers against 548 decliners on the NYSE. Nevertheless, the McClellan Oscillator remains negative (~-72), and the Summation Index is in a downward trajectory, suggesting ongoing repair rather than the emergence of a new bull trend. Defensive sectors, including health care and consumer staples, have outperformed, while tech and speculative AI stocks led the recent selloff.
The market has transitioned from a clear uptrend to a choppy corrective phase characterized by distribution. The activity on Friday, while indicative of an oversold breadth thrust, has not confirmed a market bottom.
Credit and Funding
The high-yield ETF (HYG) is trading around 80.3, only slightly below recent highs, indicating no signs of disorderly selling. The US high-yield option-adjusted spread (OAS) is near 3.17%, and B-rated high-yield OAS is about 3.3%, both well below long-term averages (>5%) and only marginally above recent tight levels.
Conclusion:
Credit markets display relative calm, reinforcing the notion that the recent weakness in equities is driven by valuation and sentiment rather than a funding crunch.
Sentiment and Crowd Positioning
Recent AAII survey results indicate roughly 32.6% of respondents identify as bulls, while 23.9% classify as bears. This results in a negative bull-bear spread of about -11%, contrasted with a long-run average of +6%. The combination of an elevated VIX, a negative bull-bear spread, and moderate put/call ratios reflects a climate of pessimism without full-fledged capitulation.
Practical Takeaway:
There exists potential for an upward squeeze if macroeconomic headlines shift towards dovish sentiment. However, a prolonged risk-off environment remains possible if critical support levels like S1 and S2 break.
Cross-Asset and Global Risk Tone
Global equities experienced their most significant weekly pullback since early this year, with the MSCI World Index declining by roughly 3%. Europe’s Stoxx 600 recorded its largest weekly drop since summer, primarily driven by weakness in the tech sector and increased volatility. The cryptocurrency market is in a full risk-off stance, with Bitcoin dipping to a seven-month low before rebounding around $84k, accompanied by sentiment indicators reflecting extreme pessimism and heavy liquidations, now followed by a weekend bounce from oversold RSI levels.
Relative Risk Tone:
The Nasdaq-100 (NQ) remains weaker compared to the S&P 500 (ES), aligning with the decline in tech and AI sectors, while defensive and value-oriented sectors maintain resilience. Overall, the cross-asset narrative suggests a risk-off tone, yet not systemic in nature—exactly the backdrop where well-defined level trading is most effective.
Macro and Data Calendar
The upcoming holiday-shortened week is set to unveil a series of delayed U.S. economic data, including September retail sales, PPI, Core PPI, home prices, pending home sales, inventories, and consumer confidence on Tuesday, followed by jobless claims, durable goods, Chicago PMI, and the Beige Book on Wednesday. The prior government shutdown has postponed key GDP and inflation reports, heightening uncertainty around the Fed's December decisions. Federal Reserve officials exhibit divided opinions about another rate cut in December; some advocate for a pause with inflation near 3%, while others, including at least one governor and the NY Fed president, lean toward support for an additional 25 basis point reduction. Market odds for a December cut have shifted within a ~50–70% range, depending on daily fluctuations.
Classification of the Recent Move:
This market dynamic appears primarily as a reset in valuations and positioning following the exuberance surrounding AI and tech, exacerbated by data-related uncertainty rather than stemming from a definitive “data shock” event.
13. Two A++ setups (for the coming sessions)
These are plan-level plays, to be executed only if price action and vol conditions line up as described.
A++ Setup 1: R1 Rejection Short
Trigger
Inside NY AM or the first hour of NY PM:
1. 15m candle wicks above 6,670–6,675 and closes back under 6,665.
2. 5m prints a lower high beneath that wick, closing back below ~6,660.
3. 1m breaks down through the intraday shelf near 6,655 with increased selling volume / negative delta.
Execution
• Entry: around 6,660–6,665 on the first 1m pullback that fails under the broken shelf.
• Initial stop: above the wick high, e.g. 6,690 (adjust to the actual 15m high but keep risk in the 20–25 point range).
• Risk (example): entry 6,665, stop 6,690 → 25 pts.
Targets
• TP1: 6,615–6,620 (VWAP / prior intraday shelf) → about 2R (50 pts) from a 25-pt stop.
• TP2: 6,540–6,550 (upper edge of S1 / prior congestion) – roughly 4R.
• TP3 (runner): 6,520–6,530 (core of S1 cluster) – 5R+ if reached.
A++ Setup 2: S1 Flush-and-Reclaim Long
Trigger
15m candle flushes below 6,530, ideally tagging 6,520–6,525, with a long tail and closes back above ~6,535–6,540.
5m shows a higher low above the 15m wick low, with real bids stepping in and volume picking up.
1m pushes back through 6,545–6,550 and holds, turning that band into a floor.
Execution
• Entry: 6,545–6,550 on the first 1m pullback that holds above 6,540 after the reclaim.
• Initial stop: below the 15m flush low, e.g. 6,515–6,520.
• Example parameters: entry 6,550, stop 6,520 → 30-pt risk.
Targets
• TP1: 6,595–6,600 (local shelf / prior L at 6,594 and ONH/VWAP neighborhood) → about 2R (60 pts) from a 30-pt stop.
• TP2: 6,662–6,678 (R1 band) – the same ceiling from Setup 1; that’s roughly 4R+ from the entry.
• TP3 (runner): 6,760–6,780 (R2) if data and vol cooperate, giving 7R+ potential.
If that microstructure doesn’t show up, downgrade each play from A++ to stand-aside – let someone else fight in the middle of the range and keep your capital for when the levels truly light up.
Good Luck !!!
ID: 2025 - 0136.12.2025
Trade #13 of 2025 executed.
Trade entry at 162 DTE (days to expiration).
Excellent fills this morning, well under mid. Created a GTC working order two days ago and let price come to me. No chasing. There are TONS of external liquidity voids resting below.
Target profit is 5% ROI
Happy Trading!
-kevin

ES Gap AlertFutures are up but they all gapped up which means that has to fill, but you guys know that by now, lol. It is headed down right now.
Not sure what the pattern will be because market will be closed Thu and half day on Fri, and day after Thanksgiving is usually low volume trading.
We'll see what futures look like before open tomorrow.
ES1! – Retest of LVN Before Targeting Equal LowsThe S&P 500 (ES) shows clear weakness after breaking down from the previous highs.
Price is now pulling back into the LVN, a low-support area that often acts as a simple reaction point before continuation.
My idea:
I expect a small retracement into the LVN, followed by a bearish continuation aiming for the equal lows liquidity, and potentially extending toward the deeper volume zone around 6200.

Next week ES BearishNext week’s price outlook appears bearish.
Market structure shows a clear downtrend following the confirmed break of the previous swing low.
Price is expected to retrace into the iFVG before continuing lower toward the downside order block.
The iFVG aligns precisely with the lowest tick of the highest candle of the prior move and sits in the correct position relative to the previous supply zone.
The order block below is a high-probability area, as five liquidity lows are positioned directly above it.

S&P 500 E-mini Futures: Short Target Achieved, Long Setup 21.Nov
S&P 500 E-mini Futures: Short Target Achieved, Long Setup in Play
Today’s session on the S&P 500 E-mini Futures (ES) presented a textbook example of how patience and planning pay off in intraday trading. Let’s break down the trade idea, execution, and the next steps.
Market Context
Instrument: S&P 500 E-mini Futures (ESZ2025)
Current Price: 6,547.25 (-0.16%)
Timeframe: 15-minute chart
Session Behavior: After an initial push higher, the market showed signs of exhaustion near the previous high, creating an opportunity for a short scalp before considering a long re-entry.
Trade Recap: Short Position
Earlier today, a short position was initiated near the supply zone (highlighted in red on the chart) around 6,594.50, targeting a retracement toward the mid-range.
Entry: Around 6,594.50
Target: 6,532.25 (achieved successfully)
Reasoning: Price rejected the upper liquidity zone, forming lower highs and signaling a short-term bearish move. Volume spikes confirmed selling pressure.
This short trade hit its target cleanly, validating the setup and risk management.
Current Setup: Long Bias
With the short target achieved, the focus now shifts to a long re-entry. Here’s why:
Demand Zone: Price reacted strongly near 6,532.25, sweeping liquidity and bouncing back.
Volume Profile: Notice the spike in buying volume at the lows, suggesting accumulation.
Structure: The market is forming a higher low on the 15-minute chart, indicating potential bullish continuation.
Long Plan
Entry Zone: Between 6,532.25 and 6,528.25 (green zone)
Stop Loss: Below 6,523.25 (to protect against deeper liquidity sweep)
Target: Sweep of the day’s high near 6,604.75 or equal highs at 6,594.50 for partials.
Key Observations
Liquidity Sweep: The wick below 6,532.25 suggests stop hunts before reversal.
Risk-to-Reward: Favorable setup with tight stop and clear upside targets.
Market Sentiment: Despite intraday volatility, the broader trend remains bullish, supporting the long bias.
Conclusion
The short scalp was a success, and now the market offers a compelling long opportunity. Traders should monitor price action closely around the demand zone and manage risk diligently. If the bullish momentum holds, a sweep of the day’s high is likely.
✅ Pro Tip: Always wait for confirmation before entering a reversal trade. Volume and price structure are your best friends in identifying genuine shifts in momentum.
Do your own analysis before taking any decisions these are only my way of looking at the market today and valid for today only

E mini S&P 500 weekly outlook and HTF reference pointsCME_MINI:ES1!
Expansion levels on ES. Will approach on a day to day basis with the daily closures

Monday could set the tone for the weekMonday's price structure in the S&P 500 daily chart could set the tone for the rest of the week. Expected behavior from Monday is an inside day which means it trades inside the Ranger Friday the higher. The next objective to the upside is 6770.

ES UpdateIndicators neutral, ES and RTY are sitting right t the downtrend line. NQ and YM got rejected by the same line.
FDAX indicators also neutral, I'm mostly cash since I don't know which way the market will go Monday.
Fed WIlliams put a December rate cut back on the table, so I'm not as bearish as I was yesterday. I had to sell my XLF puts then flip GM calls to make money today, lol. Monday can go either way.
ES1 - Scary Face Done, Markets Warming Up
A fast bullish whipsaw recovery needed to arrive or very bearish scenarios could play out.
And now that bullish whipsaw may well be printing to pull the trend out of the fire.
On S&P Futures this may prove to be a slightly lower low liquidity shakeout and moving on up.
If it gets impulsive here then its even possible that the correction is over with no bearish cause carried over.
Stocks are warming up and crypto (TOTAL and BTC) are bouncing from tidy ratios - signalling a potential bottom.
Its been a scary area but this is likely to be the prime dip buy territory.
Assets warming up today may be starting new bull trends whereas assets sitting quietly may not.
This all remains relevant so long as there is not another stock index upside whipsaw.
If there is then its back to the bearish lens - but its looking good here and there are plenty of breakouts in ... stocks.
As said before, the 1.618 is a little way above and that is the next ratio based liquidity juncture.
If S&P can get moving then I think it gets there and we may see some significant bull trends 🧐.

ES - November 21st - Daily Trade PlanNovember 21st- Daily Trade Plan - 6:45am
*Before reading this trade plan, IF, you did not read yesterdays, or the Weekly Trade Plan take the time to read it first! (You can see both posts in the related publication section) *
If my posts provide quality information that has helped you with your trading journey. Feel free to boost it for others to find and learn, also!
My daily trade plan and real-time notes that I post are intended for myself to easily be able to go back and review my plan and how I did from an execution perspective.
--------------------------------------------------------------------------------------------------------
I mentioned the following a couple of times this week in my Daily Trade Plan -
"Remember, we have Thanksgiving next week and I would not be surprised if price tests the 6540 level by Friday and we rally end of the week as retail and sentiment becomes more bearish."
Yesterday's Daily Trade Plan I wrote the following:
"Price can reach 6775-85 area that will be a good resistance level. As I have said many times, when price rallies like it has before the NYSE Open, it could be a trap, and Institutions could start selling around the 6775-85 area. We will need to see what price does in the first hour."
In my note at 1:55pm yesterday I wrote -
"Price is trying to lose the daily low and if we do, we should be looking at 6570 (Reclaim of 6592) or 6540 (Reclaim of 6550) being the next key levels to grab some points. When price has such a massive red day the way it has been on the 1hr chart. It is better to wait for the weekly lows and be patient."
Yesterday it looked like price was going to just take off and we had found our low for the week, then Institutions pulled the rug at 6790 and when you have more than 2 - (15 min red candles) like we did yesterday, just wait and be patient for price to find a low, flush it and recover it. Price tried to recover 6592 late afternoon but couldn't. Since we had a massive red day, we should attempt to retest the levels above all the way up to 6726 at minimum when we get the squeeze higher.
Overnight high is 6594 and the low is 6525. We attempted this am a nice flush and recovery of 6540 (Yesterday's Low) but have found resistance at 6570. If price can take out the 6594 level and back test it to move higher, that would be a nice level to look for points to take us higher. Below that we need to flush 6540 and reclaim or 6525 and reclaim.
I have no idea what price will do today, but my general lean is that we flush 6540 or 6525 and reclaim these levels for a squeeze higher. If price is flushing lower, I will just wait for the reclaim of these levels to ride higher. The other level I will be watching is 6594 and looking for a back test of that level to enter for higher prices.
Key Levels Today -
1. 6540 flush and reclaim
2. 6525 flush and reclaim
3. 6594 take out this level and enter on a back test.
We might only get a sell off down to 6550 with price taking out 6572 would be a good micro level to enter for a test of 6594.
I will post an update around 10am EST
----------------------------------------------------------------------------------------------------------------
Couple of things about how I color code my levels.
1. Purple shows the weekly Low
2. Red shows the current overnight session High/Low (time of post)
3. Blue shows the previous day's session Low (also other previous day's lows)
4. Yellow Levels are levels that show support and resistance levels of interest.
5. White Levels are previous day's session High/Low
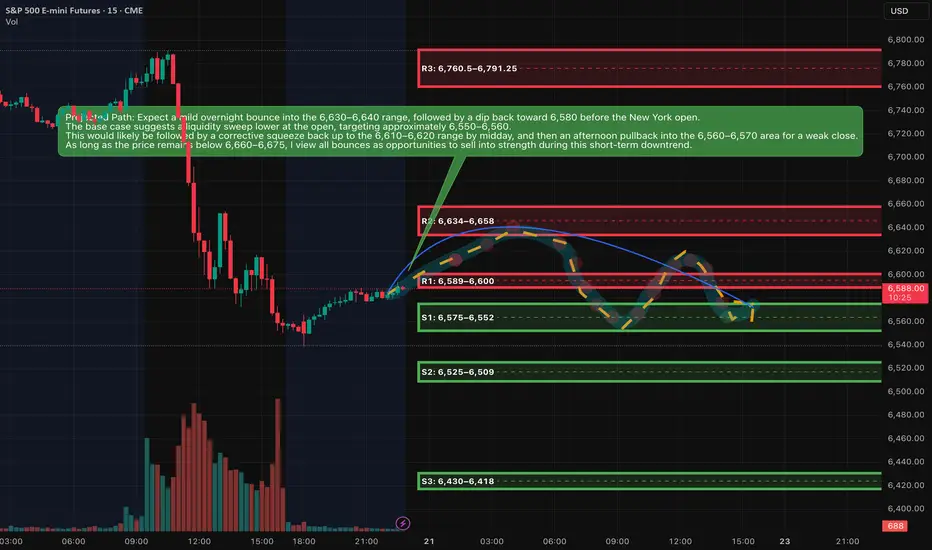
ES (SPX, SPY) Analysis, Levels, PA Forecast, Setups Fri (Nov 21)Analyzing Today’s Sharp Market Decline
The significant selloff observed today was not an arbitrary event. The day began with a robust rally following another impressive earnings report in the AI-chip sector, which propelled futures sharply upward and triggered a short squeeze in the Nasdaq. However, the release of a stronger-than-anticipated jobs report shifted the market's sentiment. While hiring showed signs of rebounding, the unemployment rate also ticked higher, undermining the prevailing narrative that the Federal Reserve would soon lower interest rates.
This development served as a stark reminder of the ongoing restrictive monetary policy, coupled with slowing economic growth and exorbitant valuations in the tech sector. Major investment funds capitalized on the morning’s strength in AI and large-cap stocks as an opportunity to reduce their risk exposure. Additionally, systematic trend-followers faced compulsion to sell once the S&P 500 fell below critical support levels.
The environment for high-beta assets, including cryptocurrencies, is already in a “reset” phase, which left little incentive for dip-buying at lower price points. As the E-mini S&P 500 futures broke through the previous day’s support levels, the situation escalated into a full liquidation. This perfect storm involved trapped long positions from the morning breakout, stop-loss orders falling into execution beneath yesterday’s lows, and mechanical selling, culminating in the largest intraday reversal since the spring.
Market Outlook
The current market sentiment is skewed bearish as the ES remains entrenched below the critical 6,660 to 6,700 range. The price is hovering near a significant demand zone established around the lows of the previous trading day and today’s New York session. While we can expect some upward bounces, these movements appear to be temporary rallies within an ongoing downtrend, rather than indicators of a potential new upward leg.
Market Analysis: Is This the Beginning of a Downtrend or a Temporary Shakeout?
In the recent developments within the E-mini S&P 500 (ES) on the daily timeframe, we’ve observed the formation of a distinct lower high following the recent all-time peak. This shift has seen prices breach the last identified higher-low area, establishing a new narrative. The sequence has transitioned from a higher high to a lower high, culminating in a movement into prior demand zones marked by increased volume, all while momentum appears to be rolling over.
On the four-hour chart, the prevailing trend reflects a series of lower highs and lower lows. The recent selloff has further entrenched this trajectory into the discount zone, now signaling proximity to the next Fibonacci retracement target below.
While momentum indicators have already dipped from overbought conditions, they have not yet reached deeply oversold thresholds, indicating potential for another leg downward following any short-term corrective bounce.
From a broader perspective, the long-term trend remains positive; however, a short- to medium-term corrective phase appears to be in play. Today’s market dynamics suggest we may be in the midst of this corrective leg rather than witnessing the final downturn.
As prices have recently entered a significant demand zone, a bounce lasting one to three sessions—or a period of sideways consolidation—seems likely before any potential further decline.
In summary, while current conditions favor a move towards lower prices in the days ahead, the market likely anticipates a "lower after a bounce" scenario rather than an immediate and steep decline.
Key resistance zones
Resistance is written as bands, not single ticks.
R1: 6,589–6,600
This band sits around the current Asia-session high and the underside of today’s New York low. It is the first lid above price. If rallies stall here, the tape stays heavy and favors another test of the lows.
R2: 6,634–6,658
This is the main breakdown zone from today, centered around the New York afternoon high and the upper edge of the late-session range. As long as ES trades below this shelf, the short-term downtrend remains intact and every bounce is suspect.
R3: 6,760.5–6,791.25
This band covers the New York morning low-to-high range and the origin of the big sell leg. If price ever retests this area and fails, it is a prime region for larger swing shorts. Only sustained trade and closes above this pocket would suggest the current corrective leg is ending.
---
Key support zones
S1: 6,575–6,552
This is the immediate floor combining the Asia-session low, New York afternoon low, and prior-day value low. It is where we are effectively trading now. Expect reactive bounces and stop-runs here, as both sides are active.
S2: 6,525–6,509
This is the next downside magnet if S1 breaks cleanly. It aligns with a fib extension and 4-hour demand. A decisive move into this region would represent the next step down in the correction.
S3: 6,430–6,418
Deeper extension and prior higher-timeframe demand. If the correction matures into a more serious pullback over several sessions, this pocket becomes a reasonable medium-term downside destination.
A++ Setup 1 – Short from R2 supply (continuation short)
Direction: Short
Entry zone: 6,638–6,648
SL (hard stop): 6,678
TP1: 6,588
TP2: 6,552
TP3: 6,515
Invalidation (structure):
If we get a 15m full-body close above 6,675, treat the short idea as invalid and stand aside; market is likely shifting into a squeeze toward 6,700+ instead of extending the down leg.
---
A++ Setup 2 – Quick-reclaim long from S1 demand (counter-trend bounce)
Direction: Long
Entry logic: need a flush then reclaim
Entry zone (after reclaim): 6,562–6,568
SL (hard stop): 6,538
TP1: 6,610
TP2: 6,638
TP3: 6,660
Invalidation (structure):
If price breaks below 6,552 and 15m closes stay below 6,545 without a fast reclaim, the bounce idea is invalid; then you wait for the deeper S2 zone instead of forcing longs here.
Good Luck !!!
Skittish marketThe structure in the daily chart of the S&P 500 implies a skittish market that is moving on concerns that fundamental reality. Therefore I am not looking for a big move down on Friday but rather a rest day and inside day as we go into the weekend.

The end - 2026 Financial panicSince 2300, I’ve marked a zone and made a personal commitment: no matter what happens in the market, when this zone is approached, I will begin reducing my exposure and carefully exit all financial markets—with extreme caution and tight stop losses.
Yesterday, I received an alert I never expected to see. It signaled the approach of the zone I identified back in 2021 as the escape point—where major crashes are likely imminent and the urge to invest must be resisted.
This zone aligns with the 0.786 trend-based Fibonacci level from the 2009 bottom to the 2020 peak, as well as the April 2020 bottom. It also coincides with the 2.618 and 3.618 Fibonacci extensions from the 2007–2010 cycle, and the 3.618 trend Fibonacci from the 2002–2009 cycle. But that’s not all.
According to Gann’s Square of 9, if you examine closely, you’ll notice that whenever the trend reaches one of its primary or secondary angles since the 2009 bottom, it consistently triggers a significant drop. The end cycle at the 360° angle corresponds to 7926—perfectly aligning with all the previously mentioned Fibonacci zones.
And for those skeptical of technical analysis, consider this: the upcoming year, 2026, is a pivotal year in the Samuel Benner chart developed in 1875 to identify periods of financial disorder. Benner’s chart indicated when to buy, when to sell, and when to expect chaos. Remarkably, it has accurately forecasted major financial crashes over the past 150 years—including the Great Depression, the Dot-Com bust, and the 2020 COVID crash. According to this chart, selling during the crash year and re-entering post-crash has historically led to profitable outcomes with a +-2 Years at a 87.5% accuracy.
When you combine all these signals, it feels reckless not to take them seriously—especially since this marks the end of a cycle measured from 2009. That’s how significant it is.
To those who dismiss technical analysis, this may sound like smoke and mirrors. But for those who’ve seen its power firsthand, the sheer number of confluences here is too substantial to ignore. If I know such big crash may happen - I would be happy to wait 1-2 years on cash and take opportunity of big red markets to buy.
Curious to hear your thoughts on this.

ES UpdateWow. Just Wow.
I left my overlay on there so you can see that it was correct other than the fact that the market did an entire week's worth of movement in just 24 hours, both up, whipsaw, and down.
I made some money shorting stuff today, but not as much as I should have because I didn't expect the full movement in one day. Closed out my puts way too early.
Holding next week's XLF puts because of a H&S pattern. No other positions, tomorrow will probably look a lot like last Friday because the market will be oversold. Be careful what you go long on, and I'm not sure about Monday direction.
Day 74 — Surviving a 242-Point Crash MoveEnded the day +$450.40 trading S&P Futures, but I’m walking away feeling tilted despite the profit. We sniped the 48-minute MOB resistance right out of the gate—just as planned in last night’s video—but I never expected the market to flush 242 points from top to bottom. That is a "market crash" level move. My P/L was a complete rollercoaster, swinging from +$400 to negative and back again. I’m grateful to end green, but after a session this volatile, I’m likely locking my account and taking a mental break tomorrow.
🔑 Key Levels for Tomorrow
Above 6725 = Bullish Below 6710 = Bearish
📰 News Highlights
BITCOIN FALLS 3% TO $87,000, LOWEST SINCE APRIL

Bullish Hidden Divergence Suggests Rally Toward ResistanceThe S&P 500 E-mini bounced off strong support near 6,567, forming a bullish hidden divergence on the MACD indicator. This signals potential upside momentum as price aims to retest the key resistance level at 6,953. Traders should watch for confirmation of this move to capitalize on a possible continuation of the uptrend.

ES - November 20th - Daily Trade PlanNovember 20th- Daily Trade Plan - 9:05am
*Before reading this trade plan, IF, you did not read yesterdays, or the Weekly Trade Plan take the time to read it first! (You can see both posts in the related publication section) *
If my posts provide quality information that has helped you with your trading journey. Feel free to boost it for others to find and learn, also!
My daily trade plan and real-time notes that I post are intended for myself to easily be able to go back and review my plan and how I did from an execution perspective.
--------------------------------------------------------------------------------------------------------
Quick Recap of Yesterday -
6635 has been the Bull/Bear Line this week and Institutions were accumulating below this level, and price broke out of the 6684-6595 range that has been building all week. This was a very structured Institutional accumulation event this week. You can see the 15 min chart had lower lows, lower highs until Tuesday when we put in the weekly low at 6595 and this was a lot of daily and weekly lows that were the confluence needed for Institutions to accumulate. We started to make higher highs, higher lows Wednesday and 6635 was that key level all week to take us higher. Since we have broken higher and above 6708, price should not lose 6684 on any back test this week.
--------------------------------------------------------------------------------------------------------
Overnight Low is 6694 and Overnight High is 6764 (As I am typing this). We built a nice flag between 6725 - 6757 range and then popped above that range and are looking for higher prices.
We are in a bit of a tough range at the moment, and we need a pullback for me to find a place to enter. The very microstructure is the back test of 6757 (Which we already had but is good reference) IF I had posted this earlier, we would have been looking for loss of 6725 and recovery to go higher. The other option IF missed is the clearance of 6757 (Overnight high) and back test, which we cleared to 6766 and then built a nice flag around 6752-55 and then continued higher. I write this so that you can review and see how price acts when you get a quick pop like we did and what it should do to continue higher. IF we had popped and then could not hold 6755 area, it would have sold off further.
Key Levels Today
1. 6757 - Flush and reclaim of the overnight high that broke out at 8:30am
2. 6725 - This would be a micro shelf that if we lose and recover could give us some points.
2. 6708 - Flush and reclaim
3. 6694 - Flush and reclaim
4. 6658 - Flush and reclaim
The highest quality is going to be 6614, 6624, 6635 flush and reclaims.
Price can reach 6775-85 area that will be a good resistance level. As I have said many times, when price rallies like it has before the NYSE Open, it could be a trap, and Institutions could start selling around the 6775-85 area. We will need to see what price does in the first hour. Unfortunately, I need a pullback to find an entry as I have missed them this am. Any flush and reclaim of 6757 should be a good spot, even if it flushes down to 6737 area and recovers.
I will post an update around 10am EST
----------------------------------------------------------------------------------------------------------------
Couple of things about how I color code my levels.
1. Purple shows the weekly Low
2. Red shows the current overnight session High/Low (time of post)
3. Blue shows the previous day's session Low (also other previous day's lows)
4. Yellow Levels are levels that show support and resistance levels of interest.
5. White Levels are previous day's session High/Low

ES – Testing Major Resistance? Nov. 20 Trade Plan1-Hour Outlook (Main Bias)
ES just broke out of a multi-day downtrend and is now pushing directly into the key 6745–6760 resistance shelf — the same zone that rejected twice earlier in the week.
1H Structure
* Clean breakout above the descending trendline.
* A confirmed BOS shifted the 1-hour structure bullish.
* Price is now consolidating right under the 6760 zone.
* Momentum is strong, but candles are slowing near resistance.
* MACD on 1H is bullish and rising.
* Stochastic is elevated and starting to flatten, but not rolling over yet.
1H Key Levels
Breakout trigger: above 6760–6770
Upside targets:
* 6801 (GEX resistance + prior supply)
* 6820 (2nd call wall / gamma magnet)
Support zone: 6680–6700
Bears take control only below: 6625
1H Trading Idea
Bullish scenario:
If ES holds 6700–6710 and reclaims 6745 with strength, a breakout through 6760 is very possible, opening a move toward 6800–6820.
Bearish scenario:
Only valid if ES rejects 6760 with a strong reversal candle. Downside magnets sit at:
6705 → 6680 → 6625
15-Minute Outlook (Execution Timeframe)
The 15M chart shows a strong impulsive rally followed by sideways absorption under resistance — not distribution yet.
15M Structure
* CHoCH → BOS → continuation move.
* Price retested the FVG zone and bounced cleanly.
* EMAs on 15M remain stacked bullish.
* Consolidation range is tight, signaling compression before expansion.
15M Trading Setups
Bullish entry:
6730–6740 ideal retrace zone.
Look for bullish engulfing or long-wick rejection.
Targets:
6760 → 6800
Stop: below 6715
Breakout entry:
If ES breaks 6760 cleanly with volume:
Stop: below last 15M swing low
Targets: 6801 → 6820
Bearish scalp:
Only if ES rejects 6760 multiple times.
First target: 6705
Second target: 6680
GEX Confirmation
Based on your GEX chart:
Bullish Signals
* Highest positive NETGEX sits near 6801, a natural gamma magnet.
* Significant call walls at 6760, 6800, 6820 — supporting upward drift.
* Positive GEX zones (GEX8/9) favor upside continuation.
* Minimal put defense above current price.
Bearish GEX Levels
* Strong PUT walls at 6680–6625, acting as downside magnets only if price breaks under support.
Interpretation
GEX favors a slow grind upward.
A clean break above 6760 likely accelerates hedging flows toward 6800–6820.
Options Trading Plan (GEX-Based)
Bullish Plan
If ES breaks above 6760 with momentum:
Contracts to consider:
* ES 6750C
* ES 6800C
Targets:
6801 → 6820
Reason:
Crossing 6760 forces dealers to hedge upward, creating a gamma push.
Bearish Plan
Only if ES rejects 6760:
Contracts:
* ES 6700P
* ES 6650P
Targets:
6705 → 6680 → 6625
Reason:
Below 6700, GEX turns neutral and the path opens toward put-heavy zones.
Final Bias for Nov. 20
ES has a bullish market structure and sits right under resistance.
A breakout through 6760 opens the door toward 6800–6820.
Bearish scenarios only gain momentum if price falls back below 6700 and especially under 6680.
Disclaimer
This analysis is for educational purposes only and not financial advice. Always do independent research and manage risk properly.

ES (SPX, SPY) Analysis, Key-Zones, Setups for Thu (Nov 20th)Market Bias Analysis
The current short-term bias is constructively bullish, yet it remains contingent on upcoming events. Recent momentum has been bolstered by Nvidia's exceptional earnings report and a significant intraday reversal in the E-mini S&P 500 (ES). As long as the 6,670–6,680 range holds during any pullbacks, the path of least resistance appears to be upward. It is important to note that the broader daily trend is still bullish, unless we see a decisive breach below the key demand zone of 6,520–6,510 in the ES.
Market Overview
In a notable shift following a four-day decline, today's trading session exhibited a renewed bullish sentiment. The E-Mini S&P 500 (ES) printed a robust green daily candle, bouncing off a low of approximately 6,622.00 yesterday to close near 6,740.
From a technical perspective, the daily chart reveals that the recent selloff has established a lower high without breaking the prior significant higher low. The reaction low remains comfortably above the daily 1.272 extension cluster situated around 6,521.25. On the 4-hour chart, the price action has transitioned from a pattern of lower lows to a new higher low, currently pushing into the Price Quotient Median (PQM) and Price Quotient High (PQH) band, just below previous 4-hour supply levels. Observing the 1-hour chart, today's trading reflected a definitive trend day upward, characterized by a consistent series of higher lows and higher highs, culminating the session near the 1-hour 1.272 Fibonacci extension at 6,743.75.
Macroeconomic factors played a crucial role in this market turnaround, particularly after Nvidia reported stunning Q3 earnings that exceeded expectations, generating approximately $57 billion in revenue. The company’s strong AI-driven outlook and positive after-hours performance alleviated concerns that the recent downturn in technology stocks signified the onset of a broader unwinding of the AI bubble. This development contributed to a rally in index futures as the session drew to a close.
Nonetheless, the overarching theme remains one of valuation pressures and interest rate concerns. Despite breaking a four-session losing streak, market participants are poised for tomorrow’s data, which will be pivotal in shaping the Federal Reserve's policy trajectory moving forward.
Scheduled Events (Tomorrow – Thursday, Nov. 20, 2025)
Tomorrow’s docket is heavy and directly relevant for ES:
• 8:30 a.m. ET – September Employment Situation (delayed jobs report)
The September nonfarm payrolls and unemployment rate, postponed by the government shutdown, are finally released. This is the only full jobs report the Fed will have before its December meeting, and markets are treating it as a major verdict on the labour market.
• Other U.S. data (during the morning/early afternoon)
Various calendars flag building permits / housing data, regional manufacturing (e.g., Philadelphia Fed), and existing home sales clustered through the U.S. session – all secondary to the jobs report but able to add fuel if they confirm or contradict the labour story.
• Fed speakers / meetings
• Chicago Fed President Austan Goolsbee has a scheduled fireside chat around midday (12:40 p.m. ET).
• The Fed also has a closed Board meeting at 1:15 p.m. ET and a two-day Cleveland Fed financial-stability conference that can generate headlines.
Net: the jobs report is the main event; Fed comments will colour the move rather than drive it on their own.
Setups (A++ Concepts)
These are two high-conviction, rule-style ideas you can plug into your own framework. Price levels are exact from your charts.
A++ Setup 1 – Continuation Long from Value Pocket
Entry trigger concept:
Look for a sweep into the chosen band (e.g., wick into 6,690–6,695 or down into 6,663–6,668) followed by a strong 15m/5m bullish close back above 6,700. That shows buyers defending value and rejecting a deeper rotation into S3.
Risk / invalidation:
Structural invalidation if ES closes the hour below 6,652.50 (Y-POC) and cannot reclaim 6,668. In practice, a tight stop can sit just under 6,652.00 if entering from 6,690–6,705, or under 6,645.00 if using the deeper S2 pocket.
Targets:
• TP1: 6,743.75 (1H 1.272)
• TP2: 6,777.00 (1H 1.618)
• TP3: 6,813.50 (1H 2.0)
---
A++ Setup 2 – Short Fade from 1H Extension Cluster
Entry zone:
Primary sell pocket: 6,777.00–6,813.50
(1H 1.618 to 2.0 extension cluster.)
Risk / invalidation:
Structural invalidation above 6,825–6,830 (clear 1H/4H acceptance beyond the 2.0 extension).
A practical stop can sit around 6,828.00 if entering inside the band.
Targets:
• TP1: 6,743.75 (1H 1.272 / prior extension)
• TP2: 6,683.50–6,690.00 (NYPM high / S1 top)
• TP3: 6,659.00–6,664.75 (VWAP/value pocket S2)
Narrative:
If Nvidia’s beat triggers a euphoric push straight into the upper fib level but the tape immediately rejects that strength, the market is saying “good news already in the price.” This setup expresses the view that the real gravity is lower, back toward value and potentially into S3 if macro data disappoint.

Momentum on the buy sideThere is by side momentum to the upside in the S&P 500 daily chart. Continuation is expected with the next objective to the upside of 6770.

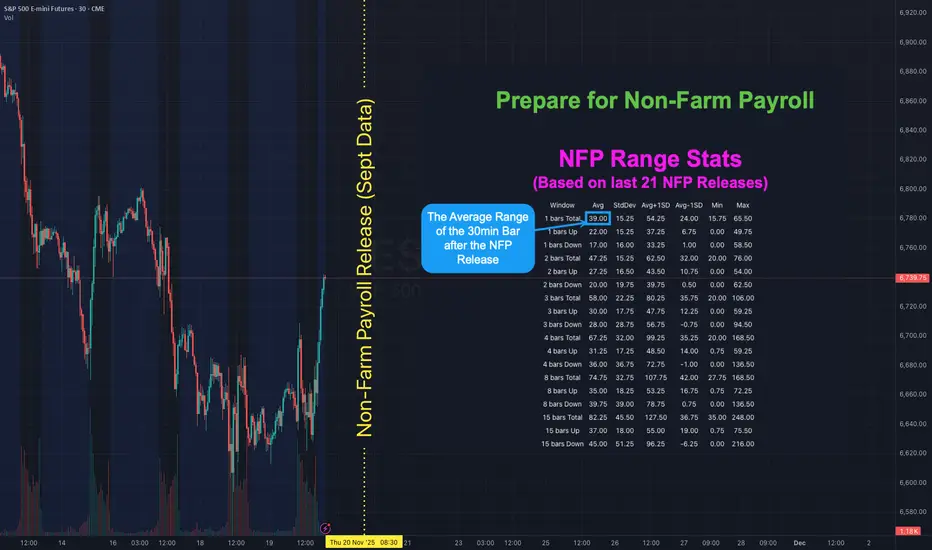
NFP is Back! Here's how to map out your playbook with statsHOW TO USE NFP RANGE STATS TO PREPARE YOUR PLAYBOOK
There has not been a Non-Farm Payroll release since Friday 5 September 2025 . Due to the government shutdown the September report that was originally set for Friday 3 October was postponed. It will finally be released on Thursday 20 November - a 48 day delay. With uncertainty around the labour data higher than usual it helps to know what “normal” looks like for ES S&P Futures. The table shows historical ranges after the 08:30 ET release on a 30-minute chart: 1 bar (30mins), 2 bars (60mins) 3 bars (90mins), 4 bars (2hrs), 8 bars (4hrs) and 15 bars (up to ~16:00 ET). The stats are based on the last 21 NFP releases (approx 2-years).
👉 If you think this would be useful as a script you can run yourself let me know (boost and drop a comment) and if there's enough interest I'll see if I can publish something.
WHAT THE COLUMNS MEAN
Avg - the typical move for that window based on past NFPs
StdDev - the variability around that average
Avg + 1 StdDev and Avg - 1 StdDev - quick upper and lower guardrails for a “normal” day
Min / Max - historical extremes in the sample
WAYS TO USE IT
1) Set guardrails for price discovery
Use Avg + 1 StdDev as a first “stretch” expectation for the window you trade. If price pushes beyond that level early you know we are outside normal and can adapt position size and expectations.
2) Pre-plan targets and emergency exits
Before 08:30 ET map a base scenario. Example for ES: if the 30m Avg post-release is X then a first take-profit can sit near X and a stretch target near Avg + 1 StdDev . Place an emergency stop beyond the Avg - 1 StdDev line if fading the first move.
3) Size positions to volatility
Translate the Avg 30m range into ticks or points and size so that a typical NFP bar does not exceed your defined risk. If your stats say the first 30m averages 9 points on ES do not run a size that cannot survive a 9-12 point swing.
4) Choose a playbook by window
1 bar (30m) - breakout or first-reaction mean-reversion
2-4 bars (60-120m) - continuation or reversal probabilities stabilise around the Avg envelope
8-15 bars - when the full session range is already at or beyond Avg + 1 StdDev be cautious chasing late moves
With the report 48 days late the probability of surprise is elevated. Go into the print with your ranges pre-mapped and your position sizing tied to those Avg and Avg ± StdDev bands. Clarity beats adrenaline.
👉 REMINDER:
If you think this would be useful as a script you can run yourself let me know (boost and drop a comment) and if there's enough interest I'll see if I can publish something.