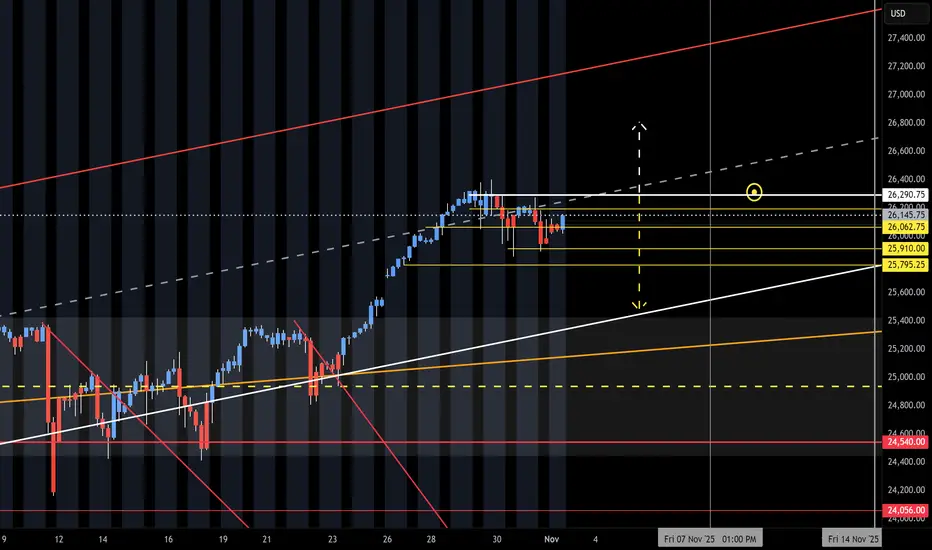
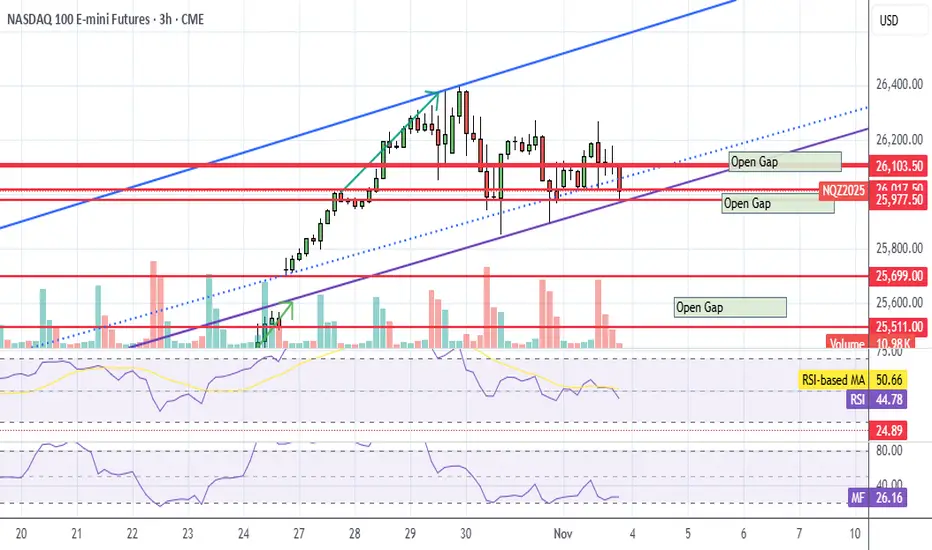
NQ Range (11-03-25, Week 6)The F-M Long move is on with new month and O/N Gap Open UP. Curveball form Friday Close and late head fake. Again, the NAZ will have to use the O/N to lift it back up. Need to see how the Open Drive and Reg Session reacts to the low volume O/N lift. Run up to upper target above KL 26,290 and Short on reject of. Under 290 is a potential drop to 25k or 25,550.
Trade ideas
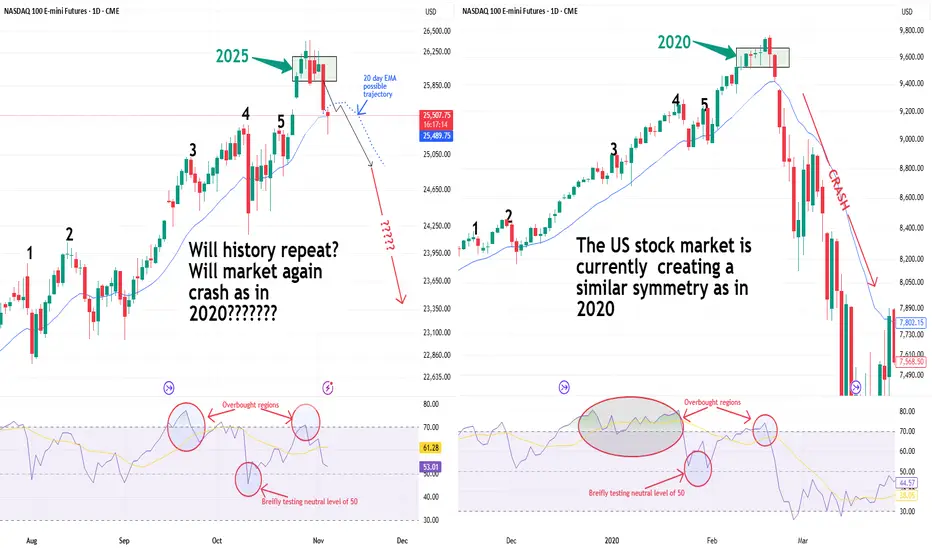
Will History Repeat Itself? NASDAQ 2025 vs 2020The NASDAQ 100 is currently showing a striking structural symmetry to the 2020 pre-crash formation.
Both phases formed a 5-wave impulsive rally, followed by tight consolidation near highs — a typical distribution top pattern.
The 20-day EMA is starting to flatten, signaling a possible loss of momentum.
If symmetry continues, the index could mirror a short- to mid-term correction, similar to early 2020’s breakdown.
While macro conditions differ today, market behavior often repeats in fractal patterns — a reminder that price structure often precedes headlines.
📊 Keep watch for a confirmed EMA rollover and breakdown below support near 25,500 — that could validate the bearish symmetry.

HOW TO TRADE THE LONG TERM TREND BY DRAWING TRENDLINES!Hey Traders so today wanted to make a quick video that explains how to trade the long term trend early. Also when to move your trendline to stay with the market for as long as possible in long term trends.
Hope This Helps Your Trading 😃
Clifford

The Empty Feeling After A WinA trader messaged me recently after closing a big win.
He said, “I should’ve felt great but I just felt… flat.”
That sudden emptiness after the high it’s more common than you think.
Follow along. I hope this helps.
BUT FIRST
NOTE – This is a post on mindset and emotion. It’s not a trade idea or system designed to make you money.
My intention is to help you preserve your capital, focus, and composure — so you can trade your own system with calm and confidence.
HERE’S WHAT HAPPENS
You execute beautifully.
Plan followed. Risk managed.
Trade hits target. Account up.
You should feel satisfied.
But instead… there’s a drop.
The charts look dull.
The mind goes searching.
“Maybe one more setup.”
“Just check the next pair.”
That’s not greed.
That’s chemistry.
When you’re in a trade, your brain is flooded with dopamine the chemical of pursuit, anticipation and drive.
When you exit, that hit disappears almost instantly.
To the nervous system, that chemical drop feels like loss .
And loss, even after a win, triggers the instinct to get it back.
WHAT’S REALLY GOING ON UNDERNEATH
You’re not chasing profit.
You’re chasing stimulation, the feeling of being alive in the action.
The mind interprets that feeling as boredom or missed opportunity.
But really, it’s your biology craving more.
The subconscious has learned to equate stillness with emptiness.
So it pushes for movement to escape the come-down.
That’s why so many traders give back profits after doing everything right.
They’re not making bad decisions.
They’re trying to fix a feeling.
HOW TO CATCH IT BEFORE IT CATCHES YOU
1️⃣ Notice your come-down cue.
After closing a trade, does your body feel restless?
Do you scroll, check charts, or reopen the platform out of habit?
That’s the withdrawal in motion.
2️⃣ Name it, don’t fight it.
Say it internally: “This is dopamine dropping.”
It takes the mystery out of the urge.
3️⃣ Breathe through the drop.
A long exhale through the mouth… six seconds out tells the body it’s safe.
Let your eyes rest on something still.
4️⃣ Reframe the pause.
That quiet space after a win isn’t emptiness.
It’s integration.
It’s the moment your nervous system resets for the next run.
Trading mastery isn’t just execution.
It’s emotional regulation before, during and after execution.
I put a lot of time and thought into every post that goes out here so I appreciate your support.
Thank you

Nasdaq reversa 6-11-25Sellers were absorbed in that area, and the Nasdaq will likely reverse from this point in the coming days.
If it breaks through the supply zone, the trend could turn bullish in the next few days.

IYMP Market Pulse Monday Nov 3rd - NQ TGIF bias stays active till Tuesday morning, so expect some sharp moves! 🔥
Scanners are lighting up — 195-minute intervals on NQ and ES showing solid momentum buildup.
Upside focus — 26,283, last Friday’s high, and 26,580 if momentum keeps pushing.
If we pull back — 25,770 is your first key support, 25,520 for that possible gap-fill zone, lastly third leveled at 25,353 where ET completes to the downside
Stay patient, stay structured —
trade the setup, not the noise. 🌱”

NQ UpdateI told everyone to stay bearish until the NQ gap fills. We're almost there, just a small gap left.
The big question is, does the TACO gap need to fill? 2 previous TACO gaps were left unfilled in the spring so I'm not sure. There is also a small gap above from yesterday afternoon.
If NQ breaks below the lower channel line then we know it's headed for TACO. (Today is Taco Tuesday at my local bar as well, lol)

NASDAQ LongsLook for longs in Nasdaq once price either takes Sell side marked during 9:30 open and target Midnight open.
Price can also leave to the upside directly from here.

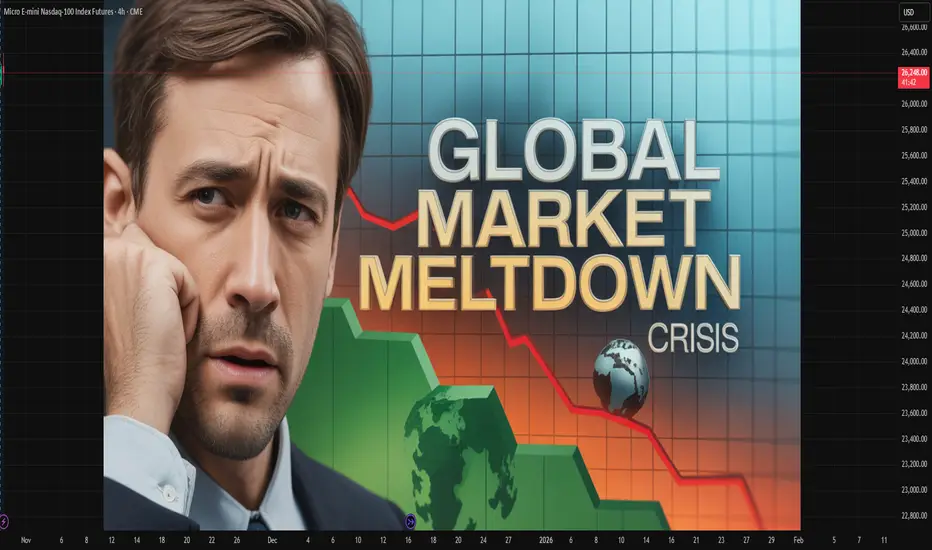
Lessons Learned from Past Meltdowns (2008, 2020, etc.)1. The 2008 Financial Crisis: A Wake-Up Call for Systemic Risk
The 2008 Global Financial Crisis (GFC) was triggered by the collapse of the U.S. housing bubble, excessive leverage in financial institutions, and the widespread use of complex derivatives such as mortgage-backed securities (MBS) and collateralized debt obligations (CDOs). When Lehman Brothers filed for bankruptcy in September 2008, panic spread globally. The crisis led to trillions in lost wealth, millions of job losses, and the deepest recession since the Great Depression.
Key Lessons from 2008:
a. Importance of Transparency and Regulation:
The 2008 crisis revealed how opaque financial products and inadequate oversight can destabilize the entire financial ecosystem. Banks took excessive risks without sufficient capital buffers, while rating agencies failed to assess true risk levels. Post-crisis reforms, such as Basel III norms, Dodd-Frank Act, and stress testing frameworks, were introduced to improve capital adequacy, liquidity, and accountability.
b. Systemic Risk Can Spread Rapidly:
The interconnection of global banks turned what began as a housing market issue into a worldwide meltdown. The concept of “too big to fail” became central to financial discourse. The lesson: monitoring systemic risk is as important as regulating individual institutions. Financial contagion can cross borders instantly, necessitating global cooperation among central banks and regulators.
c. Moral Hazard and Bailouts:
Massive government bailouts (e.g., TARP in the U.S.) saved the system but raised questions about moral hazard—whether saving reckless institutions encourages future risk-taking. The lesson was clear: regulation should prevent risk-taking before it requires taxpayer-funded rescues.
d. The Role of Monetary Policy:
Central banks realized their power and limitations. The U.S. Federal Reserve’s near-zero interest rate policy and quantitative easing (QE) became critical tools to stabilize markets. However, these also laid the groundwork for future inflationary pressures and asset bubbles. Lesson: monetary easing is effective but must be balanced with fiscal prudence and structural reforms.
e. Behavioral Economics Matters:
Investor psychology—greed during booms and fear during crashes—played a decisive role. Overconfidence, herd behavior, and the illusion of endless housing price appreciation fueled the bubble. Behavioral finance emerged as a crucial field for understanding and mitigating irrational market behavior.
2. The 2020 Pandemic Crash: A Crisis Like No Other
Unlike 2008, which was a financial crisis rooted in excess and mismanagement, the 2020 crash was a health crisis turned economic catastrophe. When COVID-19 spread globally in early 2020, lockdowns halted production, trade, and travel, triggering a sudden and sharp global recession. Stock markets collapsed, oil prices turned negative, and unemployment soared. Yet, recovery was surprisingly swift—thanks to unprecedented fiscal and monetary interventions.
Key Lessons from 2020:
a. Speed and Scale of Policy Response Matter:
Governments and central banks acted far faster in 2020 than in 2008. The U.S. Federal Reserve slashed rates to zero within weeks and launched unlimited QE, while fiscal packages like the CARES Act pumped trillions into the economy. Similarly, India announced the Atmanirbhar Bharat stimulus. The lesson: speed and magnitude of support can prevent temporary shocks from becoming long-term depressions.
b. Technology as an Economic Lifeline:
The digital economy emerged as a savior. Remote work, e-commerce, fintech, and cloud computing allowed many sectors to survive and even thrive. The pandemic accelerated the digital transformation of business and finance, leading to greater adoption of digital payments, virtual collaboration, and online education. Lesson: digital infrastructure is not optional—it is a core pillar of economic resilience.
c. The Fragility of Global Supply Chains:
The shutdown of manufacturing hubs in China and other countries exposed how deeply global supply chains were interconnected and vulnerable. The shortage of semiconductors, medical supplies, and essential goods highlighted the risk of over-dependence on a few suppliers. Lesson: economies must build supply chain diversification and strategic self-reliance.
d. Inequality and Social Resilience:
The pandemic widened existing inequalities. While asset prices recovered quickly, millions of small businesses and low-income workers faced lasting damage. Lesson: inclusive recovery must be prioritized; safety nets and targeted fiscal support are crucial for societal stability.
e. Investor Behavior and Market Resilience:
The 2020 crash also showcased how investor psychology had evolved. Retail investors, aided by trading apps and social media, became a dominant force. Markets rebounded sharply, partly due to liquidity and optimism about vaccines and technology. Lesson: information flow, sentiment, and social media can now move markets faster than ever.
3. Common Threads Between 2008 and 2020
Though different in origin, both crises shared key characteristics that reveal the vulnerabilities of modern capitalism.
a. Interconnected Global Systems:
Both crises demonstrated how local shocks quickly became global due to financial, trade, and psychological linkages. Whether it was mortgage-backed securities in 2008 or supply chain disruptions in 2020, the globalized economy magnifies contagion. The lesson: resilience depends on diversification—not isolation.
b. Central Bank Dominance:
In both crises, central banks played an unprecedented role. The Federal Reserve, European Central Bank, and others became the “market backstop.” Their actions stabilized confidence but also increased dependence on monetary intervention. This dependence raises long-term concerns about asset bubbles and debt sustainability.
c. The Importance of Communication and Trust:
Both meltdowns showed that trust is the ultimate currency in a crisis. When financial institutions, governments, or investors lose confidence, panic sets in faster than any policy can react. Transparent communication by policymakers can anchor expectations and prevent spirals of fear.
d. Innovation Follows Crisis:
Both periods triggered innovation. After 2008, fintech and blockchain rose from the ashes of mistrust in traditional banks. After 2020, remote work tech, digital health, and AI-driven analytics became mainstream. History proves: crises often accelerate technological and structural evolution.
4. Lessons for Policymakers
a. Build Buffer Capital and Fiscal Space:
Governments and banks must maintain sufficient reserves for emergencies. High fiscal deficits and excessive leverage before a crisis reduce the ability to respond later. Prudent fiscal management and healthy capital ratios are essential for resilience.
b. Develop Counter-Cyclical Tools:
Automatic stabilizers—such as unemployment benefits and targeted stimulus—can cushion economic shocks. Regulators must enforce counter-cyclical lending and investment practices to prevent overheating during booms.
c. Strengthen Global Coordination:
Global problems require global responses. The 2008 and 2020 crises both highlighted how coordination among G20 nations, IMF, and World Bank was vital. Shared frameworks for debt relief, liquidity swaps, and vaccine distribution illustrate the power of cooperation.
d. Invest in Data and Predictive Systems:
Early warning systems using AI and real-time data could help detect vulnerabilities before they escalate. Governments and financial regulators must embrace data-driven policy frameworks for crisis prevention.
5. Lessons for Financial Institutions
a. Risk Management Must Be Dynamic:
Traditional models failed to predict both crises. Stress testing must account for low-probability, high-impact events like pandemics or geopolitical disruptions. Banks must integrate climate risk, cyber risk, and behavioral risk into their frameworks.
b. Liquidity Is King:
Both meltdowns reinforced that liquidity dries up first in a panic. Institutions must maintain adequate short-term funding buffers. Central banks’ liquidity facilities are a lifeline, but dependence should be reduced through prudent planning.
c. ESG and Sustainable Finance:
The 2020 crisis emphasized environmental and social resilience. Firms with strong ESG principles fared better, reflecting investor preference for sustainability. Lesson: ethics and responsibility are now financial imperatives, not optional ideals.
6. Lessons for Investors
a. Stay Rational Amid Panic:
The biggest losses occur when investors react emotionally. Those who stayed invested or bought during the 2020 crash witnessed record recoveries. Lesson: time in the market often beats timing the market.
b. Diversification Works:
Diversified portfolios—across asset classes, sectors, and geographies—performed better in both crises. Lesson: never rely solely on one market or theme.
c. Long-Term Vision Pays Off:
Both crises produced winners—innovative companies that adapted early. Investors who focused on fundamentals and long-term growth stories reaped massive returns. Lesson: focus on quality, adaptability, and innovation.
7. Structural Shifts Triggered by Crises
a. Rise of Alternative Finance:
Post-2008, distrust in banks led to the growth of fintech, crypto assets, and decentralized finance (DeFi). These innovations democratized finance but also created new regulatory challenges.
b. Work and Consumption Redefined:
After 2020, remote work, digital payments, and online services became embedded in everyday life. Businesses now prioritize resilience over efficiency—shifting from “just-in-time” to “just-in-case” models.
c. Inflation and Monetary Reckoning:
Massive stimulus in 2020 eventually fueled inflationary pressures by 2022–23. This underscored that liquidity without productivity creates long-term imbalances. Lesson: monetary expansion must be matched with real economic output.
8. Preparing for the Next Crisis
While we can’t predict the next meltdown, we can prepare for it. Future shocks might stem from climate change, AI-driven job disruptions, or cyber warfare. The lessons from 2008 and 2020 teach us that flexibility, coordination, and foresight are the best defenses.
Anticipate the Unthinkable: Stress testing and scenario modeling must include black swan events.
Prioritize Human Capital: Education, healthcare, and social safety nets ensure societies rebound faster.
Embrace Sustainable Growth: Over-leverage and short-term gains always backfire.
Enhance Financial Literacy: Empowering individuals to understand risk and debt reduces systemic vulnerability.
Conclusion
The crises of 2008 and 2020 were vastly different in origin—one financial, the other biological—but they shared a common truth: economic systems are only as strong as the trust, transparency, and adaptability they embody. The lessons learned from these meltdowns go beyond economics—they speak to governance, ethics, and collective responsibility.
In both cases, the world witnessed immense pain but also extraordinary recovery and innovation. As we move deeper into an era of digital finance, geopolitical shifts, and environmental challenges, these lessons form the blueprint for building a resilient, equitable, and sustainable global economy—one that learns from its scars and grows stronger after every crisis.
NASDAQ 100 (NQ1!): Bullish! Buy This Dip!Welcome back to the Weekly Forex Forecast for the week of Nov. 3 - 7th.
In this video, we will analyze the following FX market: NASDAQ (NQ1!) NAS100
The NASDAQ reached all time highs last week, then started a pullback, landing in a +FVG.
As the +FVG continues to hold, look for valid buy setups to form.
Sells are not valid, my friends. Go with the trend!
Enjoy!
May profits be upon you.
Leave any questions or comments in the comment section.
I appreciate any feedback from my viewers!
Like and/or subscribe if you want more accurate analysis.
Thank you so much!
Disclaimer:
I do not provide personal investment advice and I am not a qualified licensed investment advisor.
All information found here, including any ideas, opinions, views, predictions, forecasts, commentaries, suggestions, expressed or implied herein, are for informational, entertainment or educational purposes only and should not be construed as personal investment advice. While the information provided is believed to be accurate, it may include errors or inaccuracies.
I will not and cannot be held liable for any actions you take as a result of anything you read here.
Conduct your own due diligence, or consult a licensed financial advisor or broker before making any and all investment decisions. Any investments, trades, speculations, or decisions made on the basis of any information found on this channel, expressed or implied herein, are committed at your own risk, financial or otherwise.

Will US Stock Market Crash Repeating 2020's TrajectoryThe NASDAQ 100 is creating a similar price action symmetry and RSI behavior to the pattern seen just before the 2020 crash.
* In 2020, this setup led to a sharp correction.
* In 2025, the symmetry looks almost identical.
Is it déjà vu — or just another pause before the next leg up?
Ascending triangle gaps end of earnings (just about) correction?All the earnings releases and positive impact of business investment in AI gave the market anther move higher, but what now everything is so stretched gaps appearing and a negative pattern suggest a correction, the question how far ?

NQ1 - Bullish OpenIndexes looking fine to start the week.
Nasdaq has had plenty of chop post interest rate cut, but its been quite tame to print a descending expanding pattern - likely to be bullish but perhaps with some more chop in the pipeline.
Let's see how regular trading hour indexes open 🧐.
This analysis is shared for educational purposes only and does not constitute financial advice. Please conduct your own research before making any trading decisions.

Updated charts for the week! PLEASE follow me and support!remember eat between the lines!!! Also follow me if you want more chart updates... I will only start posting if you guys show me the love and follow up. I help you see the market and you follow up!
Nasdaq Selloff Extends in Asia — But How Bad Is It, Really?Asian markets saw a second wave of selling today, with Nasdaq futures falling around 1% during Asian trade. After fielding several emails from journalists asking “why,” I can’t help but think this move may be more about technical repositioning after an extended run higher.
In this video, I walk through the monthly, weekly, and daily Nasdaq charts to share where I think we could go from here.
Matt Simpson, Market Analyst at City Index.

NQ UpdateNQ left an open gap after the break, so now we have one above and two below. Quite frankly, there's too much whipsaw to be trading options so I'm taking a break.
I may or may not be posting updates.
NASDAQ (NQ1!) – Bearish Divergence Potential PullbackOn the 1-hour chart, a clear bearish divergence has formed at recent highs, aligning with loss of bullish momentum and price rejection near the upper trend channel. The short-term structure suggests sellers may gain control, with potential retracement zones around the 0.5–0.618 FIB levels and an unfilled GAP below.
If price confirms continuation after a minor relief bounce, we could see a corrective wave unfold before the broader uptrend resumes.
Bias: Short-term Bearish – looking for retracement opportunities toward key support levels before potential trend continuation.

NQ Short (10-27-25, Week 5)NAZ with O/N Gap open to lock in the Long chase and clean out the short stops. Regarding Friday short, I always go flat into the close. The O/N continues be used to lift it with ease. This may be blow off top day into balance of Friday - Monday Long Play. Netflix had the -10% move and has not recovered, NAZ is using the off session to Rig it up. Drop may not be until Tuesday, yellow arrow is range for retest should upper stall out. Current gap fill likely either way. Pump/Dump into Open, Gap up in O/N and expect some Tweets. When this stalls, look short. AP on Friday, voided by Gap.
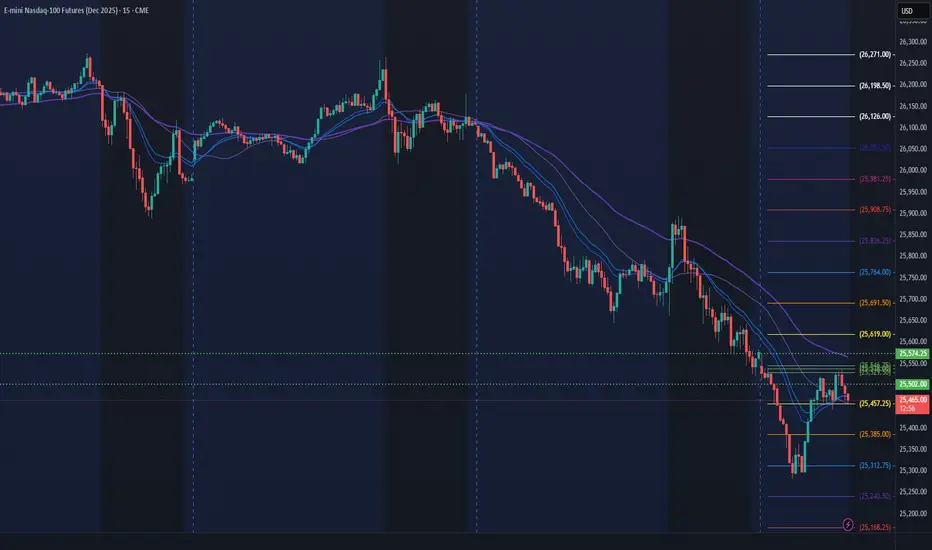
NQ Power Range Report with FIB Ext - 11/4/2025 SessionCME_MINI:NQZ2025
- PR High: 25574.25
- PR Low: 25501.75
- NZ Spread: 161.75
Key scheduled economic events:
09:15 | ADP Nonfarm Employment Change
10:00 | ISM Non-Manufacturing PMI
- ISM Non-Manufacturing Prices
10:45 | S&P Global Services PMI
Session Open Stats (As of 12:45 AM)
- Session Open ATR: 401.88
- Volume: 92K
- Open Int: 290K
- Trend Grade: Long
- From BA ATH: -3.5% (Rounded)
Key Levels (Rounded - Think of these as ranges)
- Long: 26636
- Mid: 25410
- Short: 24039
Keep in mind this is not speculation or a prediction. Only a report of the Power Range with Fib extensions for target hunting. Do your DD! You determine your risk tolerance. You are fully capable of making your own decisions.
BA: Back Adjusted
BuZ/BeZ: Bull Zone / Bear Zone
NZ: Neutral Zone
NQ GOES TECH PARTY LIKE IT'S 1999, AHEAD OF ITS FINAL CRASHI was dreamin' when I wrote this
So sue me if I go too fast
But life is just a party
And parties weren't meant to last
...
I got a lion in my pocket
And, baby, he's ready to roar, yeah, yeah
Everybody's got a bomb
We could all die any day, oh
But before I'll let that happen
I'll dance my life away
Oh
Yeah
--
Best wishes,
@PandorraResearch Team

2 losses, could've gone full out. Could've made profit on the day but I saw a different narrative, we go again tomorrow.

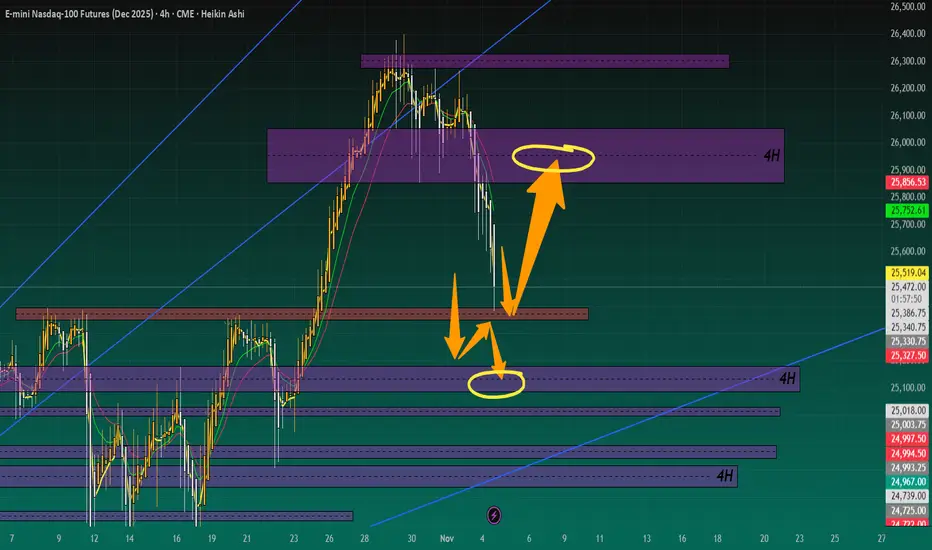
NQ - LONG SETUPAfter a rally, I waited the price comes back to the gap. After the rejection, I executed the trade and used the same gap to protect my stop loss. It was a 50% retracement.

