NQ Targets (11-24-25)The downtrend is on and will play inside the Diablo's (red diagonal lines) until breakout. 24,600 to 24,056 is Churn Zone and 24,708 and 24,226 are KL's to watch for opposite direction trades 1st and follow through 2nd. NAZ did come close to -10% level in the overnight, popped back up on a Friday (typical). The original Short call was aiming at all the O/N gaps up from prior Rig lift (from O/N), these have been cleaned out. The NDX chart will show these that started on 10/24 through 10/29. Note, from here the math gets interesting and can be illustrated on the NDX chart. We may see heavier selling in the O/N as 11/20 was an outside day reversal close. Notice on the NDX chart that the recent 58% lift can erased will only a 37% drop and the YTD 24% high is erased will only a 19% drop. Heavy volume lower after light volume (off session) lift. Keep in mind that the O/N has a new limit down of -7% (old was -5%). Keep in mind the drawdown math effect = pain. Unless we see a retest that can get above NDX Danger Zone and get back above the Upper TZ or long term trendline (orange, 25,095). NDX 25,095 - 23,233 is Churn Zone until breakout. NQ - NDX differential is about 200 points.
NDX Chart
Trade ideas

NQ Year End Range (11-17-25)Recent price action is looking like what we saw late 2024 into 2025, prior to 26% drop (Feb,25). You can view the Post here:
The lift back up from the 26% drop has been a 60% run up on low volume, including the 10 minute 12% pop from Wash ST. "time to buy" Tweet. NAZ under long term TL (Orange trendline), needs to get above. Yellow line is drop trade and white is drop/pop trade. 294,910 - 25,910 is the Churn Range and look for a breakout. Below 24,910 is drop testing and looking for bounce back up, any lift near 25,910 (during the Overnight) should drop back inside Churn Zone.

If Nasdaq can crack the pressure line then...🔱 We have a Hagopian on the down-move. 🔱
Price was (so far) not able to reach the L-MLH of the red fork.
If buyers can eat through the pressure cheese, then the Long-Play is on.
Most often we see price breaking the pressure line and then coming back to it, scaring out the early longs, just to rush upwards again. So don’t panic if this happens. Place a proper stop and you're good.
As for targets, there is the red Centerline and the white Centerline.
On a break of the red CL, we have a high chance to see the same scenario as with the pressure line: UP-Down-MoreUp.
First snow in Switzerland arrived and Santa is preparing the reindeer to bring us some dough ;-)
Wish you all a profitable Friday.

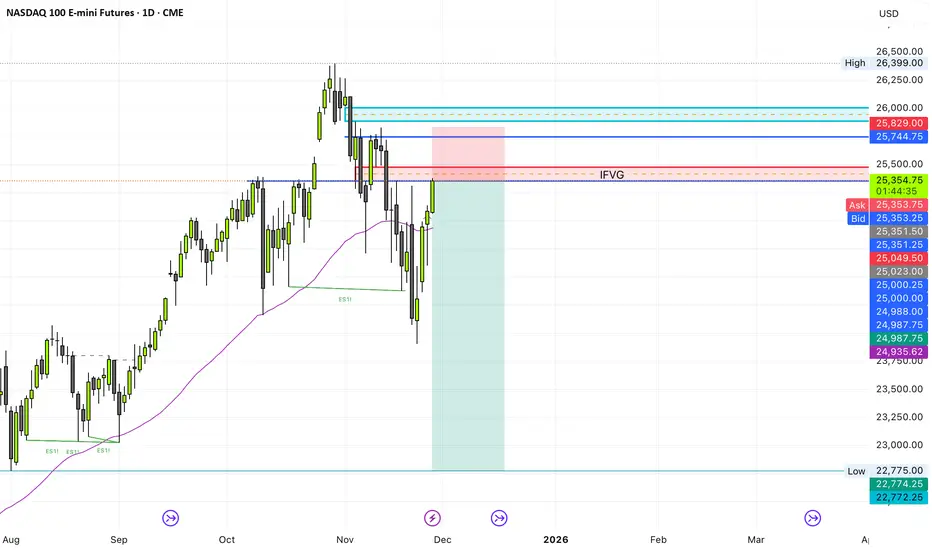
Potential short setup on NQ
I am still learning but looking to me like a potential short setup from that daily inverted fair value gap targeting the next sell side liquidity zone.
Please let me know in the comments if my bias is wrong and why.
NASDAQ 100 (NQ1!): Wait For Price To Reach -FVG!Welcome back to the Weekly Forex Forecast for the week of Nov. 17-21st.
In this video, we will analyze the following FX market: NASDAQ (NQ1!) NAS100
The NASDAQ gave some bearish-neutral price action last week. It ended in a doji candle, not giving us much in the way of directioin. But, there is a bearish FVG on the Daily TF formed. The reaction to it will provide all the insight we need regarding the directional bias of this market for this coming week.
If the -FVG holds, sell it. If it is disrespected, buy it.
Simple.
Enjoy!
May profits be upon you.
Leave any questions or comments in the comment section.
I appreciate any feedback from my viewers!
Like and/or subscribe if you want more accurate analysis.
Thank you so much!
Disclaimer:
I do not provide personal investment advice and I am not a qualified licensed investment advisor.
All information found here, including any ideas, opinions, views, predictions, forecasts, commentaries, suggestions, expressed or implied herein, are for informational, entertainment or educational purposes only and should not be construed as personal investment advice. While the information provided is believed to be accurate, it may include errors or inaccuracies.
I will not and cannot be held liable for any actions you take as a result of anything you read here.
Conduct your own due diligence, or consult a licensed financial advisor or broker before making any and all investment decisions. Any investments, trades, speculations, or decisions made on the basis of any information found on this channel, expressed or implied herein, are committed at your own risk, financial or otherwise.

NA$. BearishA brief retracement toward the uptrend line is expected; the outlook remains bearish unless there's a strong breakthrough.

NasdaQ BiasDAILY CHART
1. Expecting lower prices if we stay below that balanced price range just above the 50% level.
2. If the balanced price range fails to hold price the market might look to explore that in the last premium quadrant and possibly all time highs.

NQ 25,155: Heavy-Volume Resistance + FVG Short SetupNQ is forming a strong resistance at 25,155, sitting at the start of a heavy-volume zone created during a sharp selloff. This is where sellers previously built short positions and are likely to defend again. A bearish Fair Value Gap aligns perfectly with the same level, strengthening the zone. A pullback into 25,155 offers a clean short opportunity.

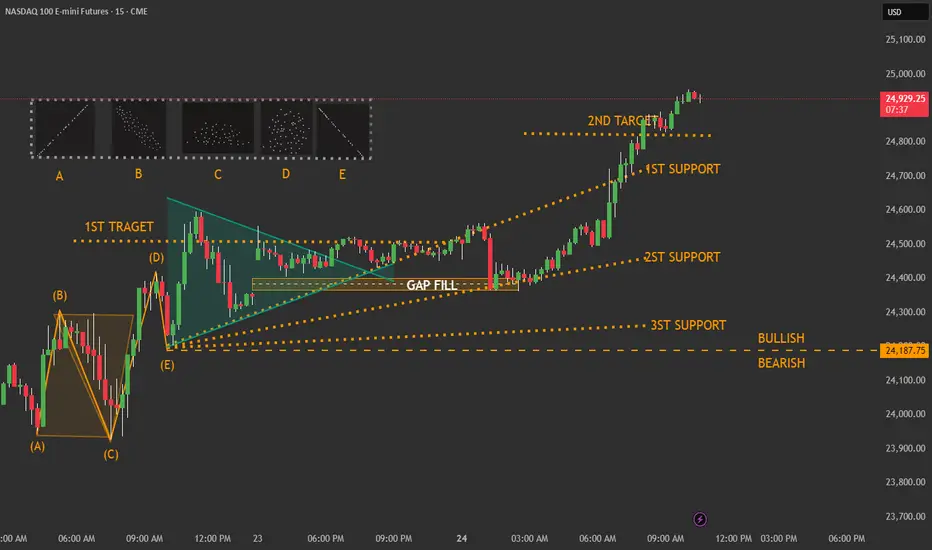
nq 15 min update Overall Idea
(Not financial advice)
The chart shows a price pattern forming after a strong move upward and downward, followed by a consolidation phase. The diagram highlights targets, supports, and a gap fill area, helping determine bullish vs. bearish scenarios.
Wave Structure (A → E)
(Not financial advice)
On the left side, there's a labeled price swing (A–B–C–D–E).
This represents a sequence of higher-lows and lower-highs, ending at point (E).
Point (E) acts as the base from which the next structure begins.
Triangle Wedge Pattern
(Not financial advice)
Right after point (E), the market forms a tightening triangular structure
Upper descending line seller pressure
Lower ascending line buyer pressure
This pattern shows compression before a larger movement.
Gap Fill Area
(Not financial advice)
The GAP FILL zone inside the triangle marks an area where price previously skipped quickly.
Price often returns to such zones, creating
temporary support
or a magnet before continuation
Price Targets
(Not financial advice)
1ST TARGET
Primary upside objective if price breaks above the triangle.
2ND TARGET
A farther target indicating strong bullish expansion.
Support Levels
(Not financial advice)
1ST SUPPORT
Closest support maintains bullish structure.
2ND SUPPORT
A deeper structural support.
3ST SUPPORT
Strongest support and major turning point.
Bullish vs. Bearish Line
(Not financial advice)
The dashed horizontal line at the bottom marks the key boundary
Above → bullish
Below → bearish
NQ 15 MIN Overall Idea
(Not financial advice)
The chart shows a price pattern forming after a strong move upward and downward, followed by a consolidation phase. The diagram highlights targets, supports, and a gap fill area, helping determine bullish vs. bearish scenarios.
Wave Structure (A → E)
(Not financial advice)
On the left side, there's a labeled price swing (A–B–C–D–E).
This represents a sequence of higher-lows and lower-highs, ending at point (E).
Point (E) acts as the base from which the next structure begins.
Triangle Wedge Pattern
(Not financial advice)
Right after point (E), the market forms a tightening triangular structure
Upper descending line seller pressure
Lower ascending line buyer pressure
This pattern shows compression before a larger movement.
Gap Fill Area
(Not financial advice)
The GAP FILL zone inside the triangle marks an area where price previously skipped quickly.
Price often returns to such zones, creating
temporary support
or a magnet before continuation
Price Targets
(Not financial advice)
1ST TARGET
Primary upside objective if price breaks above the triangle.
2ND TARGET
A farther target indicating strong bullish expansion.
Support Levels
(Not financial advice)
1ST SUPPORT
Closest support maintains bullish structure.
2ND SUPPORT
A deeper structural support.
3ST SUPPORT
Strongest support and major turning point.
Bullish vs. Bearish Line
(Not financial advice)
The dashed horizontal line at the bottom marks the key boundary
Above → bullish
Below → bearish

Next week NQ BearishNext week’s price outlook appears bearish.
Market structure shows a clear downtrend following the confirmed break of the previous swing low.
Price is expected to retrace into the iFVG before continuing lower toward the downside order block.
The iFVG aligns precisely with the lowest tick of the highest candle of the prior move and sits in the correct position relative to the previous supply zone.
The order block below is a high-probability area, as five liquidity lows are positioned directly above it.

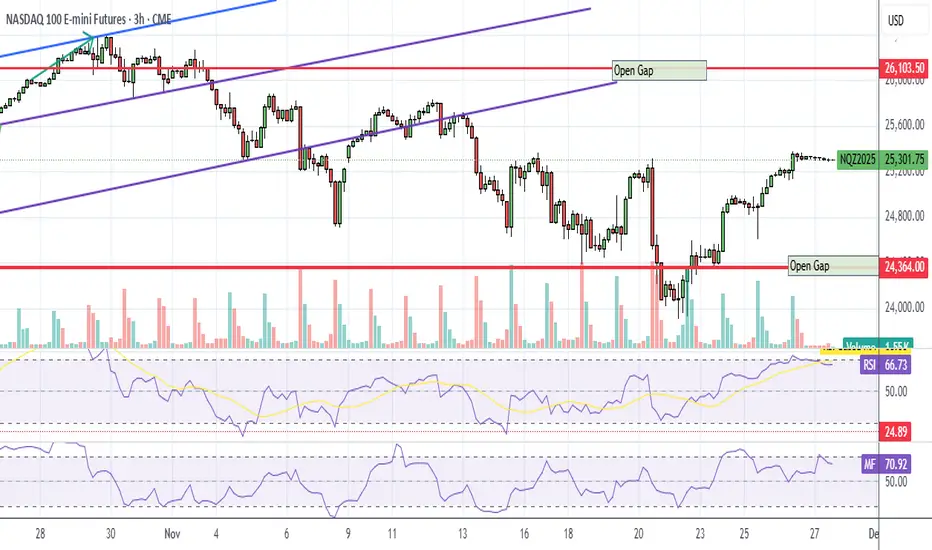
Emini Nasdaq 100. Important Areas to look for and Weekly outlookCME_MINI:NQ1!
Highlighted the important levels. what to look for how we can approach the next week in terms of higher timeframe reference points

NQ1! – Bearish Descending Channel, Short Setup Active Nasdaq 100 futures remain trapped inside a bearish descending channel on the 4H chart after failing to reclaim the 25,500 zone.
Key points: Series of lower highs along the blue upper trendline
Strong rejection every time price touches the channel top
Support cluster 25,000–24,800 tested multiple times but showing weakening bounces
RSI slipping toward oversold, but momentum still favors sellers
Bearish plan
Current price rejecting the upper channel again around 25,300–25,320
→ Short entry zone 25,280–25,320
Target 1: 25,000
Target 2: 24,800 (lower channel boundary)
Target 3: 24,500 (channel breakdown target)
Stop-loss above 25,450 (clear invalidation)
Risk/Reward → 1:1.8 average Bullish reversal only on strong break and close above 25,400–25,450 with volume (then first target 25,800). As long as we stay inside this channel, bias is short. Holiday-thinned liquidity can accelerate the move on Friday open.
Short setup live.

AI Valuation TechnicallyThese are the three largest market-cap listed companies on the Nasdaq.
If we are concerned about an AI bubble, I’m going to show you how I perform a quick glance at some top companies and their index to determine the likelihood of an upcoming short-, mid-, or long-term correction.
In 2017, Microsoft’s P/E reached its highest at 45 — and it continued to rise after that.
In 2023, Nvidia’s P/E reached its highest at 147 — and it continued to rise after that.
In 2024, Apple’s P/E reached its highest at 40 — and it continued to rise after that.
Video version:
Micro E-mini Nasdaq-100 Index
Ticker: MNQ
Minimum fluctuation:
0.25 index points = $0.50
Disclaimer:
• What presented here is not a recommendation, please consult your licensed broker.
• Our mission is to create lateral thinking skills for every investor and trader, knowing when to take a calculated risk with market uncertainty and a bolder risk when opportunity arises.
CME Real-time Market Data help identify trading set-ups in real-time and express my market views. If you have futures in your trading portfolio, you can check out on CME Group data plans available that suit your trading needs tradingview.com/cme/

NQ Premarket UpdateES and RTY filled the Sunday gap, NQ didn't quite fill, left a 3.5 pt gap. So small, I'm not sure if it matters.
In any case though, MFI is quickly approaching overbought, so it'll probably go down Tues or Wed anyways.

Weekly Market Forecast: Indices Are Weak! Wait For Sells!In this Weekly Market Forecast, we will analyze the S&P 500, NASDAQ, Gold and Silver futures, for the week of Nov 24-29th.
Enjoy!
May profits be upon you.
Leave any questions or comments in the comment section.
I appreciate any feedback from my viewers!
Like and/or subscribe if you want more accurate analysis.
Thank you so much!
Disclaimer:
I do not provide personal investment advice and I am not a qualified licensed investment advisor.
All information found here, including any ideas, opinions, views, predictions, forecasts, commentaries, suggestions, expressed or implied herein, are for informational, entertainment or educational purposes only and should not be construed as personal investment advice. While the information provided is believed to be accurate, it may include errors or inaccuracies.
I will not and cannot be held liable for any actions you take as a result of anything you read here.
Conduct your own due diligence, or consult a licensed financial advisor or broker before making any and all investment decisions. Any investments, trades, speculations, or decisions made on the basis of any information found on this channel, expressed or implied herein, are committed at your own risk, financial or otherwise.

NQ Week 48 T.A explained -
BackSide (BS)
FrontSide (FS)
Inverse BS (Inv.BS)
Inverse FS (Inv.FS)
BS & FS levels are expected support when dashed lines, tested when dotted and resistance when solid lines.
The inverse is true for the Inv. BS Inv. FS levels, they are resistance as dashed lines, tested as dotted and support as solid lines.
Monthly timeframe is color pink
weekly grey
daily is red
4hr is orange
1hr is yellow
15min is blue
5min is green if they are shown.
strength favors the higher timeframe.
2x dotted levels are origin levels where trends have or will originate. When trends break, price will target the origin of the trend. its math, when the trend breaks, the vertex breaks too so the higher timeframe level/trend that breaks, the more volatility there could be as strength in the orders flow in to fuel the move.

NQ UpdateOdd that MFI went up on no movement
At this point, I'm mostly cash. My favorite long play was GM calls, and that looks topped out.
Not sure about NQ, but I think ES will double top, so no put options for now. I did think about buying GM puts but decided not to.
MNQ SHORT TERM BUYS INTO SELLSI see MNQ opening with sells then buying up to the 88.6 zone and rejecting to continue downward

Nasdaq 100, USD Index: Thanksgiving PerformanceToday I’m digging into my Excel data to see how the Nasdaq and the US Dollar Index performed across the three trading days either side of Thanksgiving.
Matt Simpson, Market Analyst at City Index.

Will December Rate Cut Save the Market?Is Rate Cut Probability up a Short-Term Bounce or continuation of the downtrends?

Derivatives & Options Trading Trends1. Rising Retail Participation and Democratization of Derivatives
One of the most significant trends is the rapid increase in retail participation, especially in markets like India, the U.S., and parts of Asia. Platforms such as Robinhood, Zerodha, Upstox, and Interactive Brokers have made derivatives trading more accessible by offering low-cost or zero-brokerage models, simplified interfaces, and educational tools.
In India, index options volumes on NSE have surged to record highs, driven by weekly and even daily options expiries. Retail traders now actively participate in directional and non-directional strategies including spreads, straddles, strangles, and intraday scalping. Because of lower margin requirements and high leverage, derivatives have become an attractive entry point for younger traders.
This democratization comes with both opportunities and risks. While broader participation enhances market depth and liquidity, it also increases systemic concerns around over-leverage, herd behaviour, and inadequate understanding of derivatives mechanics.
2. Explosive Growth of Weekly and Short-Dated Options
Short-tenor options—weekly, daily, and even zero-day options (0DTE)—have become a global phenomenon. The U.S. S&P 500 Index (SPX) now sees major volumes in 0DTE options, favoured by traders for intraday speculation, gamma exposure, and event-driven strategies.
Similarly, in India, weekly Bank Nifty and Nifty expiries have turned into some of the most traded options worldwide. Traders prefer these contracts for:
Lower premiums
Quick payoff realization
High volatility leading to strong intraday movements
Flexibility to align with macro events (Fed decisions, CPI data, RBI policy, earnings, etc.)
Short-dated options have reshaped intraday volatility patterns, with large swings near expiry due to gamma effects and dealer hedging flows.
3. The Era of Algorithmic and Quantitative Trading in Derivatives
Quantitative models and algorithmic trading systems now dominate global derivatives markets. Hedge funds, proprietary desks, and even retail quants increasingly use:
Market-neutral strategies
Volatility arbitrage
High-frequency scalping
Options-based hedging
Gamma and vega-weighted portfolios
Machine-learning-driven directional trades
In India, algo penetration in derivatives has increased dramatically after regulatory approvals for API-based trading. Low-latency systems allow quants to execute thousands of trades per second, exploiting micro-imbalances, liquidity pockets, and implied-volatility mispricings.
Algo trading is particularly influential in options markets, where pricing inefficiencies emerge frequently due to time decay and volatility shifts.
4. Surge in Volatility Trading and Volatility Derivatives
A major global trend is the rise of volatility as an asset class. Traders now actively trade volatility, not just price direction, through:
VIX futures and options
Implied volatility strategies (IV crush, IV expansion)
Calendar spreads
Vega-neutral portfolios
Volatility arbitrage between indices and individual stocks
During major macro events—geopolitical shocks, central bank decisions, inflation releases—volatility spikes create large opportunities for professional traders.
The global appetite for volatility exposure reflects increasing macro uncertainty in markets shaped by inflation cycles, geopolitical risks, and policy unpredictability.
5. Growing Popularity of Exotic Options and Structured Derivatives
Beyond standard call and put options, demand is rising for exotic derivatives, especially among institutions. These include:
Barrier options
Asian options
Binary options
Lookback options
Range accrual derivatives
Digital payoff structures
Structured product desks in banks use these derivatives to offer tailored risk-return solutions to corporate treasuries, high-net-worth individuals, and offshore investors.
In equity derivatives, structured notes like autocallables are gaining traction globally, especially in European and East Asian markets.
6. Commodities and Currency Derivatives: A Renewed Focus
Commodity and currency derivatives have seen renewed interest due to global supply chain disruptions, geopolitical instability, and inflation pressures.
Key Drivers:
Oil price volatility due to Middle East conflicts
Agricultural supply shocks
Currency fluctuations driven by monetary policy divergence
Rising importance of hedging for import- and export-dependent industries
In India, the launch of new currency derivatives and increased retail interest in crude oil and natural gas options have broadened the market.
7. Interest Rate Derivatives and the Post-Rate-Hike World
As central banks oscillate between tightening and easing cycles, interest rate derivatives (IRDs) such as swaps, futures, and swaptions have gained remarkable importance.
Key themes include:
Hedging long-term debt exposure
Speculation on rate paths
Positioning around government bond yield movements
Managing duration risk for institutional investors
The pricing of interest rate options is now heavily influenced by inflation expectations, forward guidance, and global economic conditions.
8. Regulation, Risk Control & Margining Reforms
Global regulators have tightened rules around derivative trading to ensure transparency and reduce systemic risk. Major reforms include:
Mandatory margining for futures and options
Upfront collection of SPAN + Exposure margin
Position limits for retail participants
Greater disclosures for brokers and exchanges
Risk-based levies on high-frequency trading
Banning of certain high-risk derivatives for retail in some regions
In India, peak margin rules and tightened risk controls have significantly changed intraday derivatives strategies, reducing excessive leverage.
9. Rise of Data-Driven Decision Making
Modern derivatives traders rely heavily on:
Real-time order book analytics
Option Greeks monitoring systems
Volatility surface modelling
Big-data sentiment indicators
AI-driven predictive models
Access to sophisticated analytics platforms—Sensibull, Opstra, TradingView, Bloomberg, Reuters, and broker-provided tools—helps even retail traders adopt institution-grade analysis.
10. Shift Toward Multi-Asset Derivative Strategies
Markets are becoming increasingly interconnected. Traders now prefer multi-asset strategies that combine:
Equity + Currency
Equity + Commodity
Interest Rate + Currency
Options + Futures
Cross-country derivatives
These hybrid strategies help hedge correlated risks and exploit arbitrage opportunities across markets.
Conclusion
Derivatives and options trading are undergoing a profound transformation driven by retail participation, technological advancement, algorithmic dominance, volatility-focused strategies, and regulatory shifts. Markets are faster, more interconnected, and more complex than ever before. Whether used for hedging, speculation, arbitrage, or portfolio diversification, derivatives remain a cornerstone of modern financial markets.
As the global environment becomes more uncertain, derivatives will continue to play a crucial role in risk management and trading innovation—shaping the next era of financial markets.
Nasdaq Big crash is started from november 2025 month. Good luck.Technically on charts, Nasdaq has completed its viscous fed liquidity supported; all 5 elliot waves starting from 2001 dot com low 797 to present year high 26399. Today is 20.11.2025. Pic is attached for your reference. Will see this chart again after a year or may become obsolelte if nasdaq again crosses 26399 and stays above it for a month. Lets see.
