Bitcoin Is Crashing… Nasdaq Still at Highs. Who’s Lying?For years, Bitcoin and the Nasdaq 100 have shown consistently high correlation, driven by the same macro forces:
• global liquidity cycles,
• risk appetite,
• real-rate expectations,
• and flows into high-beta growth assets.
Both are classic risk-on instruments—they benefit when liquidity expands and suffer when uncertainty rises.
However, the chart above shows a significant decoupling over the past weeks:
🔻 BINANCE:BTCUSDT : Deep Correction & Negative YTD
• Down more than 25% from the highs
• Trading –5% YTD in USD terms
• Volatility expanding and long liquidations accelerating
• Risk sentiment turning sharply lower within crypto
🔺 LSE:NQ11 : Near All-Time Highs
• Still hovering close to ATH levels
• Posting +16% YTD in USD
• Supported by strong earnings, mega-cap tech flows, and continued growth leadership
⚠️ This divergence is unusual — and historically meaningful
BTC and Nasdaq rarely disconnect to this magnitude without one of two outcomes:
1️⃣ Bitcoin Is Leading the Next Risk-Off Move
Crypto often reacts faster to changes in liquidity conditions and risk appetite.
If this is another leading signal, equities (especially high-beta tech) may follow with a lag.
2️⃣ Correlation Break Is Temporary
If the move was primarily crypto-specific (liquidations, funding resets, derivatives unwinds),
BTC could mean-revert upward as flows stabilize.
📌 Our View
Historically, when divergences of this scale have appeared:
Bitcoin leads, equities follow.
The magnitude of BTC’s correction vs the Nasdaq’s resilience suggests that:
👉 BTC may be pricing in a shift in risk conditions ahead of equities, not the opposite.
The key question for the next weeks:
Is the Nasdaq ignoring a message that crypto is already discounting?
NASDAQ 100 E-mini Futures
No trades
Trade ideas

#202546 - priceactiontds - weekly update – nasdaq e-miniGood Evening and I hope you are well.
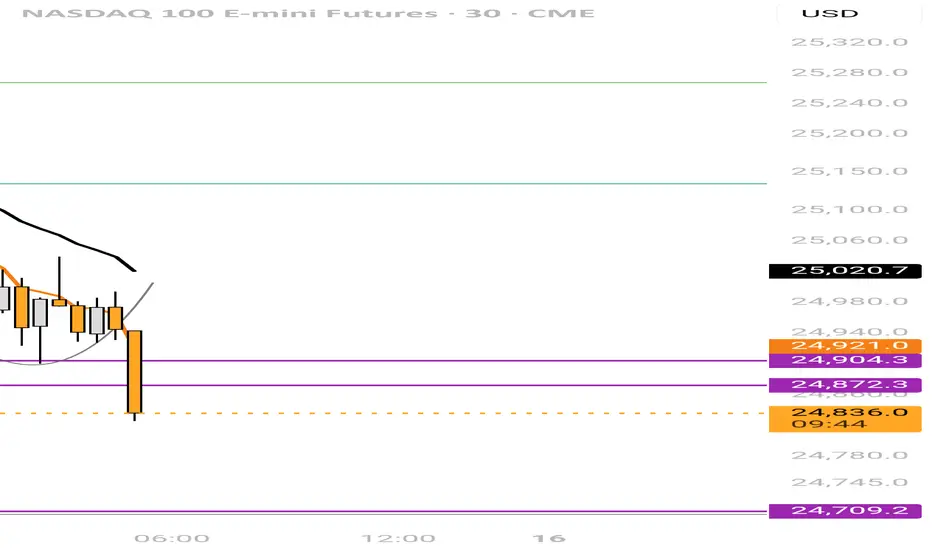
comment: Again, not much difference to dax. Also in a triangle and for now I highly doubt we will see a big range expansion out of 24600 - 25500. We had two weeks where the bears showed strength but what do they have to show for? We closed above 25000 in both weeks. That’s still as bullish as it gets. Only a bearish daily close below 24600 could change my outlook.
current market cycle: trading range 24000 - 26500 / 4h chart it’s a triangle 24700 - 25500
key levels for next week: 24500 - 25500
bull case: Bulls bought 24700 heavily again and closed the week above 25000. Bears can have no confidence in shorts when we rally for 667 points after a 1095 point drop. Problem for the bulls is that they also have to be very careful with buying high again since the downside can be huge. Which will likely mean that we won’t see much interest in buying above 25400ish. Even longing 25000 when we can drop down to 24600 or lower, is a tough trade.
Invalidation is below 24709.
bear case: Every dip is heavily bought. Has not changed. Can only become more bearish with a daily close below 24000 and that’s far. 25830 is likely the stop, most bears have to have for most shorts next week. That’s a big range and it any short below 25300 from being decent imo. We are making lower highs and lower lows but the lower lows just barely. Until that changes, we will most likely continue sideways in the given range.
Invalidation is above 25830.
short term: Neutral around 25000. Short closer to 25700 and longs closer to 25600.
medium-long term - Update from 2024-11-02: Market went further in the wrong direction so my targets become increasingly unrealistic. Right now the 50% retracement is 21750 and would mean a 18% drop. That’s a bit too much to ask for as of now. 24150 is the breakout-retest of the prior ath from 2024-12 and a more realistic target.

Weekly outlook on NQ, ES and Dow. Index Triad NYSEThis week will be a tricky one. I need more data to understand about the expansion on the weekly. We will take it on a day to day basis after each daily closures

Would you consider this a H&S break on NQ?Would you consider this a H&S break?
I know things are volitile and wierd right now...which makes me think that this could be a weird looking H&S. Remember, the patterns show us an idea, a story. Does this tell the story to you? It shows what an H&S shows. It is just sloppy because of volitile movements...
Ascending triangle gaps end of earnings (just about) correction?All the earnings releases and positive impact of business investment in AI gave the market anther move higher, but what now everything is so stretched gaps appearing and a negative pattern suggest a correction, the question how far ?

Global Energy Dynamics and Geopolitical Trade Routes1. The Foundation: Why Energy Shapes Global Power
Energy is the engine behind transportation, manufacturing, digital infrastructure, agriculture, and military strength. Nations with abundant energy—like Saudi Arabia, Russia, or the U.S.—carry global influence. Nations dependent on imports—like India, Japan, or most of Europe—must secure safe trade routes and diplomatic relationships.
There are three major categories in global energy dynamics:
1. Fossil Fuels (Oil, Gas, Coal)
Still dominate global energy consumption (over 75%).
Key for transportation (oil), heating & power (gas), and bulk energy (coal).
Controlled by resource-heavy nations (Middle East, U.S., Russia, Australia).
2. Renewables (Solar, Wind, Hydro, Green Hydrogen)
Growing rapidly because of climate goals and cost reduction.
Countries compete to become renewable technology leaders (China, Europe, U.S., India).
3. Nuclear Energy
Provides long-term stable baseload power.
Geopolitically sensitive because of dual uses (civilian + military).
Every country strategizes to ensure energy security—meaning energy should be affordable, accessible, and uninterrupted.
2. Major Players Controlling Global Energy
Middle East – Oil & Gas Superpower
Home to the largest oil reserves (Saudi Arabia, Iraq, UAE, Iran, Kuwait).
The region influences global prices via OPEC+ production decisions.
Any tension—war, blockade, sabotage—instantly impacts global markets.
United States – Shale Revolution Leader
World's largest oil and gas producer.
Controls energy diplomacy through production capacity, sanctions, and technology.
LNG exports from the U.S. influence European and Asian markets.
Russia – Energy Leverage Over Europe
Major exporter of natural gas and crude oil.
Controls pipelines into Europe.
Has used energy as a strategic bargaining tool.
China – World’s Largest Energy Consumer
Dominates solar, battery, and rare earth markets.
Heavy dependence on Middle East oil and foreign natural gas.
Secures maritime routes via the Belt and Road Initiative (BRI).
India – Fastest-Growing Energy Market
Heavy importer of crude oil (~85%).
Diversifying import partners to avoid over-dependence.
Expanding renewables and strategic petroleum reserves.
3. Key Geopolitical Trade Routes in Global Energy
Energy moves through oceans, pipelines, and chokepoints. Any disruption impacts global prices and supply security.
1. Strait of Hormuz (Persian Gulf)
Most important oil chokepoint in the world.
~20% of global oil and ~25% of LNG passes through.
Surrounded by Iran and U.S.-allied Gulf states—very sensitive region.
Even a minor conflict can cause oil prices to spike.
2. Strait of Malacca (Between India, China, Southeast Asia)
China, Japan, South Korea heavily depend on this route for fuel imports.
Any disruption forces tankers to take longer, costly paths.
India’s presence in the Indian Ocean gives it strategic leverage.
3. Suez Canal & SUMED Pipeline (Egypt)
Connects Middle East oil to Europe.
Blockages increase transportation time around Africa.
Critical for LNG shipments too.
4. Panama Canal
Important for U.S. LNG trade to Asia.
Climate change–driven drought affects capacity.
5. Russia-Europe Pipelines
Nord Stream, Druzhba, TurkStream, and others.
Pipeline sabotage or sanctions immediately affect European power prices.
6. Africa’s West & East Coast Routes
West Africa exports crude to Europe and Asia.
East Africa emerging as LNG route (Mozambique).
If these routes are disrupted due to war, piracy, sanctions, or blockades, global energy markets react instantly.
4. How Geopolitics Shapes Energy Decisions
Sanctions as Weapons
Nations use sanctions to punish rivals.
U.S. sanctions on Iran and Russia reduced their oil exports.
These sanctions shift global trade flows—India, China, and Turkey buy discounted oil.
Energy as Diplomatic Leverage
Energy-rich nations influence global politics:
Russia pressures Europe through gas supply.
Saudi Arabia adjusts production to stabilize or shock global markets.
Qatar’s LNG gives it major diplomatic importance.
Military Presence Protects Trade Routes
Countries place naval forces near key chokepoints:
U.S. Fifth Fleet in the Persian Gulf.
India in the Indian Ocean.
China near the South China Sea.
Technology & Supply Chain Power
China dominates:
Solar module production.
Battery manufacturing.
Rare earth mining.
This gives China a new form of energy leverage similar to OPEC’s oil power.
5. The Shift Toward Renewables and New Geopolitics
The world is moving toward clean energy, creating new winners and losers.
Winners
Countries with abundant sun/wind (India, Australia, Middle East).
Nations leading in battery and EV technology (China).
Nations rich in critical minerals like lithium, cobalt, nickel (Chile, DRC, Indonesia).
Losers
Countries dependent solely on oil exports.
Nations slow in clean-tech investments.
Green Hydrogen Trade Routes
Future trade routes will shift from crude oil tankers to hydrogen carriers.
Major exporters expected:
Saudi Arabia
UAE
Australia
India (later stage)
Importers:
Japan
South Korea
Europe
6. Energy Security Strategies Countries Use
Countries globally adopt 6 major strategies:
1. Diversification of Suppliers
Don’t depend too much on one country.
India buys from Gulf, Russia, U.S., Africa.
2. Strategic Petroleum Reserves (SPR)
A buffer against supply shocks.
India, China, U.S., Japan maintain large SPRs.
3. Building New Pipelines & Ports
Example: India’s west coast LNG terminals.
EU’s pipelines from Norway and Caspian region.
4. Building Alliances
QUAD, OPEC+, IEA—energy diplomacy groups.
5. Investing in Renewables
Reduces fossil fuel dependence and price volatility.
6. Securing Maritime Routes
Stronger navy, anti-piracy operations, trade agreements.
7. The Future of Global Energy Dynamics
The next decade will be shaped by:
1. Multipolar Energy World
Energy power shifting from the Middle East–U.S.–Russia triangle to:
India
China
Africa
Renewable superpowers
2. Electrification Era
EVs, solar parks, energy storage systems reduce oil demand long-term.
3. Digital and AI-driven Energy Systems
Smart grids, demand forecasting, AI optimization.
4. New Vulnerabilities
Cyberattacks on power plants and pipelines.
Supply chain dependencies on minerals and chips.
Conclusion
Global energy dynamics and geopolitical trade routes form the backbone of global economic stability. They decide fuel prices, industrial growth, inflation levels, and even military strategies. As the world transitions from oil dominance to renewable energy leadership, the geopolitical map will evolve. New trade routes, new alliances, and new energy powers will emerge. In short, understanding energy geopolitics means understanding the future of global power balance.

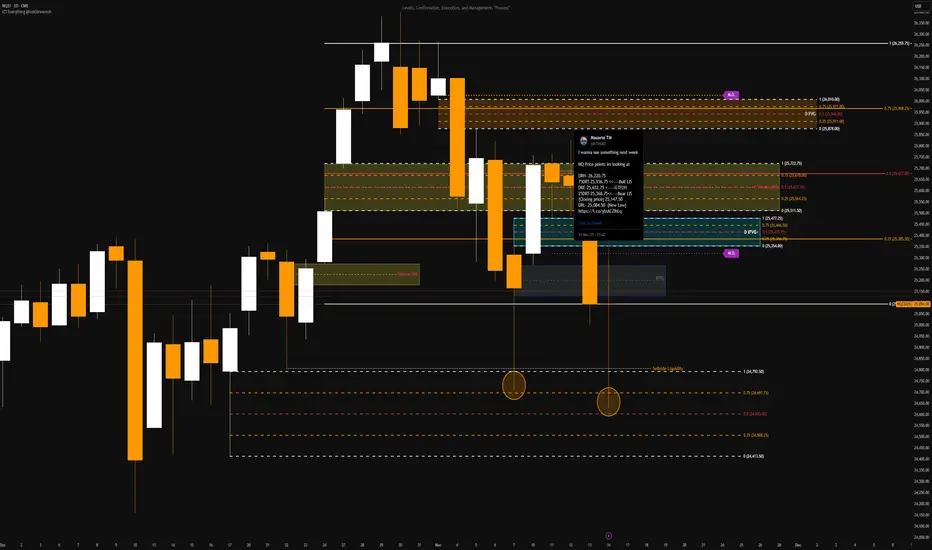
Market Maker Buy ModelMarket Maker Buy Model in the making for NQ:
- Weekly low triggered;
- Inversion FVG creation;
- Swing high broken;
- Targeting 0.705 of the Dealing Range;
- Entry at the highest FVG with Swing low for stop placement;
- Leap trade;

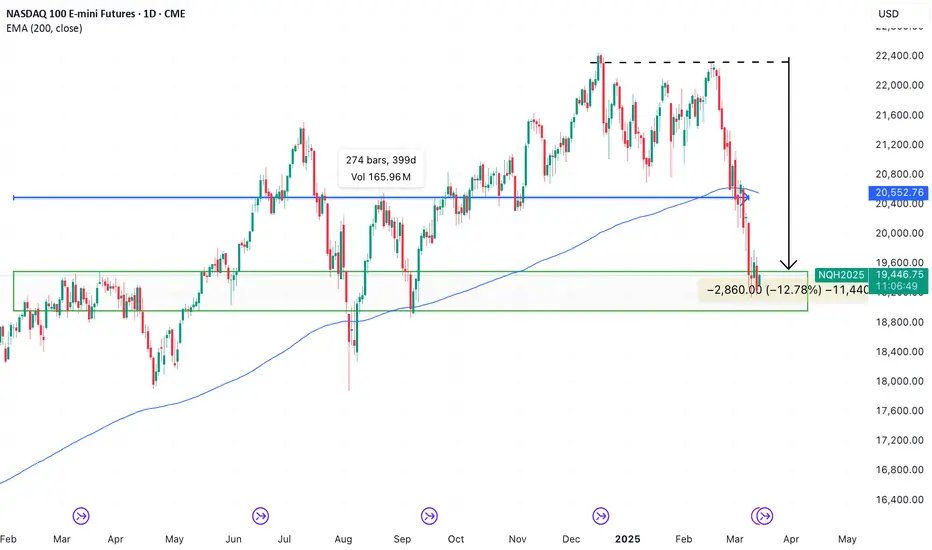
NASDAQ 100: Same Song, Different LyricsAfter a 12% pullback, NQ is retesting price levels from 400 days ago, and to many, it looks like a crash is coming. But what’s really driving the jitters?
1.Apple’s sales concerns & downgrades
2.Tariff fears (that haven’t even been imposed yet)
3.Doomsday takes on the U.S. economy
Sounds familiar? Same melody, just different words.
Yes, the stop is wide, but the profit target from here is at least 5X.
The question is—who sees an opportunity, and at what levels?
NQ Price points im looking at for reversals or continuationsReversal: Sweep HTF LiQ + Breakaway gap + BRKR + Revisit = Entry
Continuation: Closure above 25,936 + MTF CISD + IMRB/IOFED + LTF OB respected = Entry
DRH- 26220.75
75DRT-25936.75
DRE- 25652.75
25DRT- 25368.75
(close of 25147.50)
DRL- 25084.50
TREND LINE 5M30 SECOND MODELPrice swept the prior session’s Asia low, tapping into a 4H demand zone aligned with a 1H bullish order block. On the 1-minute chart, liquidity was taken and a clean BISI formed. Entered long on the first retracement into the FVG with stops below the swing low. Targeted the opposing 15M liquidity pool, partialed at the midpoint, and closed the rest as price reacted into a 1H imbalance.

NQ - Week 46 (1hr chart)
T.A explained -
BackSide (BS)
FrontSide (FS)
Inverse BS (Inv.BS)
Inverse FS (Inv.FS)
BS & FS levels are expected support when dashed lines, tested when dotted and resistance when solid lines.
The inverse is true for the Inv. BS Inv. FS levels, they are resistance as dashed lines, tested as dotted and support as solid lines.
Monthly timeframe is color pink
weekly grey
daily is red
4hr is orange
1hr is yellow
15min is blue
5min is green if they are shown.
strength favors the higher timeframe.
2x dotted levels are origin levels where trends have or will originate. When trends break, price will target the origin of the trend. its math, when the trend breaks, the vertex breaks too so the higher timeframe level/trend that breaks, the more volatility there could be as strength in the orders flow in to fuel the move.
yesterday
Trade closed manually
price followed the candle science and timeframes from the 5min green levels to the weekly grey level. Price has left behind some inverse frontside and inverse backside candles which look to be forming the bridge to flip the script if price manages to gain those levels and start accumulation. That liquidity will "unlock" and fuel price action.

NQ - 15min chart T.A explained -
BackSide (BS)
FrontSide (FS)
Inverse BS (Inv.BS)
Inverse FS (Inv.FS)
BS & FS levels are expected support when dashed lines, tested when dotted and resistance when solid lines.
The inverse is true for the Inv. BS Inv. FS levels, they are resistance as dashed lines, tested as dotted and support as solid lines.
Monthly timeframe is color pink
weekly grey
daily is red
4hr is orange
1hr is yellow
15min is blue
5min is green if they are shown.
strength favors the higher timeframe.
2x dotted levels are origin levels where trends have or will originate. When trends break, price will target the origin of the trend. its math, when the trend breaks, the vertex breaks too so the higher timeframe level/trend that breaks, the more volatility there could be as strength in the orders flow in to fuel the move.

NQ As PredictedI made this analysis yesterday and played out so well. Let me know if you took any trade using this today.

NQ Weekly Recap | November 10–14, 2025Method: I track impulse/correction and BOS (break of structure). Trend filter is the 50 EMA (black); momentum/trigger EMAs are the 5 & 10 (white).
Recap
Mon: Clear upside impulse with BOS up. White EMAs above the black 50 → bullish continuation vibe.
Tue: Early follow‑through, then momentum faded; corrections got deeper and EMAs started to flatten.
Wed: Failed attempts to hold above the white EMAs, then a clean BOS down as price slipped under the black 50 → trend flipped.
Thu: Follow‑through short. Lower highs into the white EMAs; corrections kept getting sold while staying below the black 50.
Fri: Flush then sharp bounce. Price reclaimed the white EMAs intraday but stalled around the black 50—looks corrective; no full BOS up yet.
Takeaways
Early week was bullish.
Midweek we failed below the EMAs and followed shorts.
The late‑week bounce is just a correction unless we get a fresh BOS up and hold above the EMAs with the black 50 turning back up.
NQ Targets (09-29-25)Moving into October, 7 week range forecast. Basically, 23,050 is 50% retracement of YTD lift. Looking for a retest of that, no hold and keep going to the YTD Open or circle below (yellow arrow path). White arrow path has two targets, these are potential drop/rejection zones (to yellow arrow path). KL 24,950 is ML of TZ, we have played in lower half and may see some play in upper half. Sideways to lower during this 7 week period is the idea.

NQ Range (11-10-25, Week 7)The 7 week Forecast is in the final week and we are up about 300 points after getting rejected at upper Target. NAZ back in the Churn Zone and did U Turn off Friday lows just under the Mid Level CZ. KL 483 is TZ to 25,333. Key fact is the NAZ and NDX are at long tern TL. Under the TL is Danger Zone to lower CZ and then TLX 24,056. Current range to watch is 25,333 and 24,817. Friday lift was Failed Auction up and these usually will get retested. Could be a start of a U Turn (that will drop and retest). Or, just another Friday pump drop offset that will trap the BTD/FOMO's.

NQ1 - Bullish Whipsaw = Dip Buys In Choice StocksNasdaq just printed a big bullish whipsaw on the 4 hour chart to tap liquidity below support and rebound back up.
This is quite a significant bullish signal.
It is lower time frame so we will need to see it hold and it may chop around...
But in this area is where we're likely to see bullish recoveries and breakouts in choice stocks and even crypto 🧐.


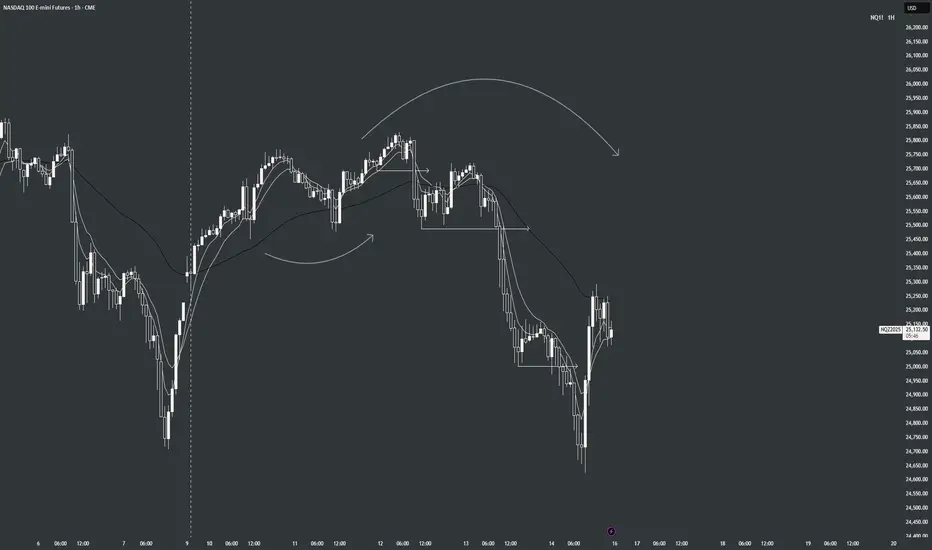
"It's Me Again, Margaret"Ajax, aka Monster Head & Shoulders, is back again. He has been dominating our charts since 9/16.
His neckline: 24680
Buy the Dip area 1: 24640 - 24570
Buy the Dip area 2: 24550 - 24500
Pullbacks are a normal part of bull markets. We are ~4% off the high. Correction territory is 10% or more. As Day Traders we welcome pullbacks as opportunities to trade the same Px zone at least one more time.
This one is due to the govt. shutdown and the resulting lack of economic data as well as the economic losses, profit taking after the Dow posted two all-time highs in a row, and concern about over valuation especially of tech stocks.
All a normal and healthy part of the markets.
One major attraction of the Nasdaq 100 to us as day traders are its big swings. It gives more opportunity for Px action and profits than the other markets.
He has a new Breakout Ladder set @ 24770. every 20 points he will buy 1 contract. Each and every target will be 19 points.
Above you can see the BTD areas. This neckline may turn out to be a good BTD area. I'd wait until at least 09:50 NY Time before placing a BTD trade above the green shaded BTD areas.
From 9/16 to the present this support zone has been a very important one. Let's see if it holds.

NQ1Here is a couple of possibilities: If we can bounce here at the diagonal green line then it will be making a higher low to continue the uptrend.
However, the green horizontal line is the neck line @ 24,119 for a possible head and shoulders pattern or a double bottom...either way it should bounce there... but we will have to wait for pattern development.

NASDAQ FALL!Perfect Liquidity Hunting on going!
Tap on the buy side Liquidity and moving for the Sell side.

Liquidity Hunting On!A perfect drop post buy side Liquidity Hunting now going for the sell side Liquidity.
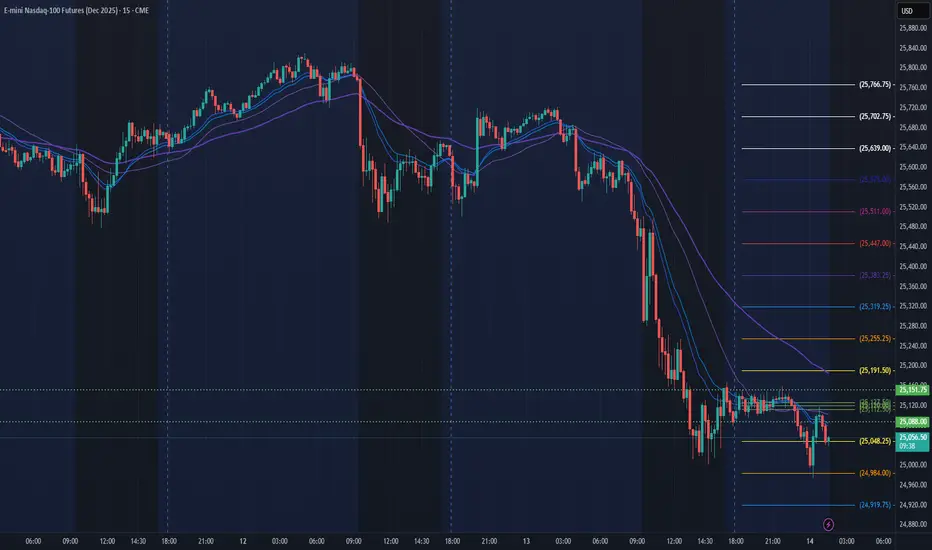
NQ Power Range Report with FIB Ext - 11/14/2025 SessionCME_MINI:NQZ2025
- PR High: 25151.75
- PR Low: 25087.75
- NZ Spread: 143.0
No key scheduled economic events
Session Open Stats (As of 12:55 AM)
- Session Open ATR: 439.51
- Volume: 47K
- Open Int: 302K
- Trend Grade: Long
- From BA ATH: -5.1% (Rounded)
Key Levels (Rounded - Think of these as ranges)
- Long: 26636
- Mid: 25410
- Short: 24039
Keep in mind this is not speculation or a prediction. Only a report of the Power Range with Fib extensions for target hunting. Do your DD! You determine your risk tolerance. You are fully capable of making your own decisions.
BA: Back Adjusted
BuZ/BeZ: Bull Zone / Bear Zone
NZ: Neutral Zone