Why Are Markets Rising Despite the Tariffs?Because of the
1) Set timeline on finalizing the tariff rates and
2) The ongoing negotiations,
They aimed at striking a balanced deal between the U.S. and its trading partners.
The Liberation Day tariffs were announced on 2nd April, and markets initially crashed in response. However, just seven days later, on 9th April, the U.S. postponed the higher tariff increases for most countries by 90 days. Since then, markets have rebounded and even broken above their all-time highs set in December last year.
Now that the dust is settling with the expiration of timeline and ongoing negotiations, the big question is:
Where will the markets head next?
Mirco Nasdaq Futures and Options
Ticker: MNQ
Minimum fluctuation:
0.25 index points = $0.50
Disclaimer:
• What presented here is not a recommendation, please consult your licensed broker.
• Our mission is to create lateral thinking skills for every investor and trader, knowing when to take a calculated risk with market uncertainty and a bolder risk when opportunity arises.
CME Real-time Market Data help identify trading set-ups in real-time and express my market views. If you have futures in your trading portfolio, you can check out on CME Group data plans available that suit your trading needs www.tradingview.com
Trade ideas

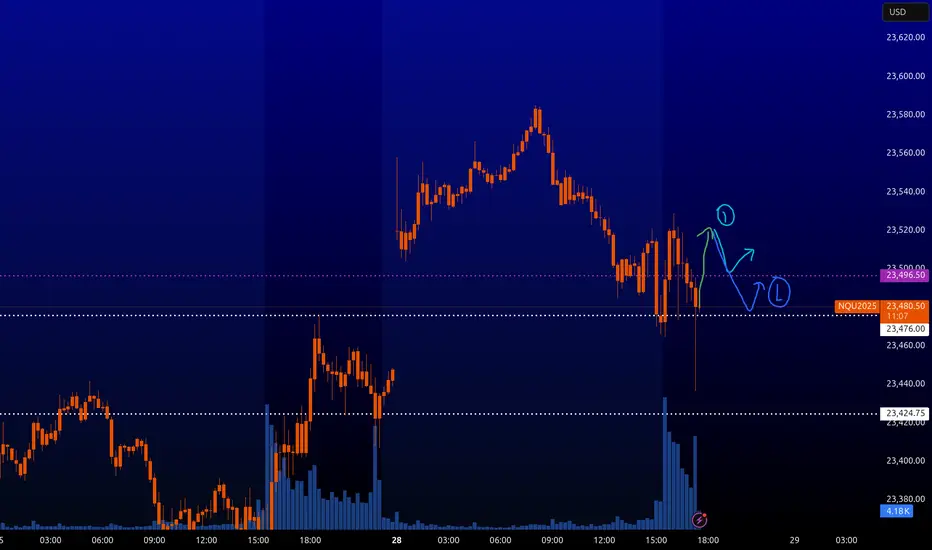
NQ : Scalping levelsA rebound from the level with the arrow can be expected.
During volatile news, it is not recommended to trade when the market is closed. However, it will continue to operate for the time being.

NQ Short (07-28-25)The F-M Long Rig is active with a Gap Up and Pump/Dump play. Just notice KL 486 and how/when the NAZ gets above. In O/N, the Reg Session and previous hits at 23,440 got rejected and is why you are seeing the move in the off session. The BTD/FOMO chase is active, Pump/Dump near Open today for next move.
Tuesday Long Trade for the NASDAQ 7/29I'm feeling ultra bullish on NQ right now. Ideally, I want to see price carve out an inverse head and shoulders or a double bottom—either could serve as a springboard to new highs. I took two longs this morning and captured solid gains off the weekly opening gap. Would love to see one final wick into that zone before we blast off.
Long Entry:23,476.75
Target: Break of the Highs | Trailing SL
Today's trades:

NQ & ES Key LevelsExactly as I predicted yesterday...The price was supported at the key levels and moved upwards.
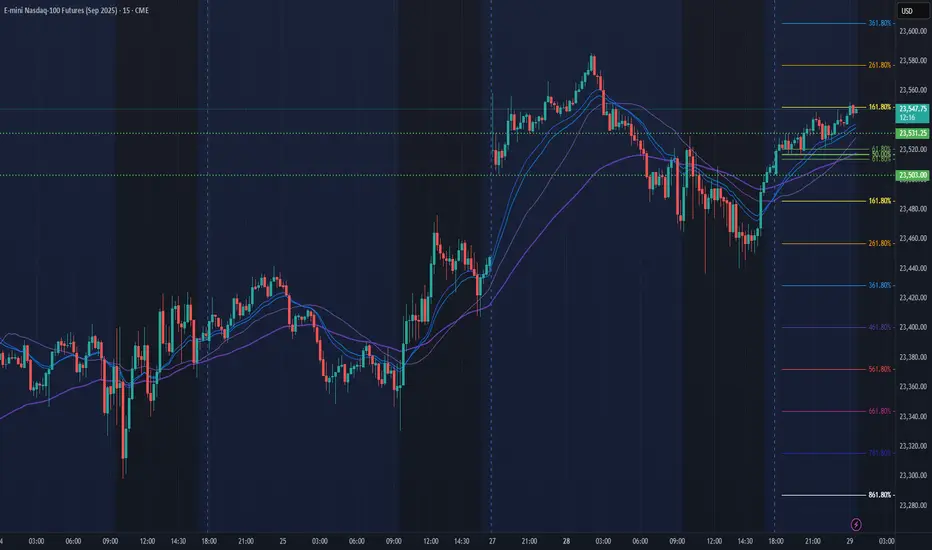
NQ Power Range Report with FIB Ext - 7/29/2025 SessionCME_MINI:NQU2025
- PR High: 23531.00
- PR Low: 23503.00
- NZ Spread: 62.5
Key scheduled economic events:
10:00 | CB Consumer Confidence
- JOLTs Job Openings
Session Open Stats (As of 12:25 AM 7/29)
- Session Open ATR: 233.38
- Volume: 17K
- Open Int: 280K
- Trend Grade: Long
- From BA ATH: -0.2% (Rounded)
Key Levels (Rounded - Think of these as ranges)
- Long: 23811
- Mid: 22096
- Short: 20383
Keep in mind this is not speculation or a prediction. Only a report of the Power Range with Fib extensions for target hunting. Do your DD! You determine your risk tolerance. You are fully capable of making your own decisions.
BA: Back Adjusted
BuZ/BeZ: Bull Zone / Bear Zone
NZ: Neutral Zone
Bias is still Bullish However its month end Overall bias is still strong bullish, do note that its coming to end of month, either we pull back a bit or continues higher till end of month then pullback. Losing 23350 and 23300, probabilities of moving lower will higher since we had short squeeze move last Friday. Max Pain is 23020 can be use as a guide off futures movement.
E-mini Nasdaq 100. 28.07.2025, MondayCME_MINI:NQ1!
Explained the daily orderflow on NQ along with possible entries and exits and mistakes stops. Everything outlined in here

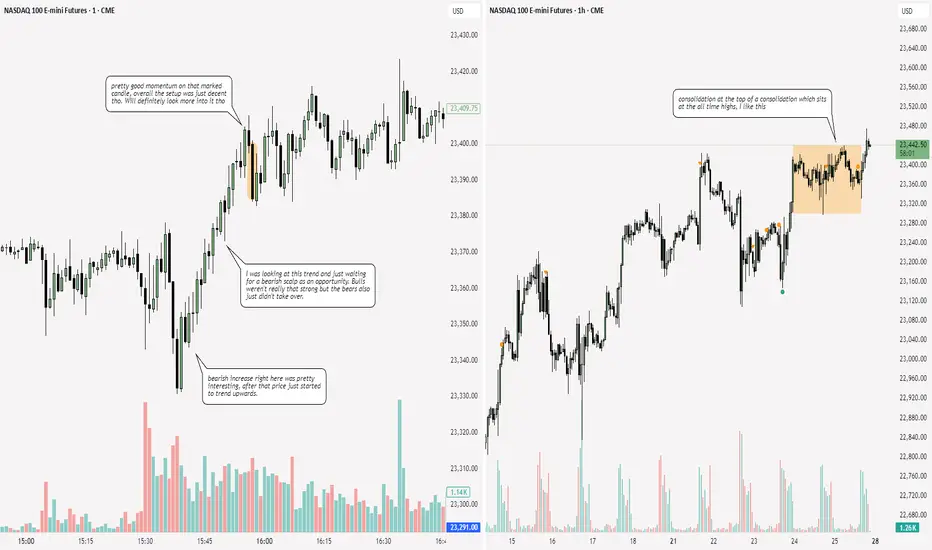
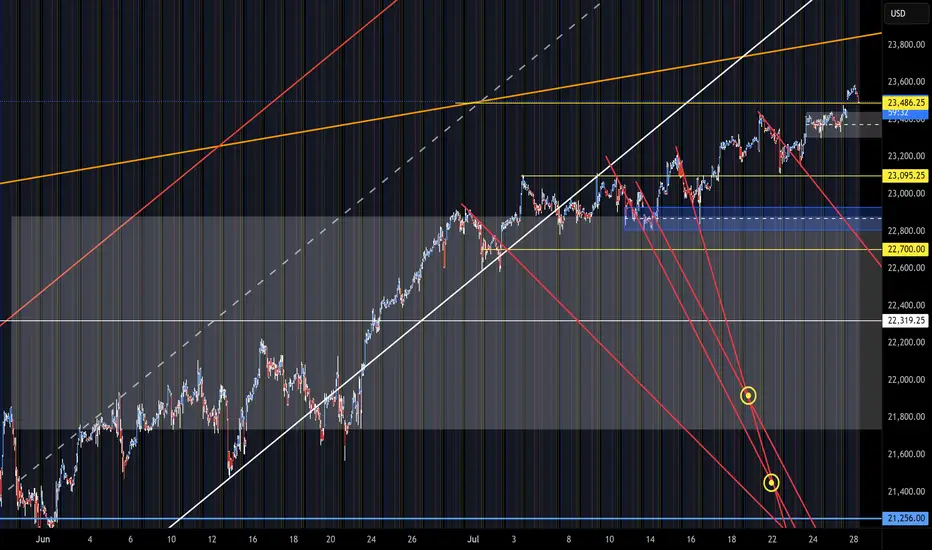
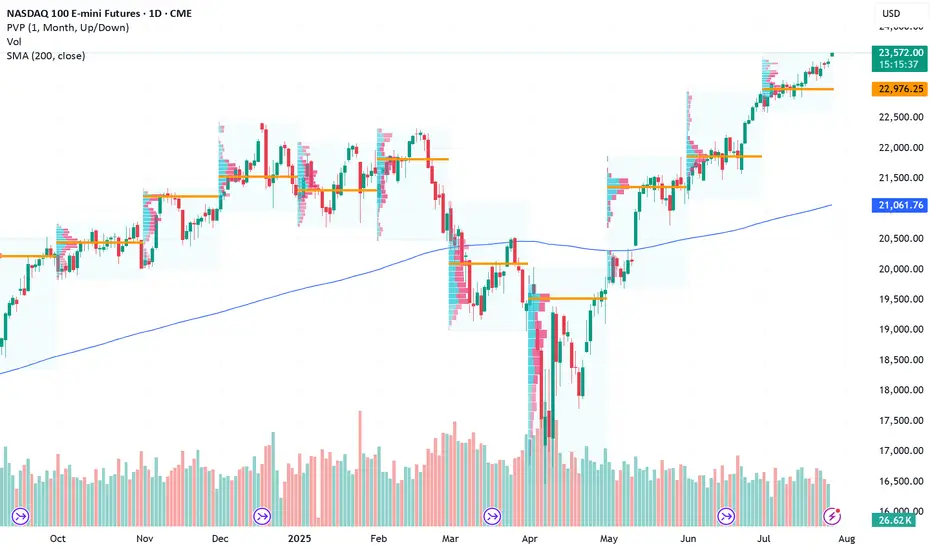
NASDAQ 100 LOOKING OVERBOUGHT RIPE FOR A CORRECTION?Hey Traders so today was looking at the Nasdaq 100 and it seems like it's approaching overbought territory at all time highs.
Of course no one knows what earnings season will bring and seasonally historically August is normally a good month for stocks.
So if we look at previous rallies market seems to correct eventually 3% or 4%. I think that is actually healthy for the market also.
So if your bullish watch for 3% correction and buy back in around 22,800-23,000 put a stop under support at around 22,000-22,500. Hopefully the market won't make it that far on a sell off so odds of getting stopped out are low I think.
However if you are Bearish I don't reccommend selling at All Time High. Best odds for stronger selloff I think is waiting until September as it is historically the weakest month of the year for stocks seasonally.
Good Luck & Always use Risk Management!
(Just in we are wrong in our analysis most experts recommend never to risk more than 2% of your account equity on any given trade.)
Hope This Helps Your Trading 😃
Clifford

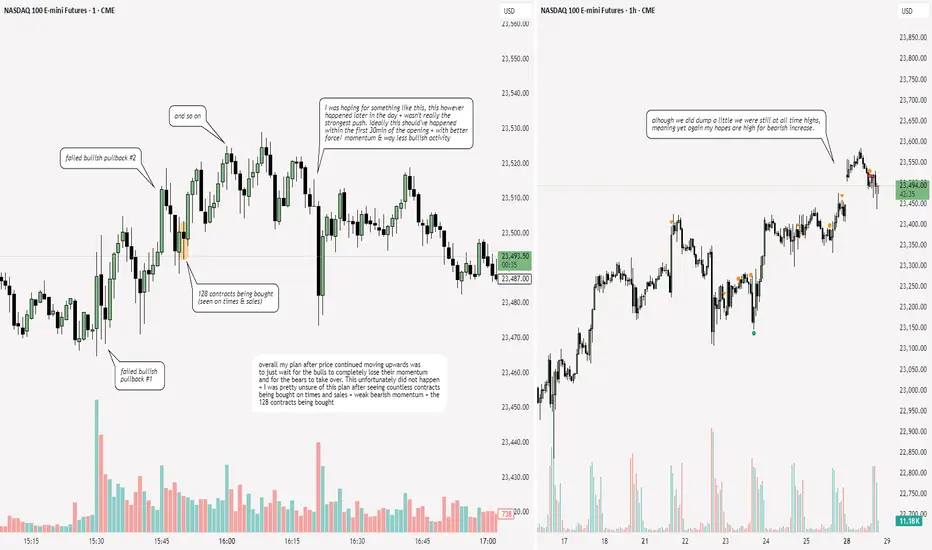
NQ: 225th trading session - recapWas definitely more focused today. The plan also was great - just no setup, but that aight since its the focus that really matters rn
NQ : Scalping levelsHere's a very likely scenario on the NQ trade. Once the price grows back, you can take short pullbacks from these levels.
Be careful on trading on the news. It is better not to trade in them. Also, the levels are unlikely to work in illiquid times.
I will post the results of the levels and my trades in the comments if everything will be according to the scenario.
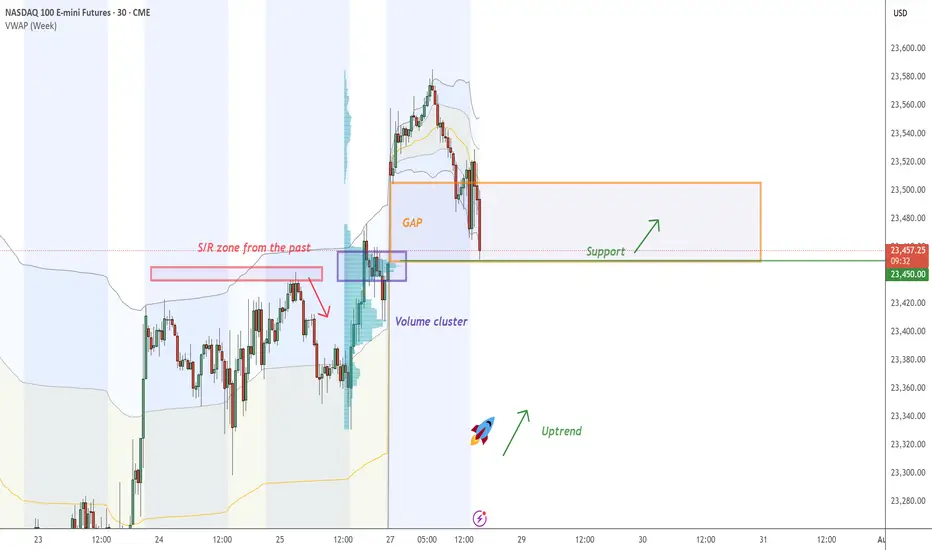
NASDAQ - Fair Value GAP On NASDAQ , it's nice to see a strong buying reaction at the price of 23450.00.
There's a significant accumulation of contracts in this area, indicating strong buyer interest. I believe that buyers who entered at this level will defend their long positions. If the price returns to this area, strong buyers will likely push the market up again.
(FVG) - Fair Value GAP and high volume cluster are the main reasons for my decision to go long on this trade.
Happy trading
Dale

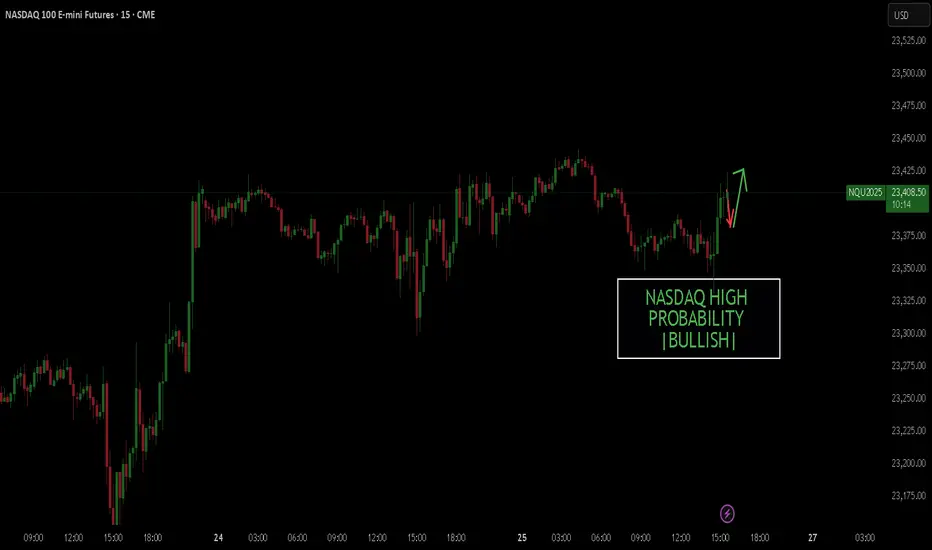
NASDAQ BULLISHHello, I hope you are well today. I just noticed that the Nasdaq could be starting a new bullish trend with an 85% probability.
Tariffs, Trade Deals, & Central Bank Watch: Key Week in MarketsCME_MINI:NQ1! CME_MINI:ES1! CME_MINI:MNQ1! COMEX:GC1! CME_MINI:MES1! NYMEX:CL1!
This is a significant week in terms of macroeconomic headlines, key data releases, central bank decisions, and major trade policy developments. We get numbers for growth, inflation and decision and insights into monetary policy. Combining this with ongoing trade policy developments, we have a key week which may shape how the rest of the year unfolds.
Below is a consolidated summary of the latest trade negotiations, scheduled economic releases, and policy outlooks.
US - EU Trade Deal:
• US–EU Tariffs: The US will impose a 15% tariff on most EU goods, including cars, semiconductors, and pharmaceuticals, but retain a 50% tariff on steel and aluminium with a new quota system.
• Exemptions: Zero-for-zero tariffs agreed for agriculture, aircraft parts, and chemicals; aircraft exports are temporarily exempt.
• EU Commitments: The EU will invest $600 billion in the US and purchase $750 billion in US energy, mainly LNG.
• Agriculture: The EU will lower tariffs on many US agricultural goods, though not comprehensively.
• Political Reactions: EU leaders are mixed, Germany and the Netherlands praised the deal, France called it unbalanced, and Hungary viewed it unfavorably.
• The deal is not final until it is ratified by all EU national parliaments and the EU Parliament.
China Talks: US and China expected to extend their trade truce by 90 days. US-China meeting expected in Stockholm on Monday and Tuesday. Trump to freeze export controls to secure a deal. A group of US executives will visit China for trade discussions, organized by the US-China Business Council.
South Korea Trade Talks: Korea proposes a shipbuilding partnership with the US and is preparing a trade package.
UK–US Relations: PM Starmer and Trump to meet in Scotland to discuss the UK–US trade deal implementation, Middle East ceasefire, and pressure on Russia.
Thus far, the US has announced trade deals with the UK, Vietnam, Philippines, Indonesia, Japan and The EU. Trade delegations are working to finalize deals with China, Mexico, Canada
Key Economic Data Releases:
Monday: Treasury refunding financing estimates.
Supply: 2-Year and 5-Year Note Auction, 3 & 6-Month Bill Auction
Tuesday: US Advance Goods Trade Balance, Wholesale Inventories Advance, CB Consumer Confidence, JOLTS Job Opening (Jun), Atlanta Fed GDPNow, Australian CPI Q2
Supply: 7-Year Note Auction
Wednesday: German GDP Q2, EUR GDP Q2, US ADP Non-farm Employment, US GDP Q2, Crude Oil Inventories, Chinese Manufacturing PMI
Canada: BoC Interest Rate Decision, Rate Statement, Monterey Policy Report, BoC Press Conference
US: Fed Interest Rate Decision,FOMC Statement, Fed Press Conference.
Japan: BoJ Interest Rate Decision, Monetary Policy Statement
Thursday: EU Unemployment (Jun), US PCE & Core PCE Price Index (Jun)
Japan: BoJ Press Conference
Friday: EU CPI, US NFP, Unemployment Rate, Average Hourly Earnings, ISM Manufacturing PMI, Michigan 1-Year & 5-Year Inflation Expectations.
It is also a busy earnings week. See here for a complete earnings schedule .
Markets are interpreting trade deals as positive news thus far. The dollar is strengthening.
As we previously mentioned, we anticipate no rate cuts this year as economic data proves to be resilient and inflation largely under control. WSJ also posted an article stating that most tariffs costs are being absorbed by companies due to weaker pricing power. We previously wrote about this on our blog: “ In our analysis, the inflation impact of tariffs may not show up until Q4 2025 or early 2026, as tariff threats are mostly used as a lever to negotiate deals. While effective tariff rates have increased, as Trump reshapes how tariffs are viewed, cost pass-through to consumers will be limited in Q3 2025, as companies’ front-loaded inventory helps mitigate the risks of increased tariff exposure.
So, what we have is an interesting development shaping up where, while inflation may rise and remain sticky, it is yet to be seen whether slowing consumer spending will weaken enough to the point where companies must start offering discounts, which would nullify the tariff risk to the end consumer and result in companies absorbing all tariffs. This scenario will see reduced earnings margins leading into the last quarter and early 2026. However, it will materially reduce risks of higher inflation.”
In our view, the US dollar has a higher probability to rally in the short-term i.e., Q3 as markets re-align FX rate differentials. Bond yields stabilize, Equities continue pushing higher, while Gold retraces as previously mentioned. This in our view, is what investors and participants refer to as the Goldilocks scenario. If this plays out as expected we anticipate continued strength with AI, tech, energy and defense sectors outperforming into mid- 2026.
Institutional View: Morgan Stanley
Morgan Stanley also sees no rate cuts in 2025, despite market pricing for two 25 bps cuts. They forecast more aggressive cuts in 2026 due to:
• Tariff-related inflation emerging before labor market deterioration
• Slowing US growth, as fiscal support fades
• Impact of tighter immigration policy and global trade realignment
That said, MS continues to cite longer-term risks to the dollar, including:
• Twin deficits (fiscal + current account)
• Ongoing debate around USD’s safe haven status
• USD hedging activity picking up by international investors
• Strained credibility of the Fed due to tension between Fed Chair and the US Administration
How Fed policy evolves in Q4 2025 and Q1 2026 will depend heavily on the incoming Fed Chair nominee, who is expected to replace Jerome Powell in May 2026. This nomination could significantly influence future policy direction around growth and inflation targets.

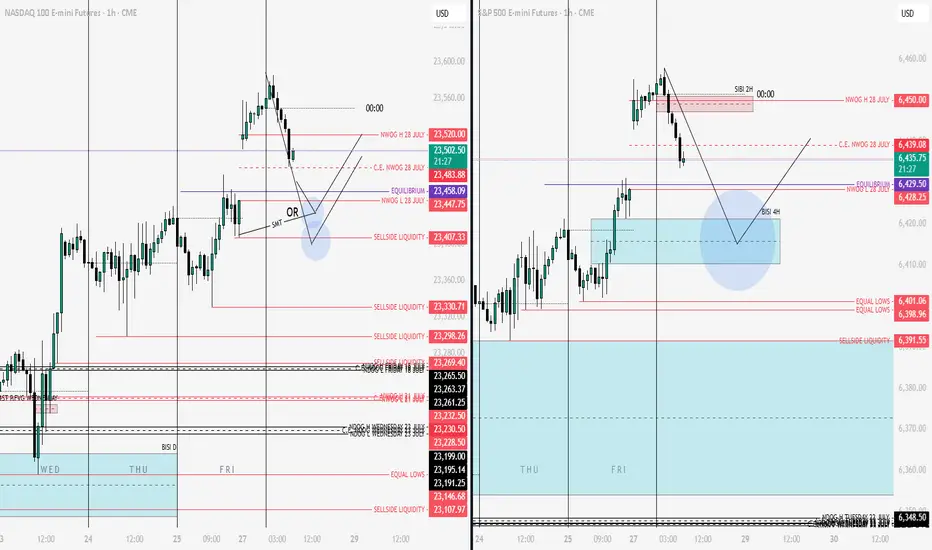
NQ & ES Key Levels 28-07As long as the price is above the purple line (Equilibrium) I am bearish... Below the purple line there are these key levels where the price can react aggressively and start to rise, seeing a reversal. It will either rise to a point and continue to fall or it will start a rally to the ΑΤΗ.
NQ LONGSeems like this mornings run might be a bit exaggerated. Looking for a healthy pullback stop go long.

Approach Next Resistance Amid Cautious OptimismCurrent Price: 23272.25
Direction: LONG
Targets:
- T1 = 23480
- T2 = 23720
Stop Levels:
- S1 = 22990
- S2 = 22770
**Wisdom of Professional Traders:**
This analysis synthesizes insights from thousands of professional traders and market experts, leveraging collective intelligence to identify high-probability trade setups. The wisdom of crowds principle suggests that aggregated market perspectives from experienced professionals often outperform individual forecasts, reducing cognitive biases and highlighting consensus opportunities in NASDAQ Futures.
**Key Insights:**
NASDAQ Futures exhibit strong recovery potential but face technical resistance at $23420. The market momentum suggests short-term bullishness despite concerns about seasonal reversals in late August to October. Traders are advised to focus on breakout scenarios while employing risk mitigation strategies including hedges.
**Recent Performance:**
Over the past six months, NASDAQ Futures have displayed substantial volatility. After a steep drop of 27%, the index staged an impressive 40% recovery. Such swings highlight heightened risk yet underscore resilience, bolstered by strong inflows into technology stocks.
**Expert Analysis:**
Analysts caution against overcrowded positions in mega-cap tech stocks dominating NASDAQ Futures. While the rally has offered compelling returns, seasonal risks suggest potential reversals during late summer and early autumn. Diversification strategies into less-crowded sectors may enhance portfolio robustness.
**News Impact:**
Recent announcements around AI adoption, earnings beats by key technology firms, and federal monetary policy stabilization have bolstered sentiment in tech-heavy indices, including NASDAQ Futures. Continued interest in growth stocks adds fuel to the bullish narrative despite looming risk factors.
**Trading Recommendation:**
Traders should consider a LONG position based on strong bullish sentiment and favorable technical setups. However, risk factors such as seasonal reversals and crowded trades in large-cap technology stocks require prudent stop levels and diversification strategies to protect against downside vulnerabilities.
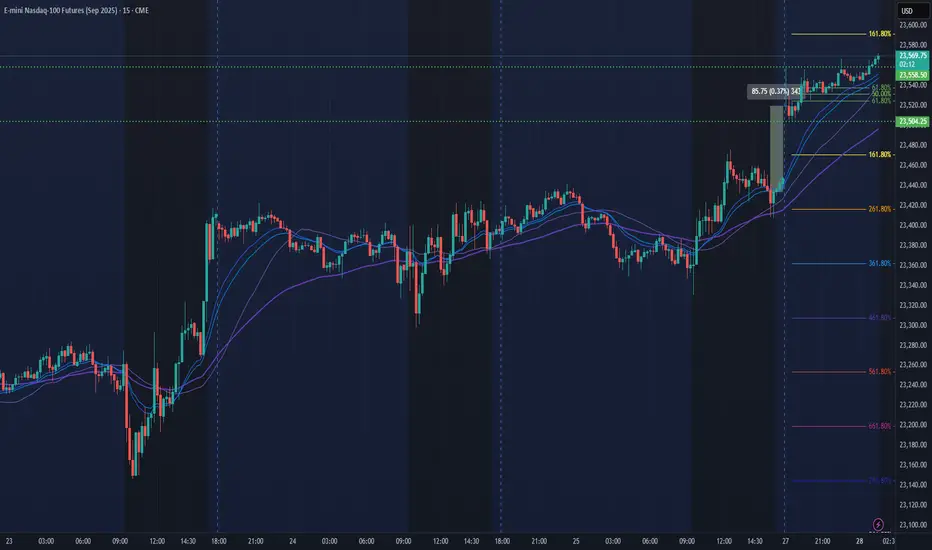
NQ Power Range Report with FIB Ext - 7/28/2025 SessionCME_MINI:NQU2025
- PR High: 23558.25
- PR Low: 23504.00
- NZ Spread: 121.25
No key scheduled economic events
Weekend gap up of 0.37% into new ATH
Session Open Stats (As of 12:25 AM 7/28)
- Session Open ATR: 245.44
- Volume: 23K
- Open Int: 276K
- Trend Grade: Long
- From BA ATH: -0.0% (Rounded)
Key Levels (Rounded - Think of these as ranges)
- Long: 23811
- Mid: 22096
- Short: 20383
Keep in mind this is not speculation or a prediction. Only a report of the Power Range with Fib extensions for target hunting. Do your DD! You determine your risk tolerance. You are fully capable of making your own decisions.
BA: Back Adjusted
BuZ/BeZ: Bull Zone / Bear Zone
NZ: Neutral Zone
NASDAQ (Nas 100): Buyers Are In Control. Wait For LongsWelcome back to the Weekly Forex Forecast for the week of July 28 - Aug 1st.
In this video, we will analyze the following FX market:
NASDAQ (NQ1!) NAS100
The Nasdaq rose Friday to fresh highs, following a busy week of tariff updates and earnings. The index is showing no signs of bearishness.
Wait for pullbacks to FVGs to buys.
FOMC and NFP warrant caution with new entries. Wait until the news before new entries.
Enjoy!
May profits be upon you.
Leave any questions or comments in the comment section.
I appreciate any feedback from my viewers!
Like and/or subscribe if you want more accurate analysis.
Thank you so much!
Disclaimer:
I do not provide personal investment advice and I am not a qualified licensed investment advisor.
All information found here, including any ideas, opinions, views, predictions, forecasts, commentaries, suggestions, expressed or implied herein, are for informational, entertainment or educational purposes only and should not be construed as personal investment advice. While the information provided is believed to be accurate, it may include errors or inaccuracies.
I will not and cannot be held liable for any actions you take as a result of anything you read here.
Conduct your own due diligence, or consult a licensed financial advisor or broker before making any and all investment decisions. Any investments, trades, speculations, or decisions made on the basis of any information found on this channel, expressed or implied herein, are committed at your own risk, financial or otherwise.

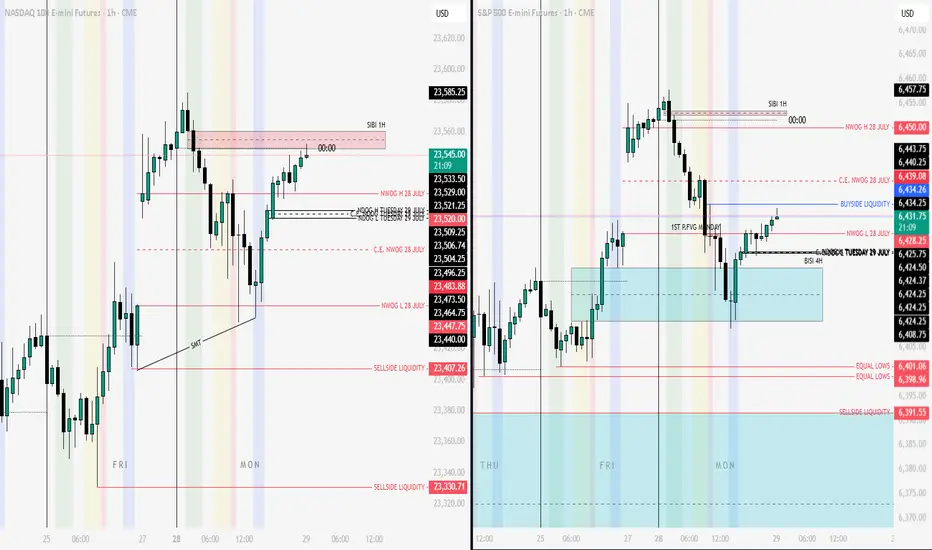
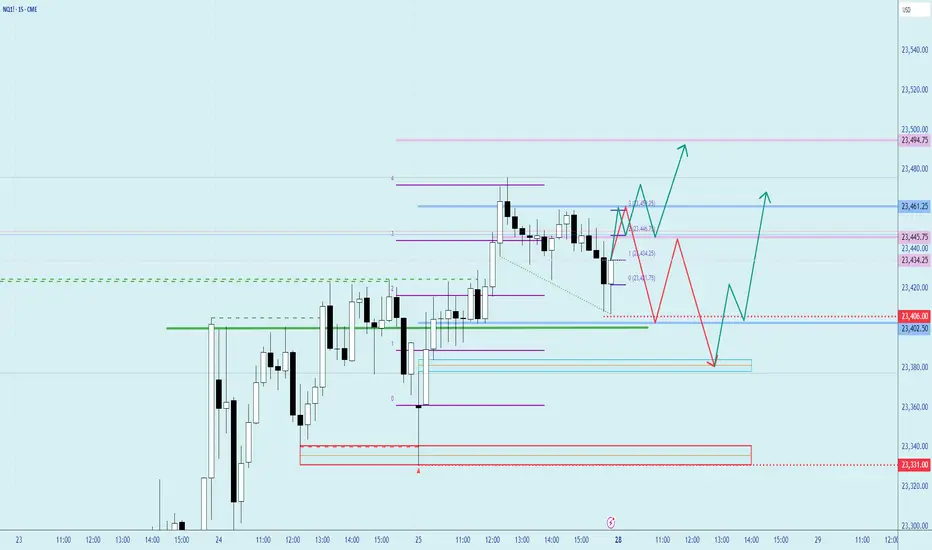
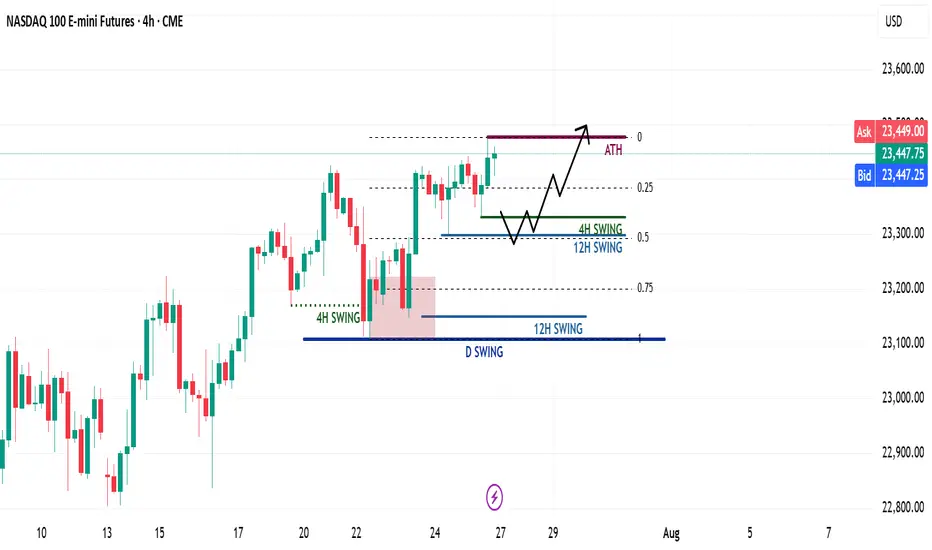
NQ Weekly Recap & Gameplan – 27.07.2025🧭 Market Sentiment
The overall sentiment remains bullish, supported by:
• Lower inflation data
• Trump’s policy shift toward aggressive rate cuts
This creates a strong risk-on environment across U.S. indices.
🔙 Previous Week Recap
• NQ continued its price discovery phase
• Price swept 4H swing liquidity and triggered a market structure shift
• A new 1H demand zone was formed after MSS
• Price revisited the 1H demand and launched toward new all-time highs (ATH)
• While I anticipated a deeper retracement, ES provided the cleaner pullback
• I executed longs on both ES and NQ using SMT divergence (ICT SMT concept)
📊 Technical Analysis
My bias remains bullish as long as the higher timeframe structure holds.
For the upcoming week:
• Watching for either the 4H or 12H swing high to get swept
• Ideally, a retracement toward the 0.5 Fib level, which aligns with my bullish discount zone
• A clean liquidity sweep into this zone could act as a launchpad for the next leg higher
⚙️ Trade Setup & Execution Plan
Entry Strategy:
• Wait for a new 1H–4H Market Structure Shift
• Identify the new demand zone post-MSS
• Look for price to return to the zone for a long opportunity with LTF confirmation
Trade Management:
🎯 Target: New ATH
⛔ Stoploss: Swing low of the 1H–4H demand zone
📌 Chart will include Fib levels, MSS zones, and execution trigger areas.
Let me know your thoughts or share your plan below.
Happy trading!
NQ & ES Technical AnalysisGood evening my friends... This is my first time posting something on this platform. I decided to share my analysis on NQ & ES here with you, but without sharing strategies, rules and entry techniques. Only the key levels and scenarios... I will make one or two comments every day... I am very happy to share my ideas with you!!!

NQ: 224th trading session - recapWasn't too focused today which is definitely not good. Atleast there wasn't any big setup today. But still, shouldn't happen