NQ1! - SELL
Looking very weak
Return to Previous Level Pattern clean Support
RSI Multi Indicator all Down
Ultra Metre All Red
Quick Scalp
NQU2023 trade ideas

long on nas100Looking for a lower high to be made noting it went down a bit Im still thinking its gonna retrace and then keep going

Read the chartnot much to say ive been posting prior... we in a ut simple we in the top aka everasla...

SELAHI knew this low would be taken because prices true objective was macro equal lows to the left. Simple continuation. Praise God!

tech is going uptoday we have touch the bottom part of a range.
we are going up.
entry in blue. target in green.
stop in red.
have fun
Eleketra 33

NQ Power Range Report with FIB Ext - 5/30/2024 SessionCME_MINI:NQM2024
- PR High: 18765.50
- PR Low: 18720.25
- NZ Spread: 101.25
Key economic calendar events
08:30 | Initial Jobless Claims
- GDP
11:00 | Crude Oil Inventories
Strong value decline to follow through on pivot from 19000
Evening Stats (As of 2:35 AM)
- Weekend Gap: N/A
- Gap 10/30/23 +0.47% (open < 14272)
- Session Open ATR: 227.32
- Volume: 40K
- Open Int: 251K
- Trend Grade: Bull
- From BA ATH: -1.8% (Rounded)
Key Levels (Rounded - Think of these as ranges)
- Long: 19246
- Mid: 18106
- Short: 17533
Keep in mind this is not speculation or a prediction. Only a report of the Power Range with Fib extensions for target hunting. Do your DD! You determine your risk tolerance. You are fully capable of making your own decisions.
BA: Back Adjusted
BuZ/BeZ: Bull Zone / Bear Zone
NZ: Neutral Zone

Nasdaq 1 MonthNasdaq's Mixed Signals
At a glance, the Nasdaq looks robust, but if you remove the influence of the MAG 7 (the biggest tech companies), the landscape changes. Take NVDA NVDA -1.01%↓ , for example, which gained an impressive 7% yesterday. This is largely due to the upcoming 10:1 stock split on June 10, 2024, which is driving market enthusiasm. However, we urge caution, as these events can often lead to a "sell the news" scenario.
While this may keep the Nasdaq buoyant for a while, we're also keeping an eye on a bearish rising wedge pattern since April 22, 2024, which suggests a potential minimum drop to the 18,000 level. It's a waiting game from here on out.
The C Correction: What to Expect
Our analysis of past patterns indicates a retest of the 2021 all-time high (ATH). However, we present three alternative scenarios:
1. Testing the Bull Market Support Band: This would see a drop to around 18,000.
2. Running Flat Correction: A less severe correction, leveling off at the same point as Correction A.
3. 2021 ATH Expanded Flat: A more deep outlook, where the market corrects to the 2021 ATH.
We'll be closely monitoring the market's behavior, particularly volume and candle development, to determine which level the correction will reach.


NQ Line In the SandE-mini S&P (June) / E-mini NQ (June)
S&P, yesterday’s close: Settled at 5324.75, up 3.25
NQ, yesterday’s close: Settled at 18,940.50, 64.50
E-mini S&P and E-mini NQ futures are on their backfoot ahead of the opening bell. As I mentioned in my evening video last night, breadth is at the front of my mind as it has been deteriorating significantly. Without NVDA these two major indices would have already eroded much more. Look no further than the E-mini Dow, which has no true NVDA exposure, trading more than 3.5% from its local high last Tuesday.
Yields are another concern, as the U.S. 10-year is now above 4.5%, the highest since the Friday May 3rd Nonfarm Payroll report. Also, according to the CME Group’s FedWatch Tool, the odds of more than one rate cut this year have dropped to 35.9% from 49.5% one week ago.
Although we are cautious, and I popped on the CNBC Halftime Report to update viewers with a hedge position on Friday, the trend is undoubtedly still bullish. Therefore, we will continue to hold a slight Bullish Bias as detailed below. However, we are watching yesterday’s intraday low in the E-mini S&P of 5296.75 very closely, and continued action below here will likely encourage added selling. If this is the case, a break below last week’s low and, furthermore, major three-star support at 5260-5264 will Neutralize this Bias in the near-term. Additionally, last Thursday’s settlement in the E-mini NQ, the big reversal day post-NVDA earnings, was 18,696.25 and aligns with the previous record high on March 8th and March 21st as major three-star support. We view a violation and close below here, as well as rare major four-star support at 18,620-18,635, as a negative and clear break of the bullish trend.
Bias: Neutral/Bullish
Resistance: 5304.50-5309.75***, 5316-5317.25**, 5324.75-5326***, 5329.25-5331.25***
Pivot: 5296.75
Support: 5285.25-5289.75***, 5273.50-5275**, 5260-5264***, 5241.50**, 5213.50-5216.75***, 5202.25-5204.25***
NQ (June)
Resistance: 18,919-18,946***, 18,977-18,982***, 19,023*, 19,085***, 19,319***
Pivot: 18,819-18,839
Support: 18,775-18,787*, 18,732-18,750**, 18,684-18,709***, 18,620-18,635****, 18,545-18,547**, 18,415-18,485***, 18,336.25-18,348**, 18,266,25-18,293***
Micro Bitcoin (May)
Yesterday’s close: Settled at 68,455, down 1,020
Bias: Neutral/Bullish
Resistance: 68,930-69,575***, 70,280-70,435**, 70,840-71,000***, 72,340-72,570
Pivot: 68,250
Support: 67,100-67,585**, 66,280-66,535****, 65,445**, 64,622-64,865***, 61,835-62,801***
*Trade ideas cited above are for illustration only, as an integral part of a case study to demonstrate the fundamental concepts in risk management under the market scenarios being discussed. They shall not be construed as investment recommendations or advice. Nor are they used to promote any specific products, or services.
Futures trading involves substantial risk of loss and may not be suitable for all investors. Trading advice is based on information taken from trade and statistical services and other sources Blue Line Futures, LLC believes are reliable. We do not guarantee that such information is accurate or complete and it should not be relied upon as such. Trading advice reflects our good faith judgment at a specific time and is subject to change without notice. There is no guarantee that the advice we give will result in profitable trades. All trading decisions will be made by the account holder. Past performance is not necessarily indicative of future results.

nasdaq FUN TIME2 possible trades.
long and short.
target in green.
description on the chart.
have fun
Elektra 33

NQ Power Range Report with FIB Ext - 5/29/2024 SessionCME_MINI:NQM2024
- PR High: 18951.00
- PR Low: 18936.75
- NZ Spread: 31.75
No significant calendar events
Fading inside prev session range.
- Hold prev week's highs
Evening Stats (As of 12:05 AM)
- Weekend Gap: N/A
- Gap 10/30/23 +0.47% (open < 14272)
- Session Open ATR: 227.10
- Volume: 20K
- Open Int: 249K
- Trend Grade: Bull
- From BA ATH: -0.7% (Rounded)
Key Levels (Rounded - Think of these as ranges)
- Long: 19246
- Mid: 18106
- Short: 17533
Keep in mind this is not speculation or a prediction. Only a report of the Power Range with Fib extensions for target hunting. Do your DD! You determine your risk tolerance. You are fully capable of making your own decisions.
BA: Back Adjusted
BuZ/BeZ: Bull Zone / Bear Zone
NZ: Neutral Zone

posted a bit late but short on nas100looking for a short on nas after the break out downwards from my trend line I marked.


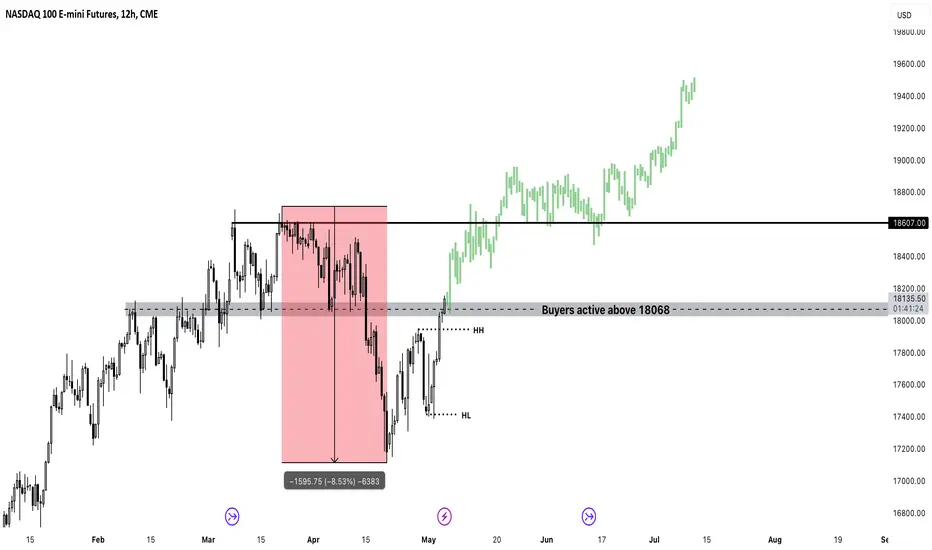
NASDAQ Uptrend Continuation Nasdaq 100 has fallen by 8.53% since its previous high.
The market has now created a new higher high and higher low signalling strong bullish momentum. If price can stabilise above 18608, we can see price target all time highs.

Long MNQAlgo says go long with a possible 2 entry if SL is hit. I may be taking profit at 50% target

NQ Power Range Report with FIB Ext - 5/28/2024 SessionCME_MINI:NQM2024
- PR High: 18956.00
- PR Low: 18905.00
- NZ Spread: 114.0
Key economic calendar event
10:00 | CB Consumer Confidence
Holding above Friday's highs
- High vol session open value decline
- Wide PR/NZ spread
- HIgh volume open from long holiday weekend
Evening Stats (As of 12:05 AM)
- Weekend Gap: N/A
- Gap 10/30/23 +0.47% (open < 14272)
- Session Open ATR: 235.95
- Volume: 95K
- Open Int: 250K
- Trend Grade: Bull
- From BA ATH: -0.5% (Rounded)
Key Levels (Rounded - Think of these as ranges)
- Long: 19246
- Mid: 18106
- Short: 17533
Keep in mind this is not speculation or a prediction. Only a report of the Power Range with Fib extensions for target hunting. Do your DD! You determine your risk tolerance. You are fully capable of making your own decisions.
BA: Back Adjusted
BuZ/BeZ: Bull Zone / Bear Zone
NZ: Neutral Zone


Can the HOUSE be skilled and catch this Counter Trend SHORT...?CME_MINI:NQ1!
“Never give up, never give in, and when the upper hand is ours, may we have the ability to handle the win with the dignity that we absorbed the loss.” -Doug Williams
As I've been studying PA on the Daily TF, it seems as if we have finally hit exhaustion in the market for buyers as their job may have been complete. I was lookin at a Potential SHORT that the HOUSE may be able to capitalize on... Here's what I would like to see in PA in order to enter SHORT...
1) As 1Hr Demand Zones build up & Supply Fails, The first level of demand I need to see fail is pricing around ($18678.00) which would indicate the first sign that sellers may be present and could be ready to start the Market Correction...
2) Once we get the first 1Hr Demand Failure and we get confirmed candle closures underneath pricing ($18678.00), I want to see sellers push price down towards Daily Support Level ($18623.00)...
3) This is a very important Key.....Once we get to the Daily Support Level ($18623.00) There is a huge 1Hr indecision candle rii underneath that level that I want to see sellers push price deep into and have confirmed candle closures inside the 1Hr Candle and underneath Daily Support Level...
****I need to see sellers present with confirmed candle closures under the Daily Support Level on the 30m TF and below in order for to me place my limit...
4) If and when we can get the sequence of events to take place in PA then I will be compelled to go SHORT playing the retest of Daily Support Level pricing around ($18623.00) & targeting the resting SSL below / 1Hr demand zone EQ pricing around ($18490.50) roughly around 530 pts in our favor!!
5) This is a counter trend SHORT so we need to be very skilled in our approach... Lets stay focused!! *** Almost forgot Price needs to be trading underneath the RED V-WAP in order for me to enter SHORT as-well as a last min. cherry on top confirmation!!
Remember when it comes to FRM (Financial Risk Management) our job is to manage the downside costs of printing High side returns of $$$ consistently... Let's Step!!
Stay Focused & Reach Excellence!!
#BHM500K #NewERA #Champions

a short on nas100 seeing the bounce of the resistance zone I marked, looking for it to go back down to the previous support and retest or break it and going lower but Ill be monitoring it.


NQ - trading session no.124:00pm - 5:00pm (session)
I have now decided that only 4 trades per day is not enough
--> up to 10 trades ig; Ill have to take a look at the max loss per day then tho
overall a good day; learned sum stuff:
- watch the overall size of pullbacks!
- wait for the right conditions!!!
PnL: +1 RR

nasdaq droolookign at the market today we haved made a new range, and we are in the top part of it.
short today.
entry 1 in blue, red stop, target green.
entry 2 in blue (top line).,
have fun
Elektra 33
