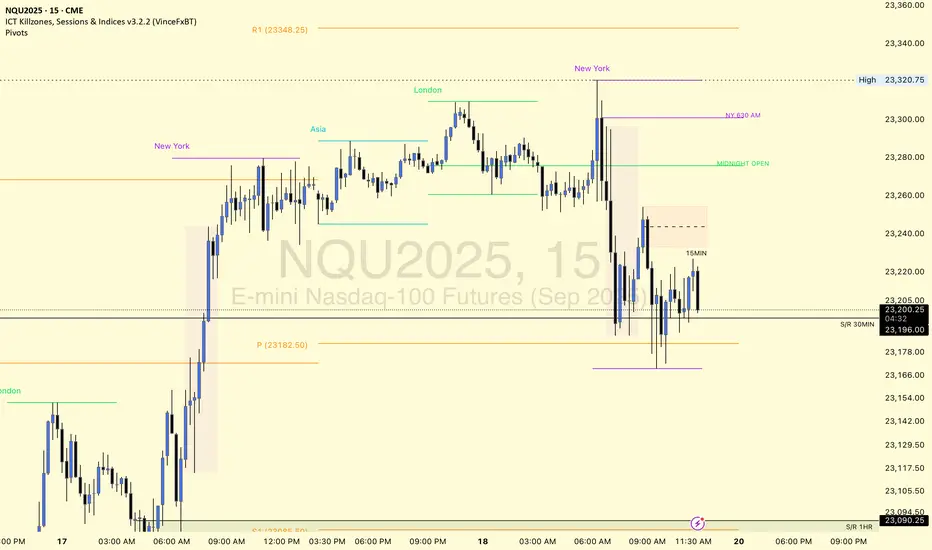
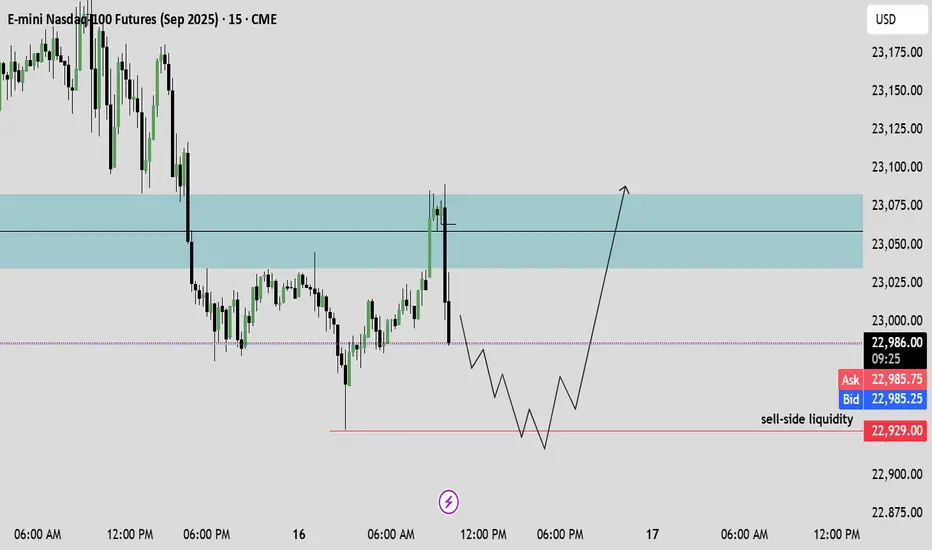
$NQ Supply and Demand Zones 7/18/25 This is for SEED_ALEXDRAYM_SHORTINTEREST2:NQ chart only, not as many supply zones with the limited timeframes I can use for TradingView free plan. This is my chart coming into next week.
However, we have so far found rejection from new ATH and making our way to retest the imbalances and previous resistance-now support levels of past supply zones.
Trade ideas
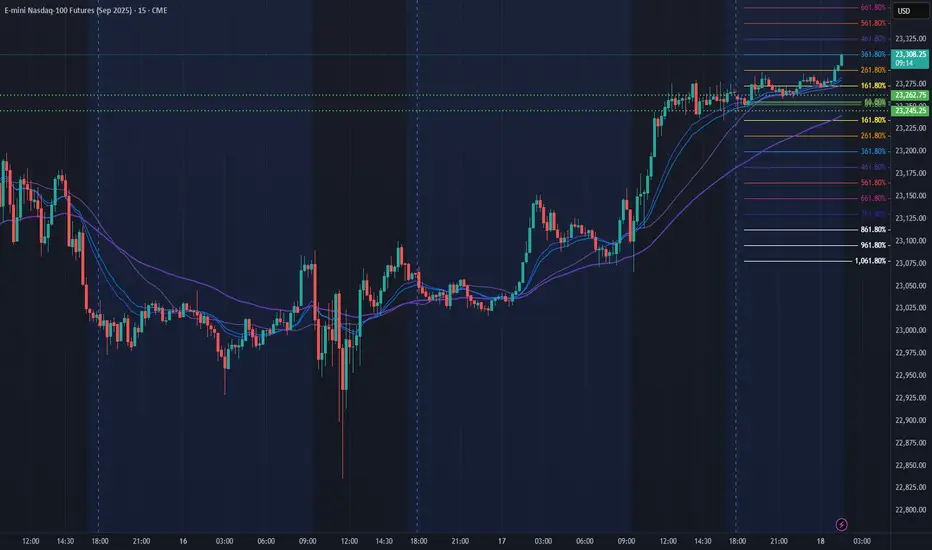
NQ Power Range Report with FIB Ext - 7/18/2025 SessionCME_MINI:NQU2025
- PR High: 23262.75
- PR Low: 23245.25
- NZ Spread: 39.0
No key scheduled economic events
Pushing ATH through overnight hours
Session Open Stats (As of 1:15 AM 7/18)
- Session Open ATR: 272.56
- Volume: 18K
- Open Int: 286K
- Trend Grade: Neutral
- From BA ATH: -0.0% (Rounded)
Key Levels (Rounded - Think of these as ranges)
- Long: 23811
- Mid: 22096
- Short: 20383
Keep in mind this is not speculation or a prediction. Only a report of the Power Range with Fib extensions for target hunting. Do your DD! You determine your risk tolerance. You are fully capable of making your own decisions.
BA: Back Adjusted
BuZ/BeZ: Bull Zone / Bear Zone
NZ: Neutral Zone
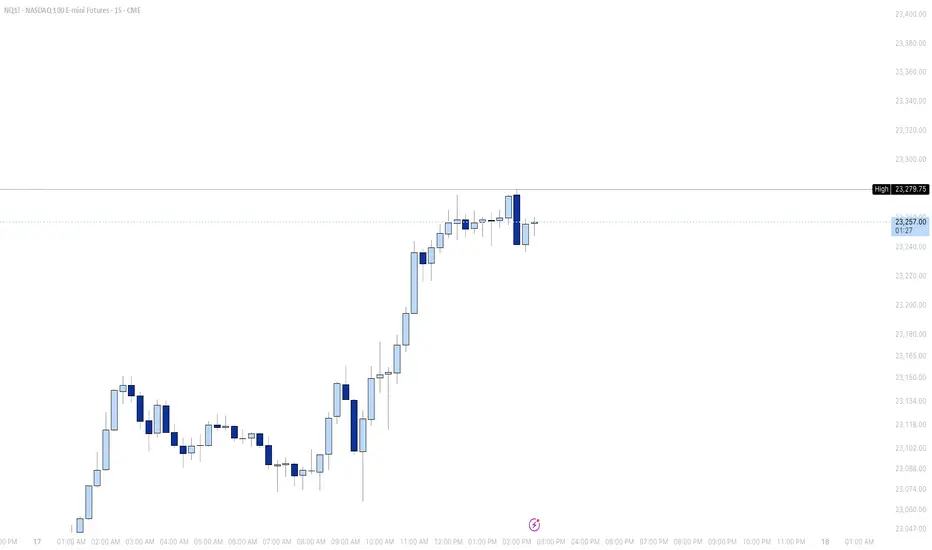
3Up-3Dn NQ Hits New High May PullbackLast night NQ trended up then sideways for the rest of the day. Markets wants to hit new high but may pullback a little bit before going higher. We are still in a Bull Market so small pullback is still healthy.

This is my main template for Futures and ForexThis is my main template for Futures and Forex! It is optimized specially for the strategy "Momentum Mastery".
It includes all the necessary tools and indicators needed for the strat.
All setings are READY!!!
$NQ Supply and Demand Zones - All Time High! 7/17/25This chart is for SEED_ALEXDRAYM_SHORTINTEREST2:NQ only.
We recently hit ATH this AM session and now price is accumulating and we are waiting to see what it wants to do next. Continue to hold support at ATH before we breakout higher, or break below and close below ATH support for a retest lower?

NQ Weekly Recap-Projection 13.07.2025NQ Weekly Recap + Outlook
1️⃣ Recap:
NQ made a new All-Time High, but the breakout ended up being a deviation. Price got rejected and started pulling back.
This signals potential weakness and suggests price may want to explore lower levels.
2️⃣ Bearish Scenario:
📍Target: Daily Swing low (Blue line)
📍Deeper target: Weekly Fair Value Gap (Purple zone)
I’ll look for LTF confirmations around these zones to position for potential longs.
3️⃣ Bullish Catalyst Watch:
There’s increasing speculation that Powell may resign this week.
If that happens, we could see:
✅ Strong bullish momentum
✅ Little to no retracement
✅ Immediate push into new ATHs
Weekly Plan Summary:
🔸 Scenario 1 - Pullback Continuation:
Look for reactive long setups at Daily Swing or W FFVG zone.
🔸 Scenario 2 - Powell Resignation:
Expect a breakout move with momentum — potentially no retrace.
Stay nimble. Trade what the chart confirms, not what the news promises.

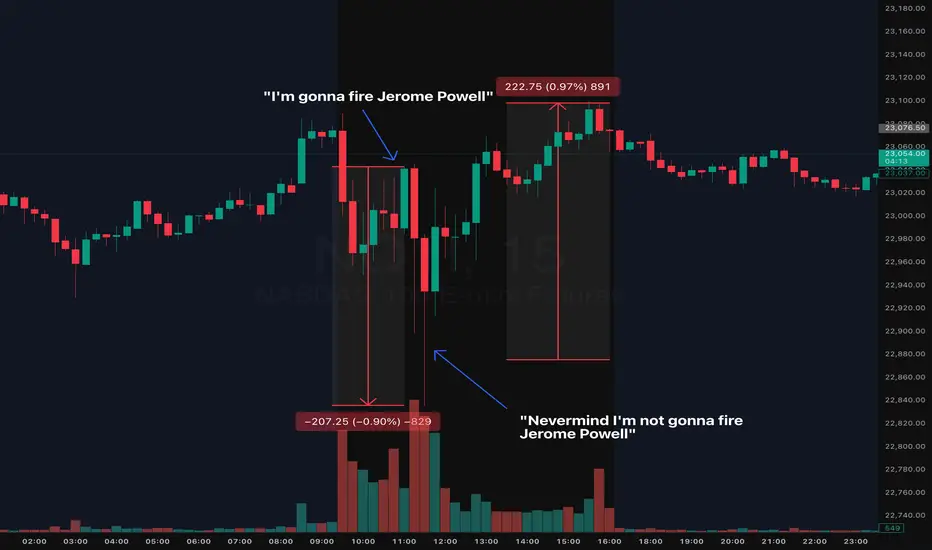
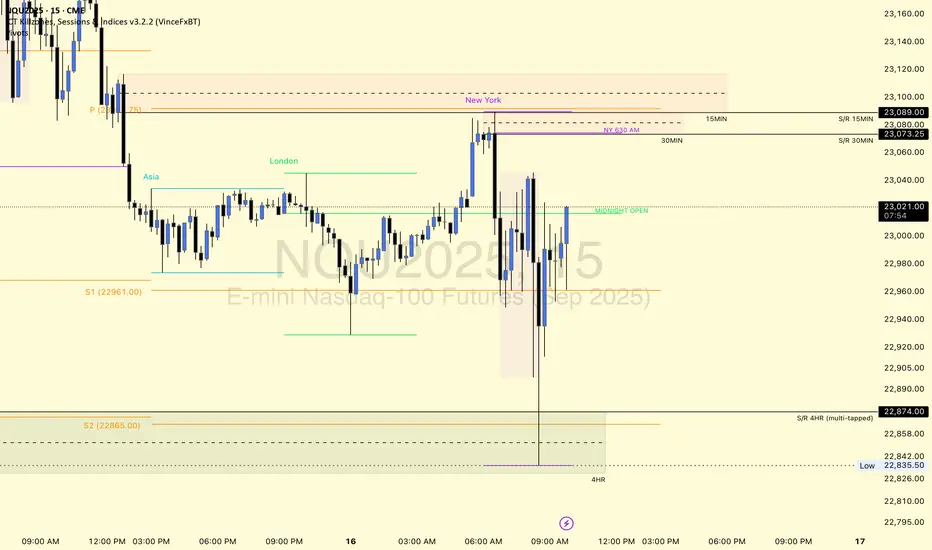
2025 Trading Final Boss: Daily Market Manipulation, The New NormMarking this point in history because we'll likely forget and move on.
During the early hours of the July 16th NYC session, we saw indices quickly flush ( CME_MINI:NQ1! CME_MINI:ES1! ) nearly 1% on the news that Trump will fire Jerome Powell. The dip was bought almost instantly.
Shortly after the dip was bought (roughly 0.50% recovery), guess what? Trump announced, he is "not considering firing Jerome Powell". The dip then recovered and achieved a complete V to finish the day somewhat green. Make what you want of it but always use a stop loss in these tough conditions.
Welcome to 2025 Trading Final Boss
NQ Power Range Report with FIB Ext - 7/17/2025 SessionCME_MINI:NQU2025
- PR High: 23072.00
- PR Low: 23031.25
- NZ Spread: 91.25
Key scheduled economic events:
08:30 | Initial Jobless Claims
- Retail Sales (Core|MoM)
- Philadelphia Fed Manufacturing Index
Session Open Stats (As of 12:35 AM 7/17)
- Session Open ATR: 274.88
- Volume: 18K
- Open Int: 268K
- Trend Grade: Neutral
- From BA ATH: -0.8% (Rounded)
Key Levels (Rounded - Think of these as ranges)
- Long: 23239
- Mid: 21525
- Short: 20383
Keep in mind this is not speculation or a prediction. Only a report of the Power Range with Fib extensions for target hunting. Do your DD! You determine your risk tolerance. You are fully capable of making your own decisions.
BA: Back Adjusted
BuZ/BeZ: Bull Zone / Bear Zone
NZ: Neutral Zone
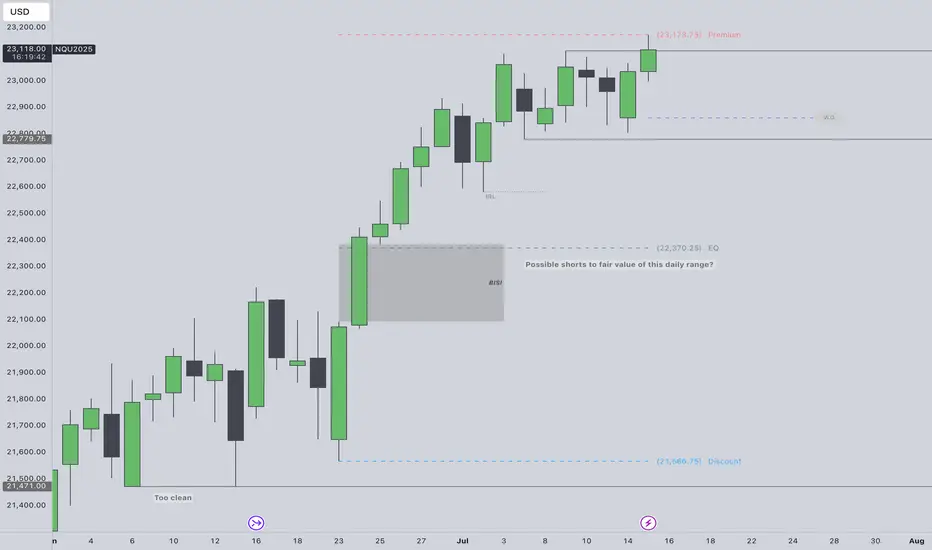
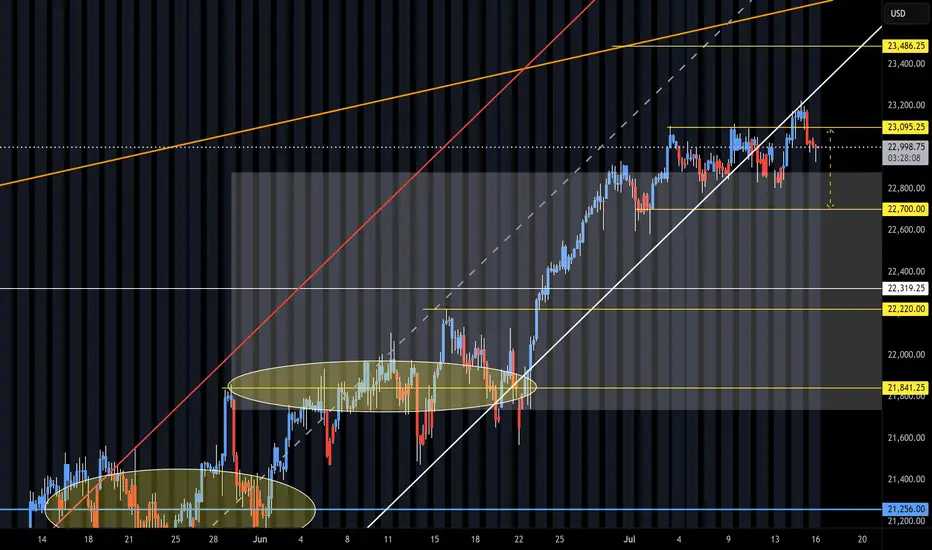
To fade all time highs or not?Not trying to fade ATH run but the SSL in this daily range looks too obvious to me. Super premium.
Price was in a consolidation July 7th - 14th. Took external range high today. I really could see shorts playing out if theres a intraweek reversal confirmed after purging the ERH.
Would need to see 1h CISD confirm intraweek reversal to the downside then trade the daily continuation lower targeting 22,779, 22,578 & EQ of the range at 22,370. Also, the daily BISI that needs sellside delivery.
CPI scheduled this week. PPI following.
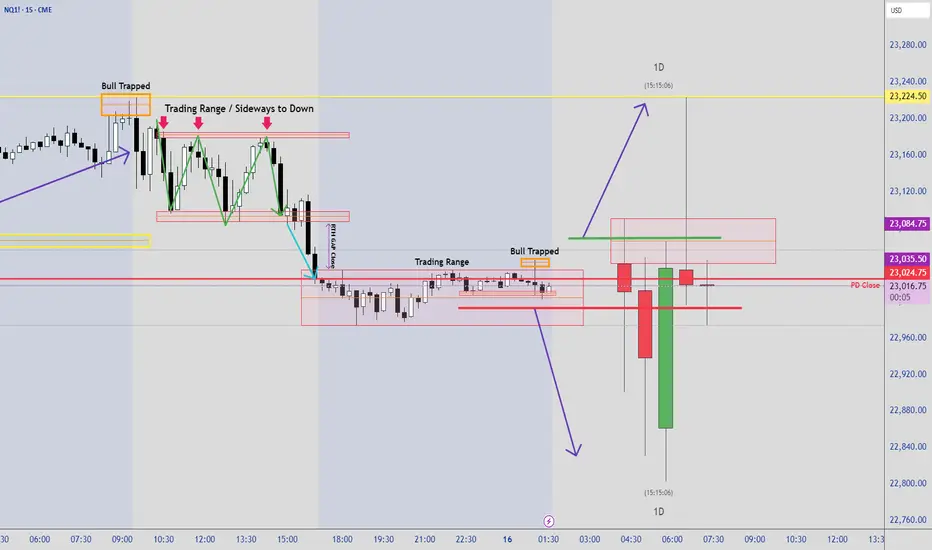
2025-07-16 - priceactiontds - daily update - nasdaqcomment: Bond markets are going ballistic. Fun times ahead. Technically it’s a trading range under ath and bears are too weak to print any decent bear bar on the daily tf.
current market cycle: bull trend
key levels: 22600 - 23300
bull case: Bulls are might fine. No daily bar is closing on it’s low and we are printing bull bar after bull bar. Daily 20ema is around 22700 and as long as we stay above, bulls remain in full control. Not event imminent firing of JPow and the bond market implosion are stopping this. Truly astonishing.
Invalidation is below 22700.
bear case: Bears are pathetic. Need lower lows below 22770. That’s it. Even if we get them, daily 20ema should be support unless an event triggers big time.
Invalidation is above 23300.
short term: Neutral. Bears barely doing anything but I have no interest in buying this frenzy, given the risks we are facing. We will go down hard soon but right now nothing about this is bearish. I do think the only bearish scenario could be that Jpow resigns/gets fired tomorrow/Friday and we drop down hard to next big support around 22000. I’d be surprised if we could get that low tbh.
medium-long term - Update from 2024-06-29: No change in plans. I expect 20000 to get hit over the next 3 months and maybe 19000 again.
trade of the day: Short US open was my preferred trade today but stop had to be 23223, so far away and target was not all that big since 23000 was the obvious support. The drop down to 22835 was a bit much but given the news, it could have easily led to a much bigger sell-off if the markets weren’t ignoring literally every risk under the sun.
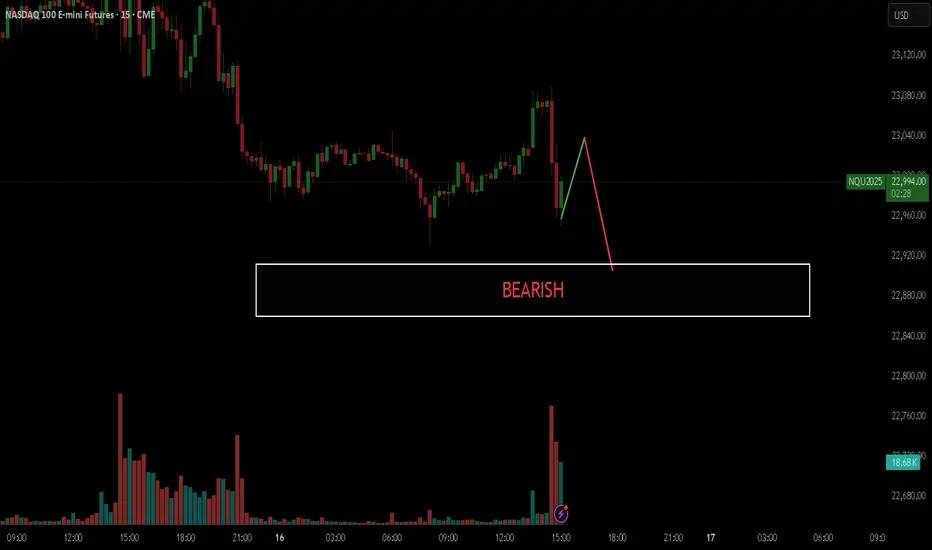
Shorting NQ Yep, weakness started to creep in on NQ this time.
Firstly, the higher timeframes shows massive divergence, even when whales tried to push the price high and continue the trend, massive shorts came in with massive volume. It only tells me that bears are in control this time, and they are coming in with force.
So technically, iam looking for a short up until 22,858
What is really confusing is that also gold is showing weakness which is really something odd, so either iam right in my analysis for Gold and NQ or iam wrong in one of them.
But we will see.

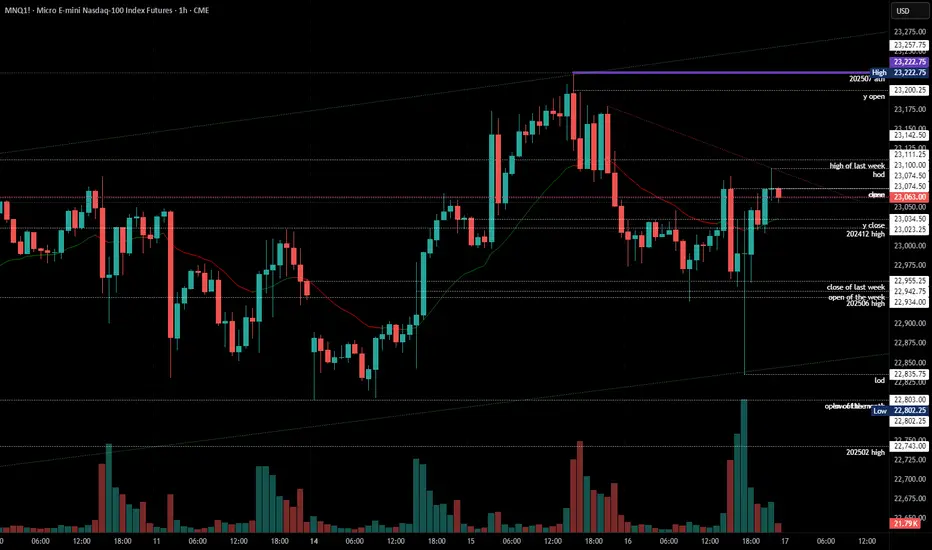
NQ Short (07-16-25)NAZ again can't hold on the Monday off session pump during the Reg Session and does hit lower zone of 22,920. Next trick is Gov't controlled news (released in off session of course) should that not lift it then KL's 881-780 may be next.
The NAZ will go lower under 780 and will be a Strong Short under 22,700. The issue is with getting past the off session propping/rigging (up). Circles to the left are drop target zones that are likely to be revisited as ultimately the NAZ goes sideways in a larger range. The current 14 day sideways moves feels like an Long Mop up or Long Trap. The NAZ will need Tweets, O/N Prop moves and Dead Zone magic lifting to stay away from the Danger Zone of sell orders near 22,881-780.
$NQ Supply and Demand Zones 7/16/25This is for SEED_ALEXDRAYM_SHORTINTEREST2:NQ chart specifically.
Posting for the YouTube fam and to hold myself accountable.
We broke through many demand zones after failing to break newer highs and the 2 news releases.
MNQ Analysis with three successful tradesAs NQ keeps hitting ATH and the bulls are in total control, I do my analysis and share my thoughts.

NASDAQ Trade setupWill wait for NQ to sweep the swing low and then look for longs from there, We might also see SMT with ES around these zones.
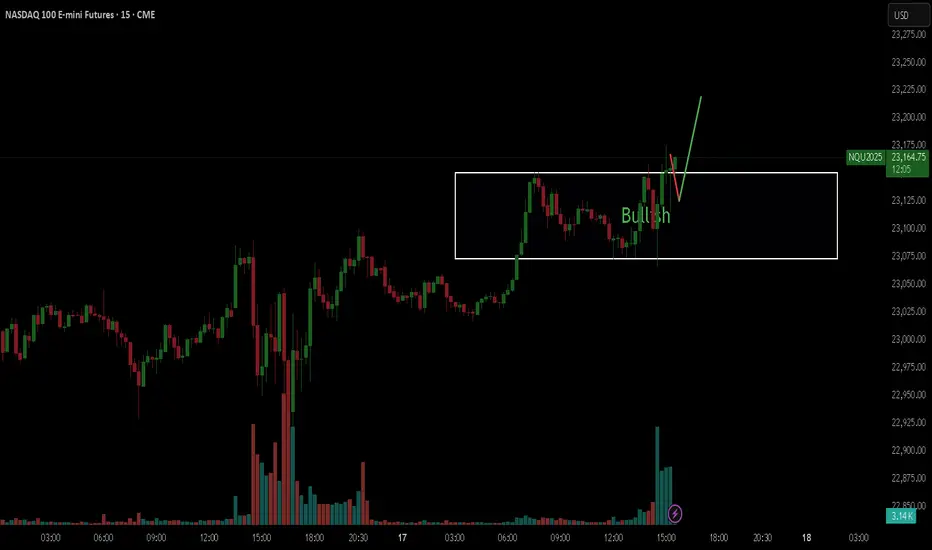
NQ - Long Scalp/SwingYo everyone. Here is what I'm seeing for NWQ today. I'm very bullish because of market structure.
Confirmations:
Bullish 1HR Break of Structure
Intermediate Lows holding
Multiple Bullish FVGs
We may not get an entry lower but we ARE going up.
Happy trading!

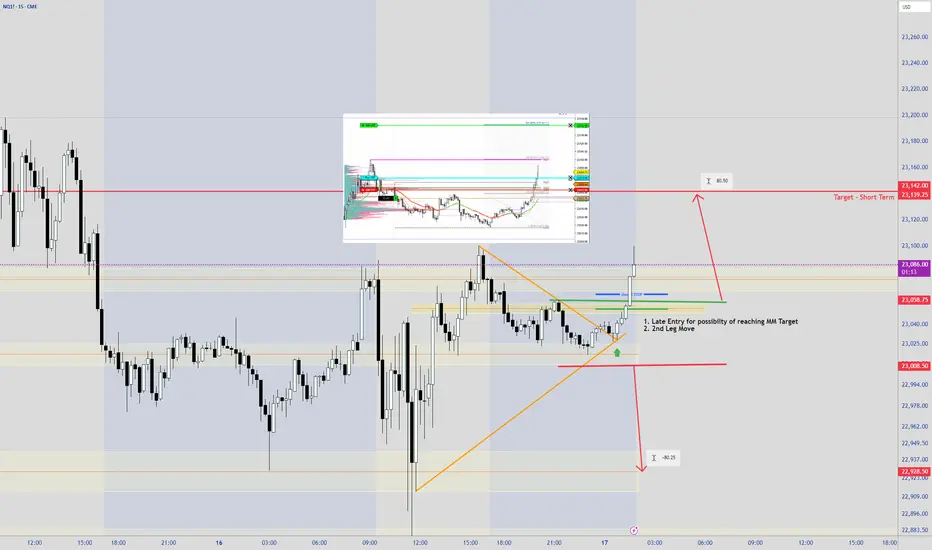
2nd Leg Down Likely on the DailyNews impact yesterday pushes the market higher only to reverse throughout the day. A retest of swing low is expected for a bearish continuation. With another news coming, perhaps a minor pullback then chop and drop.
NQ Power Range Report with FIB Ext - 7/16/2025 SessionCME_MINI:NQU2025
- PR High: 23034.25
- PR Low: 22973.75
- NZ Spread: 135.5
Key scheduled economic events:
08:30 | PPI
10:30 | Crude Oil Inventories
AMP margins raised overnight for expected PPI volatility
Session Open Stats (As of 12:25 AM 7/16)
- Session Open ATR: 277.22
- Volume: 27K
- Open Int: 277K
- Trend Grade: Neutral
- From BA ATH: -0.8% (Rounded)
Key Levels (Rounded - Think of these as ranges)
- Long: 23239
- Mid: 21525
- Short: 20383
Keep in mind this is not speculation or a prediction. Only a report of the Power Range with Fib extensions for target hunting. Do your DD! You determine your risk tolerance. You are fully capable of making your own decisions.
BA: Back Adjusted
BuZ/BeZ: Bull Zone / Bear Zone
NZ: Neutral Zone
DIYWallSt Trade Journal: Perfect Morning Signals & Rate Cut bets07/15/25 Trade Journal, and ES_F Stock Market analysis
EOD accountability report: +404.50
Sleep: 7 hours
Overall health: Good
VX Algo System Signals from (9:30am to 2pm)
— 8:41 AM Market Structure flipped bullish on VX Algo X3!
— 9:33 AM VXAlgo ES X1 Sell Signal (triple sell)
— 9:40 AM Market Structure flipped bearish on VX Algo X3!
— 1:20 PM VXAlgo ES X1 Buy signal (triple buy)
What’s are some news or takeaway from today? and What major news or event impacted the market today?
We got great signals at the start of the day and that really helped with today's trading. I had some meetings today and stufff to take care of so i decided to lock out the funded account around noon and called a day.
News
— 9:54 AM
*TRADERS STICK TO BETS ON SEPTEMBER FED RATE CUT AFTER INFLATION REPORT
What are the critical support levels to watch?
--> Above 6295= Bullish, Under 6285= Bearish
Video Recaps -->https://www.tradingview.com/u/WallSt007/#published-charts

NQ Short (07-14-25)The NAZ appears to be due for a Drop Test back inside the lower range. F-M Long play and O/N lift moves seem to be loosing their effectiveness. Looking for a 22,300-200 target on drop and if not, look for U Turn under 23,300.
