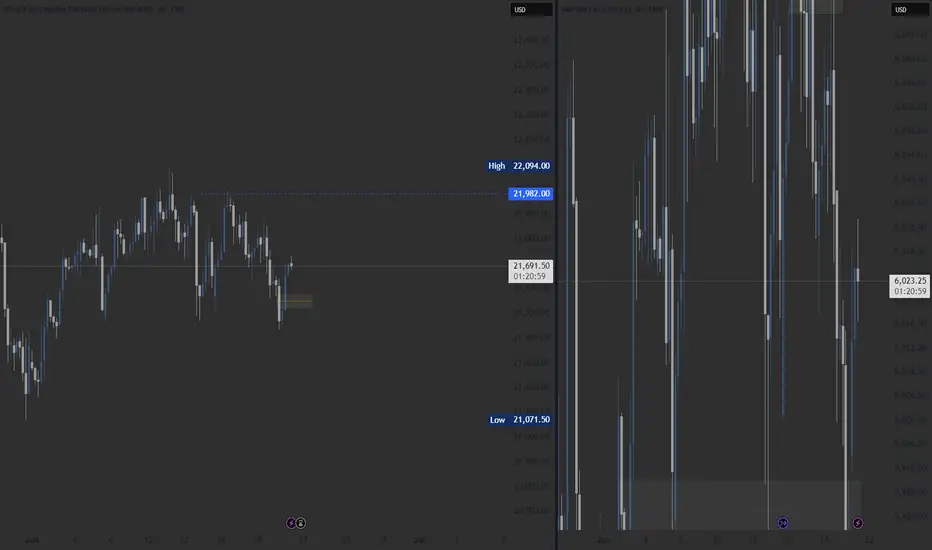
NQ Update 6.22.25NQ is currently sitting monthly and weekly supply zones.
On the weekly chart, price has consolidated upward but has mostly rejected every push into ATHs.
Note that there are still two untested highs with volumes of 2.336M and 3.392M sitting above. The last time price touched these points there was a 26.60% drawdown on SPY. Indicating lots of liquidity that could still be tapped before making a big move down, IF price decides to drop from here.
In addition to these bearish indicators, price is testing a monthly and weekly downtrend line while creating a head n shoulders pattern. Which could also be signaling a rejection of price.
Despite what I am seeing, I will treat price as if it is still bullish until market structure indicates otherwise.
On the daily timeframe, price can be seen to be clearing trending into a rising wedge. This chart pattern is known to be a bearish pattern but it can also signal a breakout continuation which is why it is important to wait for confirmation and never assume direction.
With price holding and sitting at the uptrend and downtrend on the LTFs, as well as 21,816 being a key area that price seems to be consolidated around. I will wait for price to break consolidation and choose a side before placing any trade on NQ.
If you MUST place a trade, do not place a trade until price moves above or below 21,922 and 21,775, respectively.
Trade ideas

#202525 - priceactiontds - weekly update - nasdaq e-mini futuresGood Day and I hope you are well.
comment: Full bear mode. Below 21600 we see 21000 come real fast and bulls can kiss 22000+ goodbye for months or years. Market has not found enough buyers above 22000 for a month and we not got another potential huge risk-off event which will likely be too much for big institutions to ignore. Print above 22000/22100 means I am wrong.
Last week my bearish thesis was that we go down from last Friday but since market did not touch the daily ema for so long, we got another week sideways. Now bears got help from orange face and I can not see them coming back from this as well.
current market cycle: trading range - daily close below 21500 confirms my thesis
key levels for next week: 20900 - 21800
bull case: Still no close below daily ema but markets failed to print higher highs for 2 weeks now. If we gap down and print below 21500, you can not hold long on hope. Got nothing for the bulls unless they print above 22000 again and even then we can only expect sideways.
Invalidation is below 21500
bear case: I have laid out my bear case for the markets enough by now. I see a move below 21500 as confirmation and especially a daily close below. 21000 is the next obvious target before we can expect a pullback. 20400ish would be my next target below since that is the big bull gap close.
Invalidation is above 22000/22100
short term: Full bear mode. Expecting a big futures gap down on open and a daily close below 21500 if not 21000, which would mean we are in W1 which could be a spike and then only move sideways before W3 comes around. I have drawn a probably path down over the next weeks.
medium-long term - Update from 2024-06-22: Daily close below 21500 is my validation for the new bear trend which has the first bigger target at 21000 but I think we will printed below 20000 again this year. Structure is obviously not yet bearish, so don’t be early if you want confirmation and can’t/won’t scale in to shorts higher. Getting into longer term shorts above 21500 seems like the banger trade right now.

NQ: 207th trading session - recapPretty good end to a week. I'm completely focused on scalping for the next week.
I will be having my session everyday exepct wednesday: Schools just too long and I gotta stop skipping class or else my p.e teacher will actually catch on to it

Automated Execution: TradingView Alerts → Tradovate using AWS LaI’ve built a fully automated pipeline that takes live TradingView alerts and turns them into real orders in Tradovate. Here’s how it works, step by step (I will provide a video on it):
PineScript Alerts
My indicator/strategy in TradingView fires alert() with a JSON payload (symbol, side, qty, price, ATR, ENV).
Webhook to AWS
Alerts hit an API Gateway endpoint in AWS, invoking a Lambda function.
Lambda Processing
Parse the JSON from TradingView.
Calculate Stop‐Loss & Take‐Profit using ATR.
Authenticate to the Tradovate API (demo & live environments).
Place an OCO order (placeOSO) with proper bracket legs.
Send a confirmation message to my Telegram channel.
Tradovate REST API
Auth: POST /auth/accesstokenrequest → accessToken
List accounts: GET /account/list → find accountId
Place OCO: POST /order/placeOSO with entry, SL, TP
Testing & Monitoring
Local smoke tests of Telegram bot.
Lambda console test events for sample payloads.
CloudWatch logs for debugging & alerts on errors.
Why it matters:
Zero manual steps from signal to fill.
Consistent risk management via ATR‐based SL/TP.
Clear audit trail: logs in AWS + Telegram notifications.
Educational resource for anyone building similar setups
Feel free to ask questions or suggest improvements! Please leave comments.

NQ 23/06/2025 BIASHERE IS MY SIMPLE IDEA ABOUT NQ FOR THE NEXT WEEK
everything is clear as the snapshot says

trade idea took 3 trade one got trilled in profit the second one was trilled in stop loss the third one hit the full tp.

NQ- HTFOn 4 H, we have an inverse and BPR reaction from 4 H order block.
And we have LRRLon 4 H, My target on HTH will be 21996
NQ Power Range Report with FIB Ext - 6/20/2025 SessionCME_MINI:NQU2025
- PR High: 21930.25
- PR Low: 21745.75
- NZ Spread: 412.0
Key scheduled economic events:
08:30 | Philadelphia Fed Manufacturing Index
Session Open Stats (As of 1:05 AM 6/20)
- Session Open ATR: 377.21
- Volume: 155K
- Open Int: 230K
- Trend Grade: Neutral
- From BA ATH: -4.2% (Rounded)
Key Levels (Rounded - Think of these as ranges)
- Long: 22096
- Mid: 20383
- Short: 19246
Keep in mind this is not speculation or a prediction. Only a report of the Power Range with Fib extensions for target hunting. Do your DD! You determine your risk tolerance. You are fully capable of making your own decisions.
BA: Back Adjusted
BuZ/BeZ: Bull Zone / Bear Zone
NZ: Neutral Zone

NQ POSSIBLE DIRECTION.Waiting for your kindfull thoughts or ideas regarding to my analysis.
NASDAQ...

High volume nodesprice bouncing between until we will see a push out of value to a new level, high or low, we will see

NQ2025 – Clean Liquidity Sweep & OB Rejection Leads to Trend ConDescription (for the Idea post):
NASDAQ Futures (NQ2025) - June 19th Setup Breakdown
Market showed textbook Smart Money behavior today.
🔹 Key Highlights:
Price swept the Saturday Low and Wednesday Low, triggering sell-side liquidity.
Reaction from an old Order Block + Fair Value Gap (FVG) zone near 21,780.
Market Structure Break confirmed the bearish bias.
Retest of OB/FVG zone provided a clean low-risk entry.
Targets were cleanly delivered into 21,678 and beyond.
🔹 Confluences:
✅ Liquidity Sweep
✅ OB + FVG Rejection
✅ Volume Spike & BOS
✅ Trend aligned with overall bearish bias
📌 Plan Going Forward:
I’m watching for retracements to prior support-turned-resistance (21,740–21,780) for potential continuation plays. Will stay bearish unless a CHoCH above 21,800 with volume and bullish structure forms.
Comment below with how you traded this setup or how you're managing it!

NQ ShortLook for NQ shorts only after a 4 hour high is taken, as we look for the weekly candle to expand lower. As this week is the 3rd candle in the swing formation

Trade Idea: Nasdaq Q2 Premium Rejection | Mother of HTFNQ is showing early signs of macro exhaustion after rallying deep into Q2 premium territory and failing to hold above it. A key swing high was formed on June 13, in perfect confluence with:
🔻 Q2 0.75 level
🟥 Quarterly Premium Zone
📉 Bond market divergence (ZB1! failed to confirm ZF1!/ZN1! strength)
🗣️ (Not a bond expert, just observing behavior)
This type of confluence has historically preceded liquidity draws back to EQ or even discount levels.
📐 Levels I’m Watching
Q1 Mid (~20,975): Strong magnet if we break lower
Q2 EQ (~19,975): Next likely draw if structure shifts
MOOD (~21,460): Holding above this pauses deeper sell bias
Q2 Premium Zone (22,300–22,500): Rejection zone and CPI swing high (June 11-13)
Discount Block (18,300–17,500): Long-term liquidity void if momentum builds
❌ Invalidation
NQ reclaims and holds above 22,300–22,500
⚠️ Disclaimer
This is NOT financial advice. All content shared is speculative and intended for educational or entertainment purposes only. Futures trading carries significant risk and may not be suitable for all investors. Always do your own research and consult with a licensed financial professional before making trading decisions.


NQ: 206th trading session - recapOk session, hopes were high at the beginning but it was a bit short lived.
Don't got much to say tho, til tomorrow

NAS/NQ 4H Buy IdeaLooking for price to break and retest the current high to continue higher
OR
Looking for price to go back and fill the imbalance left below current price to then continue higher

NQ1 wait in the zone for long*The content on this analysis is subject to change at any time without notice, and is provided for the sole purpose of assisting traders to make independent investment decisions.

FED Day: NQ Futures planCME_MINI:NQ1!
Today is FOMC day; however, there is a larger geopolitical risk looming, along with the trade war and tariffs situation unfolding.
Recently, we have noted inflation moving lower, although it is not yet at the FED’s 2% target. Retail sales fell sharply last month. Tariffs have not yet resulted in inflation so far, partly due to the 90-day pause, and with possible extensions, some deals agreed upon, and a framework for others in place, tariff uncertainty has considerably reduced.
On the contrary, lower energy prices that supported lower inflation have risen due to ongoing geopolitical issues. Risks remain high for elevated energy prices even if supply and sea routes remain unharmed. In our view, this is due to the fragility of the situation and what it would take to turn the ongoing war into the worst possible outcome.
The FED releases their Summary of Economic Projections. Key data points will be inflation and growth projections, along with interest rate projections and any talks about neutral rates and expected cuts, given the bleak global outlook and growth. The FED is otherwise expected to hold rates steady in this meeting.
Given this, and what Chair Powell says in the FOMC press conference, their commitment towards driving inflation lower versus maximum employment, risks on the growth and employment side have started to worsen. If rate cut bets are moved forward or if markets price in more rate cuts than currently priced in, we may see equity index futures make further gains.
NQ futures are coiling; the yearly VPOC has shifted higher, as we explained in our previous analysis.
Today’s meeting may be key for further fuel higher or lower, depending on how it pans out. Market participants are in a wait and see mode. Markets are accepting higher prices and break of balance is key to determine the direction price may be headed in. Until otherwise proven, markets are range bound and mean reverting from June Composite Volume Profile towards monthly VWAP and VPOC.

NQ Power Range Report with FIB Ext - 6/18/2025 SessionCME_MINI:NQU2025
- PR High: 21940.50
- PR Low: 21863.00
- NZ Spread: 173.50
Key scheduled economic events:
08:30 | Initial Jobless Claims
10:30 | Crude Oil Inventories
14:00 | FOMC Economic Projections
- FOMC Statement
- Fed Interest Rate Decision
14:30 | FOMC Press Conference
AMP margins increase to 25% for expected FOMC volatility spike
Session Open Stats (As of 12:45 AM 6/18)
- Session Open ATR: 375.35
- Volume: 31K
- Open Int: 213K
- Trend Grade: Neutral
- From BA ATH: -3.8% (Rounded)
Key Levels (Rounded - Think of these as ranges)
- Long: 22096
- Mid: 20383
- Short: 19246
Keep in mind this is not speculation or a prediction. Only a report of the Power Range with Fib extensions for target hunting. Do your DD! You determine your risk tolerance. You are fully capable of making your own decisions.
BA: Back Adjusted
BuZ/BeZ: Bull Zone / Bear Zone
NZ: Neutral Zone

NQ Bulls Teasing a Breakout – But Watch That 4H RSI Divergence We’re at a decision point here on NQ.
📌 Bullish case: We’ve got a clean inverse H&S on the 5-min sitting right on the weekly pivot. If we reclaim the daily pivot and the 30-min VWAP (red line), we could get a squeeze toward 21,960, where prior supply sits.
📉 Bearish case: A break below 21,650 cracks the head and confirms downside toward 21,480.
⚠️ Don’t ignore that 4H RSI divergence. Momentum is fading. If buyers want this, they’ve got to show up now.
📊 Timeframes used:
4H: macro momentum divergence
30M: chop zone with directional potential
5M: inverse H&S near key support
1M: low timeframe momentum shift
🔭 Scenarios plotted for both directions. Choose your trigger.
#nasdaq #futures #MNQ #tradingstrategy #priceaction #headandshoulders #vwap

NQ Range (06-13-25)Update to prior Post and Short Call at 22,040. NAZ did drop 700 points of the 1,000 expected. Balance of drop to watch for in Reg Session or the typical F-M Long Play is on deck.

2025-06-17 - priceactiontds - daily update - nasdaq
Good Evening and I hope you are well.
comment: Big up, big down, big confusion. Market rallies 500 points yesterday and today we get a late bear breakout and close below 22000. Traps on both sides and I am not believing in bear strength what so ever. I see this as a triangle and 22000 is the middle. Chop chop.
current market cycle: trading range
key levels: 21700 - 22300
bull case: Bulls want to stay above 21900 and print a higher low to then re-test 22300. Today they were weak and let the bears close below 22000 which was unexpected, giving yesterday’s bullishness. Tomorrow we have FOMC and I doubt market can move far from 22000 tomorrow. Any longs closer to 21800 make sense.
Invalidation is below 21680.
bear case: Bears left behind a gap up to 22015 but I doubt it can stay open. We have to decent trend lines below us and bears would need to break strongly below 21900 to try and go for 800 or even 700. Bears do not have any arguments to go below 21700 so I won’t make up any. That doesn’t mean it can not happen but it’s unlikely.
Invalidation is above 22230.
short term: Completely neutral around 22000. Only interested in longs below 21900 and shorts closer to 22100.
medium-long term - Update from 2024-06-15: Daily close below 21450 is my validation for the new bear trend which has the first bigger target at 21000 but I think we will printed below 20000 again this year. Structure is obviously not yet bearish, so don’t be early if you want confirmation and can’t/won’t scale in to shorts higher.
trade of the day: Buy low, sell high and scalp. Clear range 22000 - 22100 and the late bear breakout was ok if you made your money before. I do think it was unusual that we did not close the gap to y close 22176.

NQ: 205th trading session - recapI'm back after a pretty long vacation. Took the time to just rewind myself n sh#t.
Pretty boring session today, but I was locked in the whole t ime so that's a bonus point
