RTY Zigzag Likely to Find Support for Extension to New HighRussell 2000 Futures (RTY) has broken to a new all‑time high, and this confirms that the broader trend remains bullish. The cycle from the April 2025 low continues to advance as an impulse. Wave ((4)) finished at 2300.6, as shown on the 90‑minute chart. From that level, wave ((5)) began to unfold with a clear impulsive structure at a lower degree.
After wave ((4)), the index pushed higher in wave ((i)) to 2396.4. A brief pullback in wave ((ii)) followed and ended at 2370.3. RTY then accelerated in wave ((iii)), reaching 2545.8. A shallow consolidation in wave ((iv)) held at 2516.6. The final leg, wave ((v)), carried the index to 2625, which completed wave 1 at a higher degree. A correction in wave 2 is now in progress. It is retracing the cycle from the November 21 low and is forming a zigzag pattern. From the wave 1 peak, wave ((a)) declined to 2526.2, and wave ((b)) recovered to 2590.30. Wave ((c)) should extend lower toward 2397–2471, which aligns with the 100%–161.8% Fibonacci extension of wave ((a)).
This area should act as support and allow wave 2 to finish. As long as the pivot at 2300.6 holds, buyers are expected to appear in the next 3, 7, or 11 swings, and the broader uptrend should resume.
E-Mini Russell 2000 Index Futures
No trades
Market insights

RTY: Small Caps Stuck Between Growth Optimism & Macro OutlookRTY Overview and Recent Macro Backdrop
RTY, or Russell 2000 futures, track the performance of the Russell 2000 Index, which represents approximately two thousand U.S. small cap companies. These constituents are drawn from the lower end of the Russell 3000 Index and typically reflect firms with smaller market capitalizations, greater domestic revenue exposure, and higher sensitivity to economic conditions than their large cap peers. The primary deciding factor for inclusion in RTY versus the S&P 500 is market capitalization. The Russell 2000 consists of the smallest two thousand companies within the Russell 3000, while the S&P 500 is a committee selected index composed of roughly five hundred large cap companies that must meet additional criteria such as profitability, liquidity, sector balance, and sustained earnings. Although market cap thresholds shift annually, Russell 2000 constituents generally fall well below the market cap range of S&P 500 companies and are reconstituted mechanically each year based on size rankings.
As the market settles into the new year, RTY has been trading within a more nuanced macro environment shaped by early year repositioning and reassessment of economic expectations. Price action over the past month has been increasingly influenced by evolving views on monetary policy, credit conditions, and the durability of U.S. growth. While recent inflation data has shown signs of moderation, it has remained uneven, keeping rate cut expectations fluid rather than fully priced in. This has limited sustained directional momentum in small caps, as higher borrowing costs continue to pressure balance sheets and earnings visibility. At the same time, resilient employment data and stable consumer demand have helped contain downside risk, allowing buyers to engage at value rather than chase extension. The result has been a rotational and range bound market structure, reflecting cautious positioning and a wait and see approach, with RTY acting as a battleground between early year growth optimism and ongoing policy and financing constraints.
What the Market has done
• Market reversed higher and entered an uptrend after concerns surrounding Trump’s liberation day tariffs eased in April 2025.
• In July 2025, the market consolidated and formed bid block 1, which buyers used as a base to drive price higher toward the 2585 area, a key daily resistance established in 2021 and the 2024 yearly high.
• Sellers responded at the 2585 area and offered prices back down toward the 2440 area, aligning with daily support and the 24 Nov weekly HVN.
• Buyers attempted to defend the 2440 area but failed, resulting in a downside auction to the 2320 area, corresponding to the bid block 1 high.
• Buyers defended and initiated at the 2320 area, bidding prices back up to the 2585 area, where sellers remained active.
• Markets have since rotated between the 2585 and 2490 areas.
What to expect in the coming week
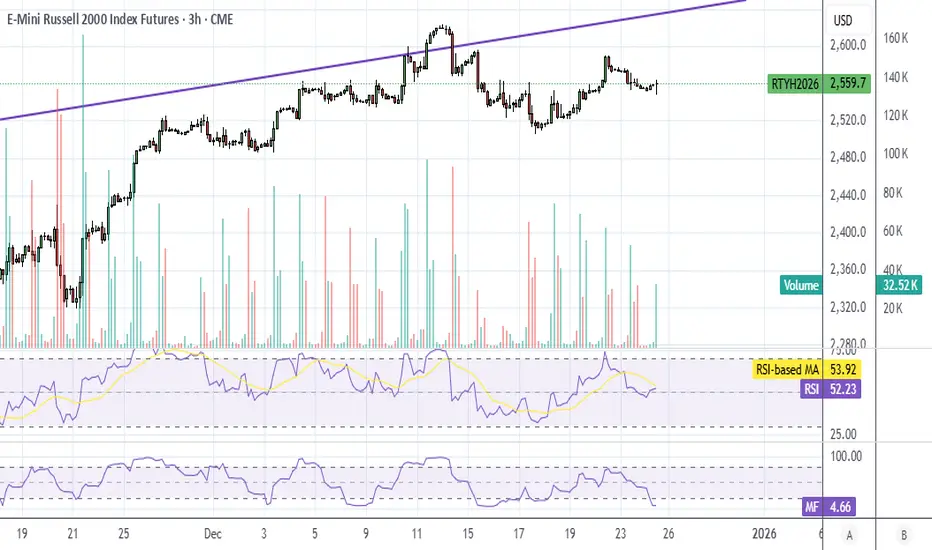
The key level to monitor is the 48650 area, which aligns with the previous week’s VPOC and the 15 December weekly Value Area High
Bullish scenario
• If the market is able to hold above the previous week’s settlement, an initial move toward the 2555 area is expected, which aligns with the 22 Dec weekly VAL, the 3 Dec weekly VAH, and the 0.5 weekly SD high.
• If price is able to accept above the 2555 area, continuation toward the 2585 area becomes likely.
• Sellers are expected to respond around the 2585 area based on prior failed auctions and higher timeframe resistance.
• If sellers fail to gain control, the market could extend higher toward the 2620 area, which marks the 8 Dec weekly high.
Neutral scenario
• In the absence of a major news or data catalyst, the market may continue to auction two ways
• A rotational consolidation between the 2490 and 2555 areas would signal continued balance and acceptance of value within this range.
Bearish scenario
• If buyers are unable to defend and hold the 2490 area, expect a move down toward the 2460 area, which aligns with the 1 weekly SD high.
• Continued selling pressure could cause markets to auction prices further down to the 2440 area, which remains a key daily support and the 24 Nov weekly HVN.
Conclusion
In conclusion, RTY remains in a balanced yet highly responsive state, with higher timeframe reference levels clearly defended and defended by both buyers and sellers. The 2490 area is the line in the sand for the coming week, and traders should remain flexible and responsive to acceptance or rejection around this zone. As always, patience and execution around key levels will matter more than prediction.
If you found this breakdown useful, feel free to give a boost, comment, or share your own levels and scenarios below.
Disclaimer: This is not financial advice. Analysis is for educational purposes only; trade your own plan and manage risk.

That spread....aint buyingNot buying...this spread is absurd...short all the way until the moving averages make sense.

Going Shorttaking a short hoping for a reversion back to the 20ma. way overbought and so far away from the 20ma a good chance to see some profit.


Russell 2000 ~ Breakout Confirmed 3,000 Target On TrackRussell 2000 Technical Update
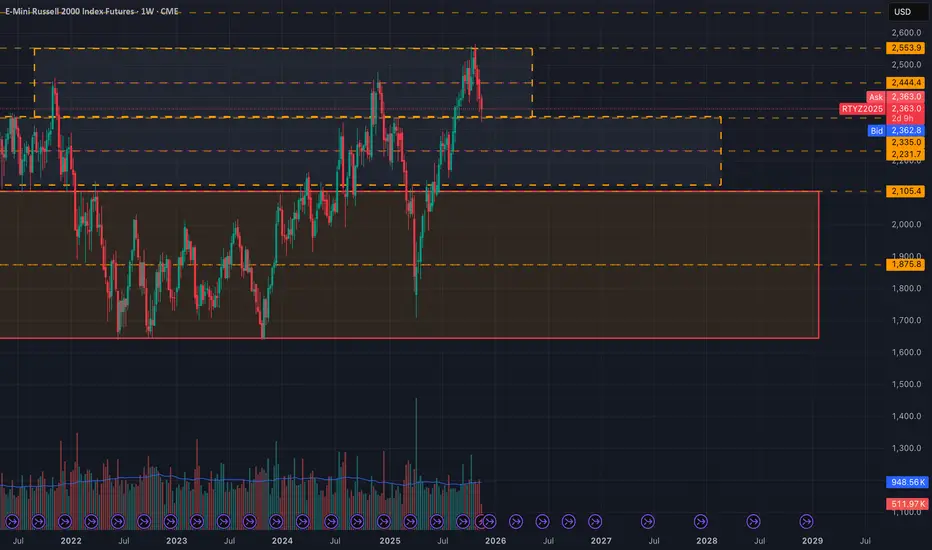
The Russell 2000 breakout from its multi year consolidation remains intact and is now confirmed by multiple monthly closes above former resistance. The anticipated pullback has played out as expected, providing validation of the breakout structure and keeping the measured move toward the 3,000 area firmly in play.
This update reviews what has developed since the original breakout signal and why the next leg higher remains the dominant path.
What Has Developed Since the Breakout
In October, the Russell 2000 recorded a monthly close above the November 2021 highs near the 2,450 area. This marked a confirmed breakout from a five year consolidation range.
At the time, a pullback to retest former resistance as support was expected. That scenario unfolded precisely.
Price retraced into the 2,280 to 2,350 zone, aligning with the 0.5 to 0.618 Fibonacci retracement levels. Buyers stepped in at support, and November closed back above the breakout level. December has continued to hold above this zone, reinforcing the validity of the move.
Two consecutive monthly closes above a five year resistance level typically signal institutional participation rather than a short term false breakout.
Current Technical Structure
Breakout Confirmation
Monthly closes remain above former resistance near 2,350. This area now acts as structural support.
Fibonacci Alignment
The pullback tested the 0.236 retracement near 2,280 and held. Price is currently trading above the 0.236 retracement, reinforcing bullish structure.
Trend Conditions
Long term moving averages are rising beneath price. Higher lows continue to form on the monthly timeframe. Volume has expanded on advances, supporting the breakout.
The initial breakout phase is complete. Price is now transitioning into the continuation phase.
Why the 3,000 Target Remains Valid
Measured Move Projection
The five year range spans roughly 1,640 to 2,481. Projecting this range from the breakout level produces an upside target above 3,300.
Conservative Targeting
Using approximately 80 percent of the measured move yields a zone near 3,150. Rounding to 3,000 provides a conservative target that accounts for volatility and market noise.
Fibonacci Extensions
Higher timeframe Fibonacci extensions cluster between 3,200 and 3,300, reinforcing the broader target zone.
From current levels near 2,400, the move to 3,000 represents approximately 25 percent upside.
Review of the November Pullback Entry
The outlined plan called for a pullback into the 2,280 to 2,350 area with invalidation below 2,150.
Price reached 2,282 in November, directly into the projected support zone. Buyers defended the level, price rebounded, and structure remained intact.
Risk to reward at entry was approximately 5 to 7 percent risk for 25 to 30 percent potential upside, producing a favorable asymmetric profile.
Why This Move Is Still Early
Cycle Timing
The breakout occurred recently on a monthly timeframe. Large structural breakouts often take 12 to 18 months to reach measured targets.
Institutional Rotation
Small caps underperformed for several years. Capital rotation into this segment typically unfolds gradually, not in a single move.
Participation Profile
Retail participation remains focused on large cap technology. Breakouts that are not yet widely discussed often offer the best continuation potential.
The breakout is confirmed, but it is not yet fully recognized.
Macro Environment
Interest Rate Outlook
Falling or stabilizing rates tend to favor small caps due to their higher sensitivity to financing costs.
Economic Backdrop
The absence of recession supports domestically focused companies that dominate the Russell 2000.
Valuation Context
Small caps continue to trade at a valuation discount relative to large caps, creating room for multiple expansion.
Technical structure and macro conditions are currently aligned.
Risk On Correlation With Crypto
Historically, sustained Russell 2000 breakouts coincide with improving liquidity conditions. These environments often support digital asset strength.
Bitcoin has already advanced meaningfully since the Russell held its breakout. Continued small cap strength would support a broader risk on regime.
This relationship is contextual rather than predictive and should be monitored rather than assumed.
Positioning Framework
Exposure Options
IWM ETF, RTY futures, or structured options depending on experience and risk tolerance.
Risk Management
A monthly close below 2,280 would weaken the breakout thesis. The 3,000 area remains the primary target, with 3,200 as an extended objective.
Time Horizon
This structure favors a medium to long term outlook rather than short term trading.
Monthly closes carry more weight than daily volatility.
Invalidation Risks
• Monthly close below 2,280
• Macro driven risk off events
• Unexpected policy tightening
• Broad market trend deterioration
If invalidated, losses remain defined and manageable relative to upside potential.
Psychology of Structural Breakouts
Early stages feel uncertain. Confirmation feels uncomfortable. Obvious trends tend to appear near the latter stages of a move.
This breakout is confirmed, but not yet crowded.
Summary
• Five year breakout confirmed with multiple monthly closes
• Support held at the anticipated retracement zone
• Measured move targets 3,000 to 3,200
• Upside approximately 25 to 30 percent from current levels
• Risk remains defined below structural support
The most difficult part of the trade was the breakout itself. The market is now in the follow through phase.
Important Disclaimer
This analysis is for educational purposes only and does not constitute financial advice. All markets involve risk, and technical patterns can fail. Always apply appropriate risk management, conduct independent research, and trade in alignment with your risk tolerance.

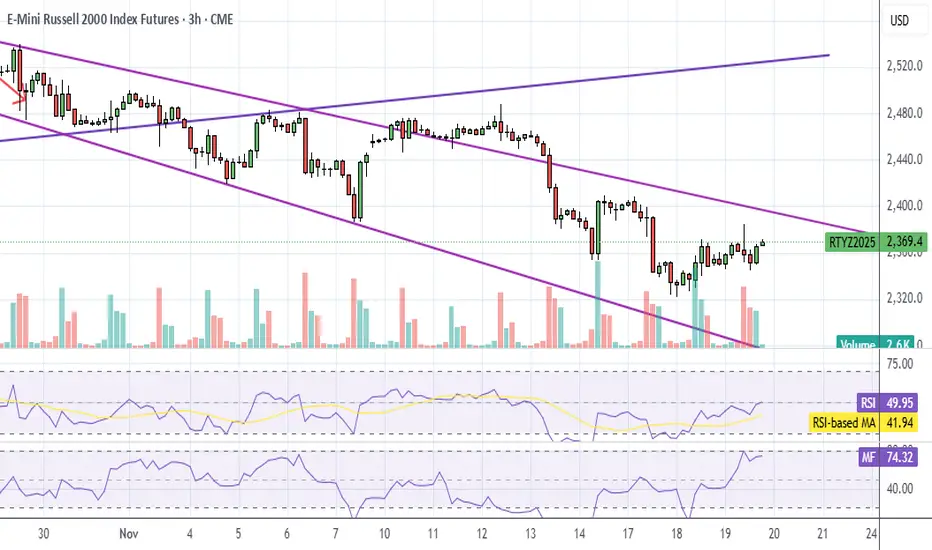
RTY UpdateWell, the inflation pump was fun, but it looks like RTY still wants to go oversold on RSI. That's when we get our next bounce.


RTY UpdateRTY and YM (Dow) are overbought on RSI and MFI, so probably more whipsaw tomorrow, lol.
I looked at it because I was thinking about going long on a retail stock. Looks like I'm too late on that one.
FDAX also hit overbought...

Russell 80% gain in 2026We are headed North. Channel is clear and has no been confirmed. Next stop is north. Do not short. Buy the dip territory all year. Enjoy. Should be a lot of fun.

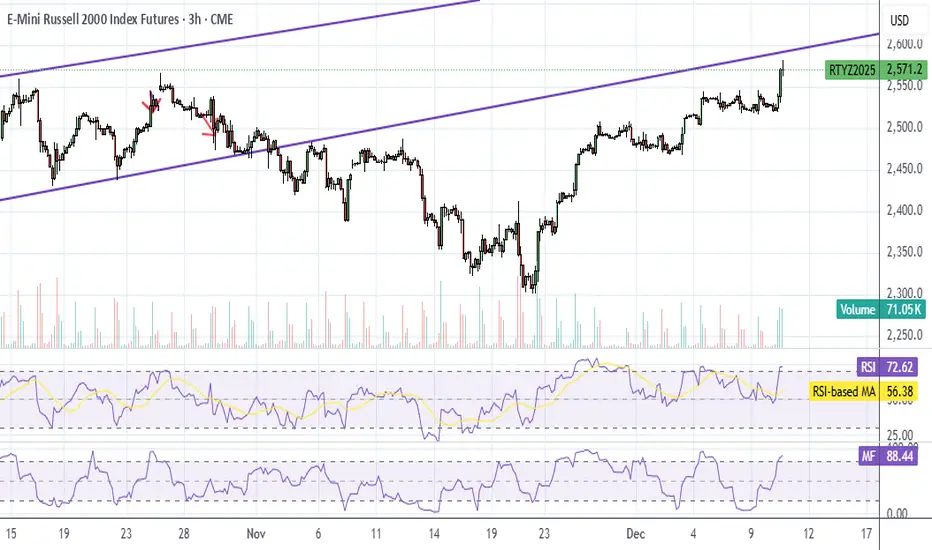
RTY UpdateRTY is overbought on both RSI and MFI but I think it backtests that purple line before dropping.
Expecting a pump tomorrow morning then back to teh whipsaw. See my ES plot./
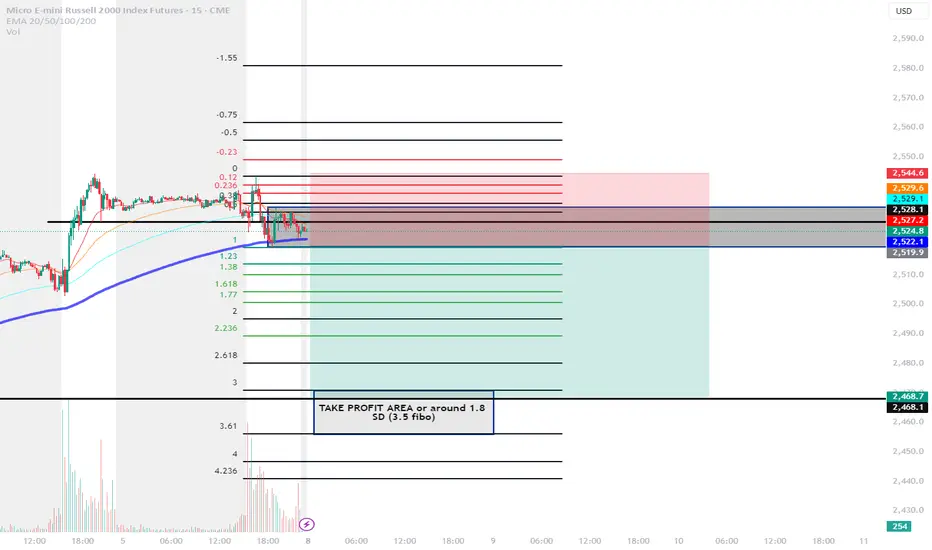
Short RTY, M2K IdeaI believe if we broke the box to the downside. A huge selloff will happen to 1.5 Standard deviation or 3 Fibonacci level drawn from Friday range
RTY Premarket UpdatePosting premarket update because I showed it went oversold yesterday. MFI hit overbought already, don't chase it.

RTY UpdateI said I'd wait until indicators show something before trading, RTY MFI hit oversold before market opened, so I went long today....
but I realized what I should have done is buy IWM call options on open, lol. Next time. RSI is almost overbought, I expect it to go above teh line just like last time.

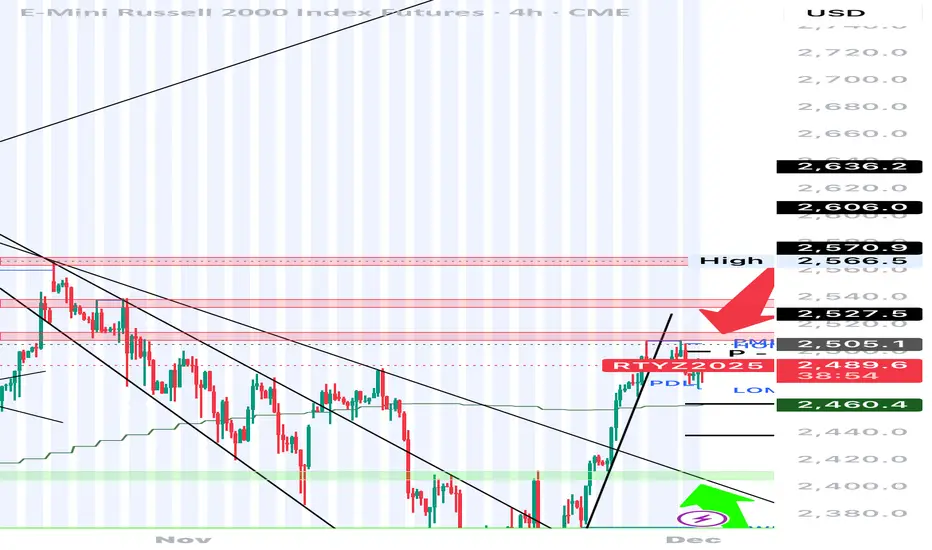
RTY BUY and SELL ZonesSetups i am watching this week
Buy zone - Green arrow (2411-2400) - (swing) confluence for this Green zone
Clean Sweep of 25 - Nov low
Strong support zone in hourly (4h)
TL support
Sell zone - (2520-2510 ) confluence
Clean sweep of PMH,PWH, PDH & 29 Oct High
Resistance Zone
Always enter the Trade after confirmation which is 2B in 30 mts or hourly

RTY - Bull and sell zonesSetups i am watching this week
Buy zone - Green arrow (2411-2400) - (swing) confluence for this Green zone
Clean Sweep of 25 - Nov low
Strong support zone in hourly (4h)
TL support
Sell zone - (2520-2510 ) confluence
Clean sweep of PMH,PWH, PDH & 29 Oct High
Resistance Zone
Always enter the Trade after confirmation which is 2B in 30 mts or hourly

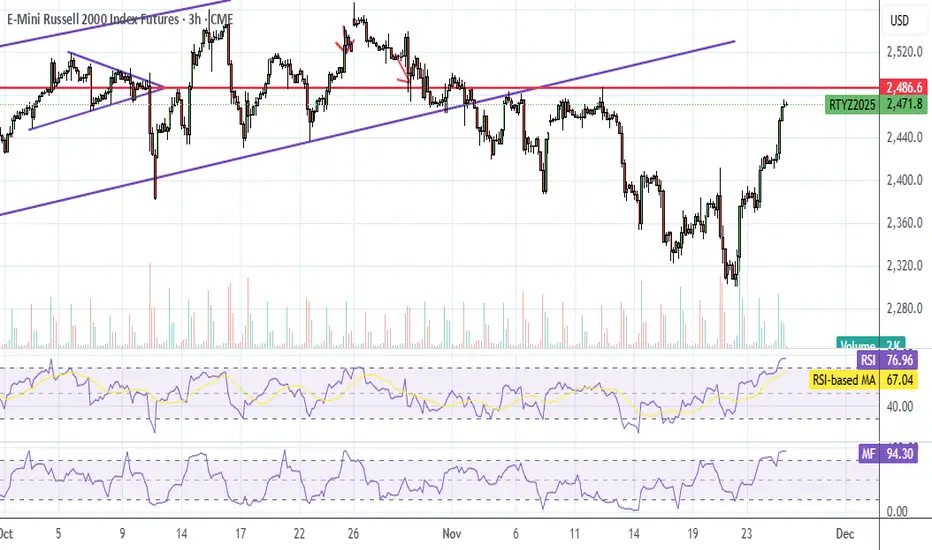
RTY UpdateRSI and MFI actually hit oversold on the daily, so it got the biggest pump of all. Good retail earnings certainly helped today.
In any case, RSI and MFI are both overbought on the 3 hr, expecting a dip here tomorrow. Not gonna short it though.
The way to play it is to wait until MFI goes oversold and buy calls. I'm expecting a melt up.
RTY Open GapRTY left an open gap after the 1 hour break.
That's gonna fill, it's coming back down.
Note: 15 min chart, ignore indicators

RTY UpdateMFI hit overbought already, but they're pumping it anyways on NVDA earnings which really has nothing to do with small caps. Jobs report tomorrow though.
This remains the index to short, but I'll probably wait until Monday.
Analysis for What’s Coming - AI Bubble Sentiment The US markets have been described as “on a rally” for quite some time. I would not agree if it is meant to describe the overall US market, but would agree if it refers specifically to AI or tech stocks. Why?
Among the four major US indices, the Russell—representing a much broader base of US-listed companies—continues to struggle to break above its high from last year, even though the others have far surpassed it. In fact, it has since corrected by 9.5% since its all-time high just last month.
After that, the other indices are also following suit only in the past few days, breaking below this uptrend that started in April.
Micro E-mini Russell 2000 Index
Ticker: M2K
Minimum fluctuation:
0.10 index points = $0.50
Disclaimer:
• What presented here is not a recommendation, please consult your licensed broker.
• Our mission is to create lateral thinking skills for every investor and trader, knowing when to take a calculated risk with market uncertainty and a bolder risk when opportunity arises.
CME Real-time Market Data help identify trading set-ups in real-time and express my market views. If you have futures in your trading portfolio, you can check out on CME Group data plans available that suit your trading needs www.tradingview.com

RTY Box LevelsI've taken some time to chart the Russell 200, and I have to say the box is looking quite excellent.
Nice and clean levels, makes a fella wanna put a bid in.
I am not used to trading this name(literally traded it the first time on Monday), but it seems like a good time so far.
I'll be on the look out for LBAFs and LAAFs, no directional bias just trading what is seen atm.
If a look below and fail occurs and is sustained at the upper box, then it is objectively a long (especially if we trade lower first w/a failure to go lower), otherwise if we trade through the level w/ continuation or trade higher first and fail, then a LAAF would take us within the middle box's range.
Trading higher first and failing is more bearish than trading lower first.
Trading lower first and failing to go lower is more bullish than trading higher first.
I like to keep these concepts in mind as I wait for the opening and initial balance ranges to form intraday, and from there, I can form an opinion and initiate a trade.