XLM About to Wake Up? Bullish Targets Ahead!Stellar (XLM) is starting to look very interesting again after a clean consolidation phase. The chart is showing signs of strength and I expect a bullish continuation in the coming days.
🎯My upside targets:
1. $0.255
2. $0.265
3. $0.275 (main target)
❌Invalidation level:
A close below $0.241 w
Related pairs

XLMUSDT near major trendline breakout and 50% pumpTechnical analysis of XLM reveals a compelling pattern analogy. Historically, the asset demonstrated a decisive breakout above a daily trendline resistance, which preceded approximately 100% appreciation. Currently, XLM is consolidating near a newly formed daily trendline within a broader range-boun

XLM – The bullish trend is stronger than ever! Updating targetsIn my previous XLM idea, I kept raising the invalidation level higher and higher, gradually bringing it closer to the current price. Eventually, that level was broken.
Many would have considered the plan officially invalidated at that point… but the overall bullish structure didn’t break at all. On

Xlm usdt long signal
---
📢 Official Trade Signal – XLM/USDT
📈 Position Type: LONG
💰 Entry Price: 0.24750
---
🎯 Take-Profit Targets (Partial Exits):
TP1 = 0.25136
TP2 = 0.25507
TP3 = 0.25992
TP4 = 0.26435
TP5 = 0.26944
---
🛑 Stop-Loss: 0.24145
📊 Timeframe: 15m
⚖️ Risk/Reward Ratio: 3.61
💥 Suggested Leverage:

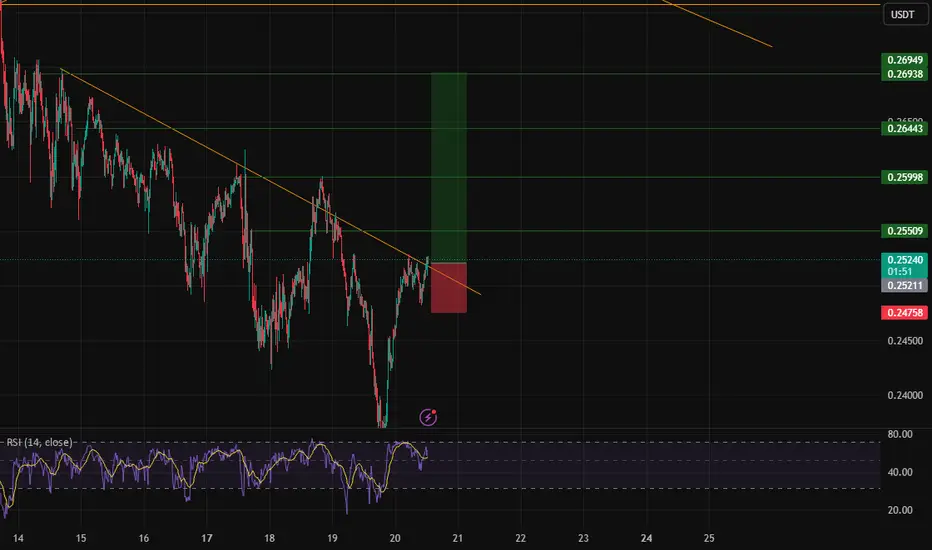
XLM USDT LONG SIGNALSir📢 Signal
🔹 Currency pair:XLM.USDT
📉 Trade type:long
💰 Entry point:. Market
🎯 Targets (with withdrawal management):
▫️ TP1=0.2550
▫️ TP2=0.25998
▫️ TP3 =0.26443
TP4=0.26935
TP5=
TP6=
🛑 Stop loss= 0.24750
📊 Time frame:
⚖️ R/R:3.84
📌 Recommended leverage:.5 or 10
⚠️ Money management is required
XLM USDT LONG SIGNAL---
📢 Trade Signal: XLM/USDT
📈 Position Type: Long
🎯 Entry Price: 0.24980
---
🎯 Take-Profit Targets (Partial Exits)
TP1 = 0.2550
TP2 = 0.25998
TP3 = 0.2692
TP4 = —
TP5 = —
TP6 = —
---
🛑 Stop-Loss: 0.24138
⏱ Timeframe: —
⚖️ Risk/Reward Ratio: 2.44
💥 Suggested Leverage: 5× – 10×
-

XLM USDT LONG SIGNAL---
📢 Trade Idea: XLM/USDT
Type: Long
Entry Zone: 0.25205 – 0.25585
---
🎯 Take-Profit Targets (Partial Exits):
• TP1 = 0.25988
• TP2 = 0.26434
• TP3 = 0.26952
• TP4 = 0.27488
• TP5 = —
• TP6 = —
---
🛑 Stop-Loss: 0.24800
⏱ Timeframe: —
⚖️ R/R Ratio: 2.45
💥 Suggested Leverage: 5×–10×
---

Stellar's(XLM) trajectoryConsidering the price hitting the supply zone (green area) and consuming the orders in that zone along with the reaction it has shown, now if the market also consumes the supply zone (orange area) and breaks through it, we expect the continuation of the upward movement to the next levels. BINANCE:X

XLM/USDT — Rebound from Golden Zone or Continue the Downtrend?The XLM market is regaining attention after revisiting the golden zone at 0.248 – 0.220, an area that has repeatedly served as a strong foundation for buyers in recent months. The price reaction in this zone shows clear signs of sell-side absorption, visible through the emergence of long lower wicks

XLM tries to breakoutXLM is sitting between a wedge and above support line which indicates it could break that trendline and we could see more uptrend

See all ideas
Summarizing what the indicators are suggesting.
Oscillators
Neutral
SellBuy
Strong sellStrong buy
Strong sellSellNeutralBuyStrong buy
Oscillators
Neutral
SellBuy
Strong sellStrong buy
Strong sellSellNeutralBuyStrong buy
Summary
Neutral
SellBuy
Strong sellStrong buy
Strong sellSellNeutralBuyStrong buy
Summary
Neutral
SellBuy
Strong sellStrong buy
Strong sellSellNeutralBuyStrong buy
Summary
Neutral
SellBuy
Strong sellStrong buy
Strong sellSellNeutralBuyStrong buy
Moving Averages
Neutral
SellBuy
Strong sellStrong buy
Strong sellSellNeutralBuyStrong buy
Moving Averages
Neutral
SellBuy
Strong sellStrong buy
Strong sellSellNeutralBuyStrong buy
Displays a symbol's price movements over previous years to identify recurring trends.
Frequently Asked Questions
The current price of Stellar / TetherUS (XLM) is 0.2282 USDT — it has fallen −4.48% in the past 24 hours. Try placing this info into the context by checking out what coins are also gaining and losing at the moment and seeing XLM price chart.
Stellar / TetherUS price has fallen by −4.25% over the last week, its month performance shows a −22.36% decrease, and as for the last year, Stellar / TetherUS has decreased by −56.53%. See more dynamics on XLM price chart.
Keep track of coins' changes with our Crypto Coins Heatmap.
Keep track of coins' changes with our Crypto Coins Heatmap.
Stellar / TetherUS (XLM) reached its highest price on May 16, 2021 — it amounted to 0.7985 USDT. Find more insights on the XLM price chart.
See the list of crypto gainers and choose what best fits your strategy.
See the list of crypto gainers and choose what best fits your strategy.
Stellar / TetherUS (XLM) reached the lowest price of 0.0260 USDT on Mar 13, 2020. View more Stellar / TetherUS dynamics on the price chart.
See the list of crypto losers to find unexpected opportunities.
See the list of crypto losers to find unexpected opportunities.
The safest choice when buying XLM is to go to a well-known crypto exchange. Some of the popular names are Binance, Coinbase, Kraken. But you'll have to find a reliable broker and create an account first. You can trade XLM right from TradingView charts — just choose a broker and connect to your account.
Crypto markets are famous for their volatility, so one should study all the available stats before adding crypto assets to their portfolio. Very often it's technical analysis that comes in handy. We prepared technical ratings for Stellar / TetherUS (XLM): today its technical analysis shows the strong sell signal, and according to the 1 week rating XLM shows the sell signal. And you'd better dig deeper and study 1 month rating too — it's sell. Find inspiration in Stellar / TetherUS trading ideas and keep track of what's moving crypto markets with our crypto news feed.
Stellar / TetherUS (XLM) is just as reliable as any other crypto asset — this corner of the world market is highly volatile. Today, for instance, Stellar / TetherUS is estimated as 9.79% volatile. The only thing it means is that you must prepare and examine all available information before making a decision. And if you're not sure about Stellar / TetherUS, you can find more inspiration in our curated watchlists.
You can discuss Stellar / TetherUS (XLM) with other users in our public chats, Minds or in the comments to Ideas.