Gold Futures (MGCZ5) – H4 Gap in PlayPrice pushed aggressively bullish all day yesterday with little to no pullbacks. That momentum left behind a fresh H4 Fair Value Gap (FVG) sitting just above the Weekly High (WH) level.
If we see a pullback into this area, it could offer a solid setup for continuation higher.
⚠️ Key considerations
About Gold Futures
Gold price is widely followed in financial markets around the world. Gold was the basis of economic capitalism for hundreds of years until the repeal of the Gold standard, which led to the expansion of a fiat currency system in which paper money doesn't have an implied backing with any physical form of monetization. AU is the code for Gold on the Periodic table of elements, and the price above is Gold quoted in US Dollars, which is the common yardstick for measuring the value of Gold across the world.
Related commodities

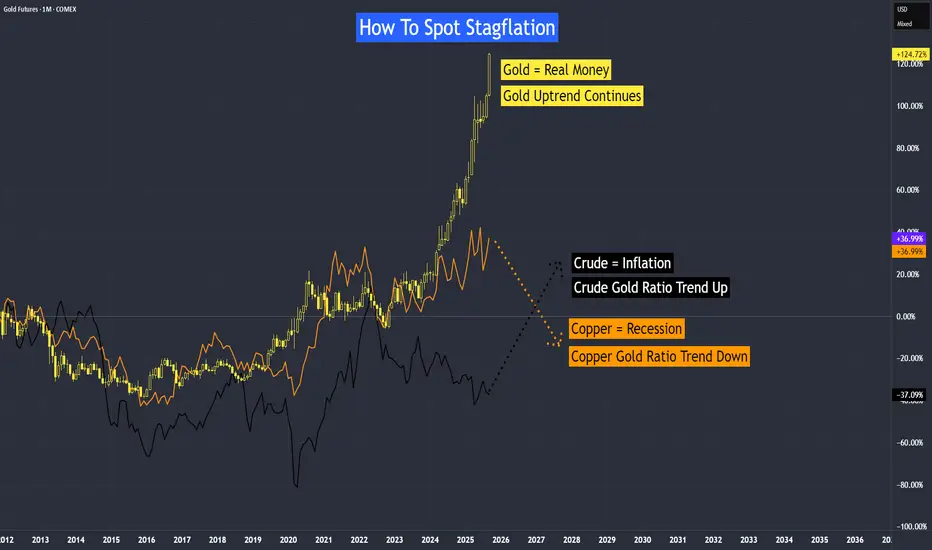
Tracking Stagflation with this Ratio - Crude, Copper, Gold RatioHow to Spot Stagflation?
One way is by looking at the copper-to-gold ratio and the crude oil-to-gold ratio.
• Gold reflects real money and investor confidence.
• Copper tracks recession.
• Crude oil represents inflation pressures.
When real money is under threat, the economy slows, and inflation

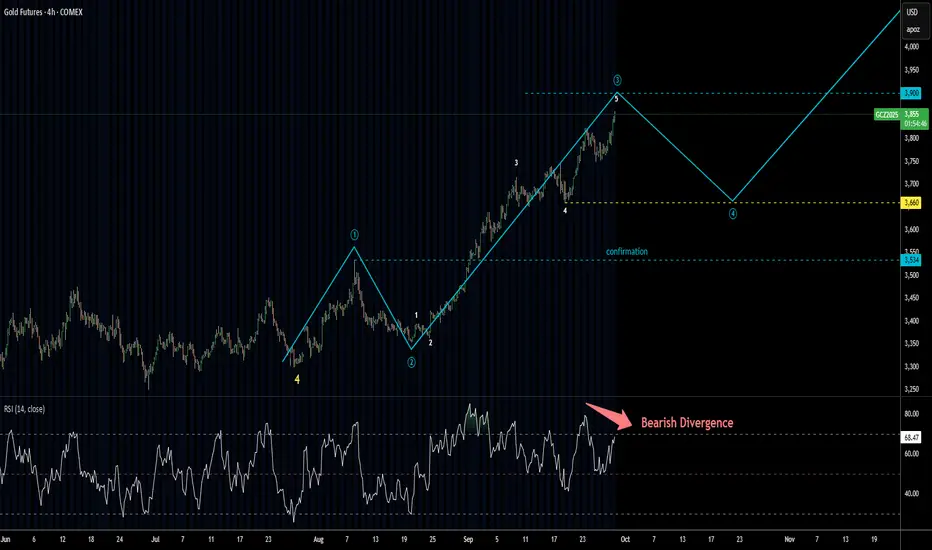
Gold Update 29SEP2025: Top Is Soon, Then PullbackGold Futures are following the projected path closely
The first target at $3,900 is now just "miles" away
This level could mark the top of wave (3) of ((5))
After that, we might see a pullback to around $3,660 in wave (4) of ((5)),
which typically revisits the low of the smaller wave 4
On the 4-ho
How To Spot Stagflation?One way is by looking at the copper-to-gold ratio and the crude oil-to-gold ratio.
• Gold reflects real money and investor confidence.
• Copper tracks recession.
• Crude oil represents inflation pressures.
When real money is under threat, the economy slows, and inflation rises at the same time, we
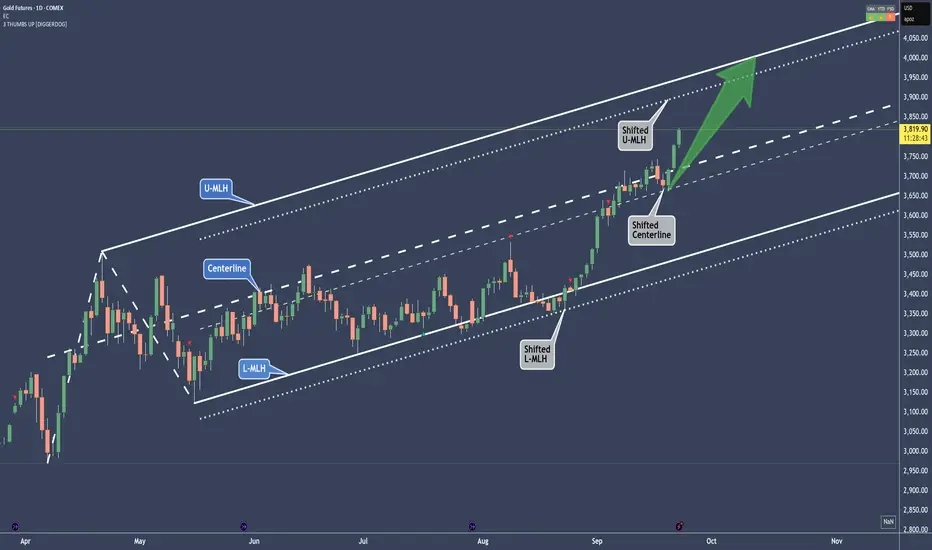
Gold - A shifted move in play and up to 4K🔱 Here’s a shifted move in play 🔱
What exactly is a shifted move?
You see the parallel lines next to the white fork?
Those are the shifted lines.
Now, if you observe how price behaved at the white fork, you’ll notice it was a bit sloppy at the L-MLH, and again at the Centerline after reaching it
Gold Futures Weekly Outlook (MGCZ5)📍 Key Levels on Watch
Friday’s High (D-H): 3814.5
Friday’s Low (D-L): 3764.2 → New support
Weekly High (WFH): 3824.6
Weekly Low (W-L): 3717.7
Daily FVG Below: 3746.3–3735.2
🧭 Technical Outlook
Price is currently sitting right at the 50% midpoint of Friday’s move.
Friday’s Low (3764.2) is the

Gold Futures – Pullback Into H4 Supply Before Drop to Demand?Price sold off strongly from 3812 resistance and is now correcting higher. On the H4, I see a bearish supply zone between 3791.4–3769.9, which aligns with prior POC acceptance around 3790. If price pulls back into this area and fails, I expect continuation lower into the H4 demand zone at 3746.3–373

GC 9/2615min TimeFrame.
I didn't post yesterday but I updated the levels as if I did and made them dotted as "tested"
dashed lines = "untested"
dotted 2x = origin levels where trends originate / bridge&Flip scenarios.
Yesterday we saw how pandora's box operates by laddering into a wedge. We'll watch a
Global news might have us Stalling on Gold! Chart Context (MGC Futures, H1/H4)
Price stalled out after rejecting the H4 bearish zone (3791.4–3769.9).
Yesterday’s downside move lost steam before fully reaching the deeper H4 bullish demand (3746.3–3735.2).
We’re now compressing between Daily High (3792.1) and Daily Low (3752.0).
Fundamental

quick selloff entry opportunity
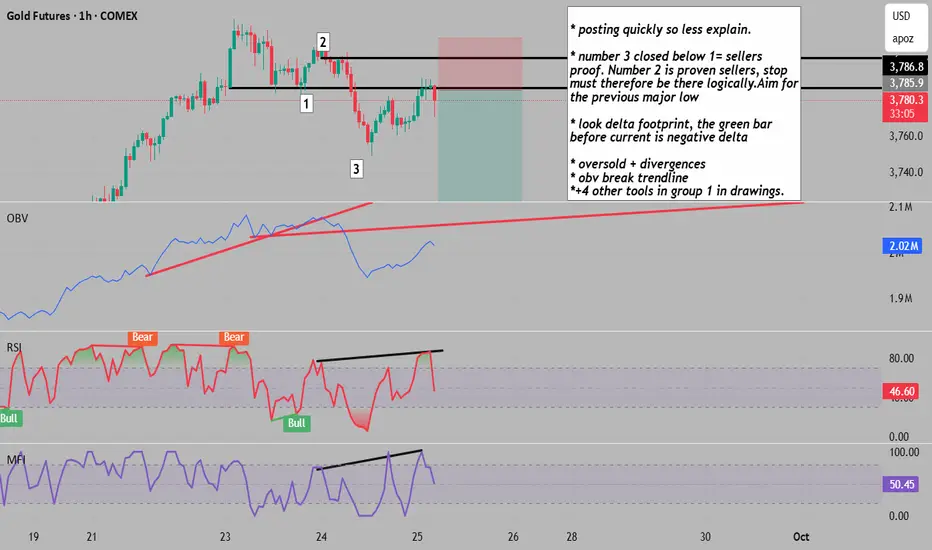
* posting quickly so less explain.
* number 3 closed below 1= sellers
proof. Number 2 is proven sellers, stop
must therefore be there logically.Aim for
the previous major low
* look delta footprint, the green bar
before current is negative delta
* oversold + divergences
* obv break trendline
See all ideas
Summarizing what the indicators are suggesting.
Neutral
SellBuy
Strong sellStrong buy
Strong sellSellNeutralBuyStrong buy
Neutral
SellBuy
Strong sellStrong buy
Strong sellSellNeutralBuyStrong buy
Neutral
SellBuy
Strong sellStrong buy
Strong sellSellNeutralBuyStrong buy
A representation of what an asset is worth today and what the market thinks it will be worth in the future.
Displays a symbol's price movements over previous years to identify recurring trends.
Frequently Asked Questions
The current price of Gold Futures is 3,897.5 USD / APZ — it has risen 0.48% in the past 24 hours. Watch Gold Futures price in more detail on the chart.
The volume of Gold Futures is 282.71 K. Track more important stats on the Gold Futures chart.
Open interest is the number of contracts held by traders in active positions — they're not closed or expired. For Gold Futures this number is 406.74 K. You can use it to track a prevailing market trend and adjust your own strategy: declining open interest for Gold Futures shows that traders are closing their positions, which means a weakening trend.
Buying or selling futures contracts depends on many factors: season, underlying commodity, your own trading strategy. So mostly it's up to you, but if you look for some certain calculations to take into account, you can study technical analysis for Gold Futures. Today its technical rating is strong buy, but remember that market conditions change all the time, so it's always crucial to do your own research. See more of Gold Futures technicals for a more comprehensive analysis.