GOLD: Bullish-Neutral. Wait For Valid Buy Long Setups!In this Weekly Market Forecast, we will analyze Gold for the week of Feb. 16-20th.
Gold is still bullish, but it is ranging sideways. Last week closed an indecisive week with a doji candle. Not great, but the integrity of the overall uptrend is still intact, despite the flash crash last month.
Look for price to respect the bullish discount arrays, and wait patiently for the buy models to form.
There is no reason to take shorts, as there has not been a bearish BOS event.
Enjoy!
May profits be upon you.
Leave any questions or comments in the comment section.
I appreciate any feedback from my viewers!
Like and/or subscribe if you want more accurate analysis.
Thank you so much!
Disclaimer:
I do not provide personal investment advice and I am not a qualified licensed investment advisor.
All information found here, including any ideas, opinions, views, predictions, forecasts, commentaries, suggestions, expressed or implied herein, are for informational, entertainment or educational purposes only and should not be construed as personal investment advice. While the information provided is believed to be accurate, it may include errors or inaccuracies.
I will not and cannot be held liable for any actions you take as a result of anything you read here.
Conduct your own due diligence, or consult a licensed financial advisor or broker before making any and all investment decisions. Any investments, trades, speculations, or decisions made on the basis of any information found on this channel, expressed or implied herein, are committed at your own risk, financial or otherwise.
Gold Futures
No trades
What traders are saying

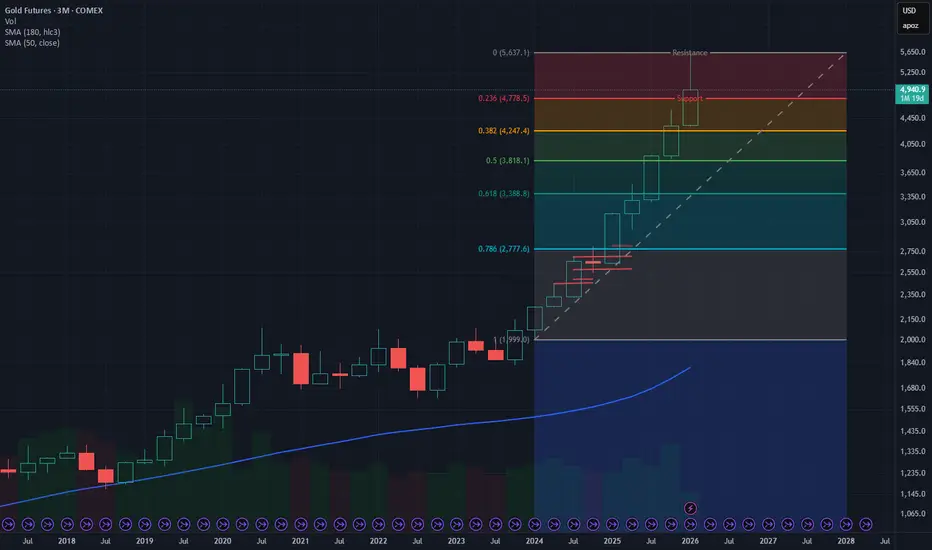
Gold getting ready for next Major Bull RunGOLD Getting ready for the next bull run.
Bull run with little pullback. Levels mentioned- www.tradingview.com
Levels brought up, with technical analysis, including Fib levels at various intervals, previous trend moves, support and resistance levels.
Note: This is purely my idea, I am using for my trades. Use your thoughts before executing your trades.
MCX:GOLD1!

Is Copper Next to Rally After Silver and Gold?Last week, we came across news: China calls for more copper stockpiling.
Therefore, is Copper Next to Rally After Silver and Gold?
Why Is China Stockpiling Copper?
Micro Copper
Ticker: MHG
Minimum fluctuation:
0.0005 per pound = $1.25
Disclaimer:
• What presented here is not a recommendation, please consult your licensed broker.
• Our mission is to create lateral thinking skills for every investor and trader, knowing when to take a calculated risk with market uncertainty and a bolder risk when opportunity arises.
CME Real-time Market Data help identify trading set-ups in real-time and express my market views. If you have futures in your trading portfolio, you can check out on CME Group data plans available that suit your trading needs www.tradingview.com

They take YEARS to morph into existence.Next time you see EPIC SETUPS like these for GOLD... you will KNOW what to do.
So yeah... you WILL NOT find setups like these ANY TIME soon.
They take YEARS to morph into existence.
Have a GREAT weekend!

Gold Futures: A Sharp Drop in Open Interest After Extreme MovesGold futures have seen very violent price action recently. After an exceptional 2025 — with prices nearly doubling — gold is now trading roughly 10% below its all-time high.
While price alone looks dramatic, the more important signal right now comes from Open Interest.
Open Interest is collapsing — and that matters
As shown in the chart, open interest has dropped sharply, reaching some of the lowest levels seen in the last few years. This decline happened during a period of elevated volatility and fast price moves.
A falling open interest tells us that:
Existing positions are being closed, not replaced
Leverage is being reduced
The move is driven more by liquidation than by new directional conviction
This is a key distinction. When price moves lower with rising open interest, it usually signals growing bearish positioning. Here, we see the opposite: participation is shrinking, not expanding.
What this usually implies
Historically, strong price moves combined with falling open interest tend to mark:
The end of an impulsive phase
A transition into consolidation or re-pricing
Reduced trend-following edge in the short term
In other words, the market is clearing positions and searching for a new equilibrium, rather than committing to a new directional trend.
Bottom line
The recent move in gold looks less like a structural trend reversal and more like a deleveraging event.
Until open interest stabilizes and volatility cools, gold futures are more likely in a transition regime than in a clean trending environment.
This analysis is for educational purposes only. It does not constitute investment or trading advice.

Gold daily outlookCOMEX:GC1!
Expecting a push down on Gold. A displacement downside and then another push up is the ideal scenario that I will be looking for


How To Change Candle Color And Use Indicator Candle ColoringI get a lot of questions about using the custom candle coloring features on my indicators, so I wanted to make a quick walkthrough on exactly how to change your candle colors and how to get custom indicator candle coloring to show up properly on your charts. I also cover how to change your candle type.
Step 1 : Click the 3 dots next to the indicator name and then hover over Visual Order and then click on Bring To Front. This brings the indicator visual order to the very front of the chart so that other indicators don't overlap your custom indicator candles.
Step 2 : Click the nut icon in the top right of your chart for chart settings. Then click on the Symbol tab and either update your candle colors or turn off the body, borders and wick. In order to know where price is at all times when your indicator candle coloring lags, try leaving on the border or body toggle.
That's all you need to do to get your custom indicator candle coloring to work properly.
If you want to change your candle type to heikin ashi or another different type of candle, just click on the candle icon in the top middle of your chart options and then select the type of candle you want to use.
Hope this helps.
Happy Trading :)
- Trend Friend

Aggression First, Patience Second: Asian Killzone ExecutionWe opened the week with immediate aggression, breaking above last week’s high without hesitation. That told me early this wasn’t a slow grind environment — this was initiative buying.
Coming into the Asian Killzone, I wasn’t interested in chasing price. After a move like that, I expect some form of pullback or value delivery into the area price launched from.
Before the killzone, price stalled and started to rotate, which kept me patient. I marked the origin of the displacement and waited to see if price would retrace into that zone to offer a cleaner entry.
Once we started trading back into that area, I began executing. Not every entry was perfect — a few attempts failed — but the higher-timeframe narrative stayed intact. Weekly high reclaimed, structure holding, and pullbacks getting defended.
Once my daily objective was hit, I stopped trading. In an environment this volatile, protecting gains is just as important as finding entries.
Some days are about precision. Some days are about discipline. Today required both.

more gold volatility ahead likely this FebBased on the current market dynamics, I am expecting a final sell sequence sometime this February to fill the price gaps at $4100-4300 ranges, as evident on the gold daily tf chart view. After that I don't envision anything being able to stop the breakout to 6k this year and ultimately progressing to 10k over the next couple years' time.
Watch for a temporary near term top at the 5135-5165 price ranges as it coincides with the 61.8 fib retracement level of the recent sell structure on 4 hr tf.. Would strongly consider a short position there with SL at 5190, TP at 4350-4400 to be conservative.
I will be patient to load GLD calls as well as MGC/GC long contracts once we visit the lower levels.

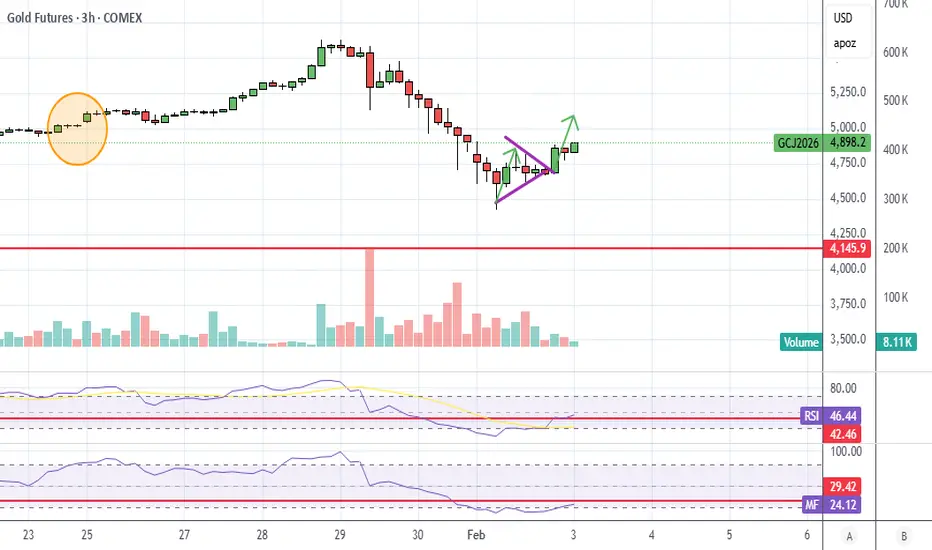
GOLD BREAKOUT - UPSIDE OR DOWNSIDE?Price is compressing near the trendline + technical bounce zone, indicating an impulsive move is coming. Watch for confirmation.
Bullish Breakout
• Buy above: 153,600 (above falling trendline)
• T1 157,800 - T2160,000
• Invalidation - below 152,000
Rejection & Breakdown
• Sell below: 152,000( Failure to hold technical bounce zone)
• Targets: 150,200 / 148,500 /146,800
• Invalidation reclaim above 153,600
Note: This is a decision zone. Trade only after confirmation. Volatility expansion likely in the next few candles.

Bearish ABC Extension toward 127.2% Target | High RR SetupOverview
Following a significant impulsive leg lower, we are seeing a textbook ABC corrective structure play out. After a temporary relief rally into a established supply zone, the market has broken its corrective trend, signaling a continuation of the primary bearish trend.
Technical Breakdown
The Impulse (Leg A): A strong bearish move established the initial momentum.
The Retracement (Leg B): Price entered a yellow corrective channel, retracing approximately 50% to 61.8% of the initial drop. This is a classic "sell the rip" zone for institutional players.
The Breakdown: The recent candle close below the yellow channel confirms that the corrective phase is over and the third leg (Leg C) is now active.
The Target (Point C): We are projecting an exhaustion point at the 127.2% Fibonacci extension (4,099.2). The 127.2% level is a high-probability target as it often clears the liquidity below the previous structural low at (A).
Trade Parameters
Entry: Current Market Price / Retest of the channel break.
Stop-Loss (SL): 5,119.0 (Invalidation occurs if price breaks back above the Swing High at B).
Take-Profit (TP): 4,099.2 (127.2% Fib Extension).
Risk/Reward Ratio: 1/5
Conclusion
The bear flag breakdown combined with the Fibonacci confluence makes this a high-conviction setup. I will be monitoring volume on the approach to 4,100 to look for signs of absorption and profit-taking.

Gold Market UpdateLooking at the termination of the uptrend back in 2011, we saw a pretty aggressive move down at that time.
Comparing that to the current cycle, we had stopping action in 2020 that led to a multi-year trading range and a much larger change of behavior. This is what would be expected, but not to the same degree of complexity as the 2011 termination.
We are most definitely in a change of behavior now. We just had the climactic action that has been anticipated. This type of event was already expected in this area with this type of volume signature that is high, something similar to what we had in the comparable area from the previous cycle.
We're going to have some supply as an opposing force coming in. The sequence provided can be used for analysis going forward.
The attention will probably go somewhere else now. Just like what happened at the previous peak - everybody was in gold or silver at that point, but when that move down occurred, many market participants decided to leave these positions and not trade it because it just became somewhat dull.
Disclaimer: This analysis is for educational purposes only and should not be considered financial advice. Always conduct your own research and consult with a qualified financial advisor before making any investment decisions.

METALS COT POSITIONINGMETALS COT POSITIONING: Silver Leads, Gold Crowded, Copper Weak
Data: CFTC COT Report as of Jan 28, 2026
Using CFTC Commitment of Traders data to analyze where smart money (Commercials) and the crowd (Speculators) are positioned across the metals complex.
SILVER COMEX:SI1! - STRONGEST SETUP
Commercials are heavily NET LONG with a Z-score of +2.2 - this is rare and historically very bullish. Meanwhile, Speculators are only 69% long, well below the 80%+ danger zone that typically marks tops.
When producers and industrial users buy this aggressively while the crowd isn't fully on board yet, it often precedes significant rallies.
Signal: ACCUMULATION
Bias: Bullish
Buy zone: $75-78 on pullbacks
Targets: $90, $100
Invalidation: Weekly close below $70
GOLD COMEX:GC1! - MIXED SIGNALS
Commercials are neutral (Z: +0.2) - not giving a strong directional signal. The problem? Speculators are 84% long. That's crowded territory.
Physical stress remains elevated (2.18) which supports prices, but the positioning is concerning. History shows corrections often start when specs get this extended.
Signal: NEUTRAL
Bias: Cautious
Action: Hold existing, no new longs
Key support: $4,500
Stop for longs: $4,400
COPPER COMEX:HG1! - WEAKEST STRUCTURE
Commercials are NET SHORT (Z: -1.2). The producers expect lower prices. Physical stress is low at 0.34, confirming weak real-world demand.
Signal: NEUTRAL/BEARISH
Bias: Bearish
Downside target: $5.50
Would reconsider if Comm Z turns positive
PHYSICAL DELIVERY DATA - THE REAL STORY
CME delivery reports tell us what's happening in the actual physical market, not just paper trading.
January 2026 deliveries:
- Silver: 9,889 contracts = 49.4M oz (44% of COMEX registered inventory!)
- Gold: 11,862 contracts = 1.19M oz
- Copper: 15,999 contracts = 181,400 tonnes
February is exploding:
- Gold: Already 27,520 contracts in first 2 days (more than all of January!)
- Major banks taking delivery: Citi (3,050), BofA (2,012), JPM (1,685)
The disconnect: While paper prices crashed 31% on margin calls (Jan 30), physical demand is at record levels. The market is saying one thing - institutions are doing another. They want the actual metal.
This supports the COT data: Commercials buying = they need the physical product.
THE BOTTOM LINE
Silver has the best risk/reward here. Smart money is accumulating while the crowd isn't fully positioned. Physical deliveries confirm real demand. Gold is a hold at best - too many speculators chasing. Copper shows distribution from those who know the market best.
Next COT report Friday Feb 7 - watch for continuation of these trends.
Trade safe.
---
Analysis: Market Structure Suite indicator

How to Trade Price Action Patterns in TradingViewHow to Trade Price Action Patterns in TradingView
Master price action pattern recognition using TradingView's charting tools in this comprehensive tutorial from Optimus Futures.
Price action patterns are among the most time-tested technical analysis methods available.
They help traders identify potential reversals, continuations, and high-probability entry points directly from candlestick formations.
What You'll Learn:
Understanding price action patterns: reading market psychology through candlestick formations
The two main pattern categories: reversal patterns and continuation patterns
Essential reversal patterns: pin bars, engulfing candles, and double tops/bottoms
How pin bar wicks reveal price rejection at key levels
Bullish and bearish engulfing patterns for identifying shifts in control
Double tops and bottoms as significant turning point signals
Key continuation patterns: flags, triangles, and inside bars
Using TradingView's built-in candlestick pattern recognition indicators
Manual pattern identification techniques and optimal timeframes
Practicing with TradingView's bar replay feature
The importance of context: trading patterns at support and resistance zones
Entry timing: waiting for confirmation candles
Stop placement strategies for different pattern types
Calculating measured move targets for profit-taking
Multiple timeframe analysis for added conviction
Combining price action with volume analysis for confluence
Aligning patterns with Fibonacci levels and prior swing points
This tutorial may benefit futures traders, swing traders, and technical analysts who want to read price action directly without indicator lag.
The concepts covered could help you recognize high-probability setups, time entries more precisely, and understand the buyer/seller dynamics behind each candlestick formation.
Learn more about futures trading with TradingView: optimusfutures.com
Disclaimer:
There is a substantial risk of loss in futures trading. Past performance is not indicative of future results. Please trade only with risk capital. We are not responsible for any third-party links, comments, or content shared on TradingView. Any opinions, links, or messages posted by users on TradingView do not represent our views or recommendations. Please exercise your own judgment and due diligence when engaging with any external content or user commentary.
This video represents the opinion of Optimus Futures and is intended for educational purposes only. Chart interpretations are presented solely to illustrate objective technical concepts and should not be viewed as predictive of future market behavior. In our opinion, charts are analytical tools, not forecasting instruments.

Weekly Low Set – Gold Showing Bullish Continuation Into MidweekGold remains in a high-volatility environment, though conditions have slightly calmed compared to last week. Even with reduced leverage across prop firms, price continues to show strong intent.
This week’s structure so far:
Monday: Strong displacement down, creating what appears to be the weekly low
Tuesday: Sideways consolidation with gradual price appreciation
Wednesday (Asia): Holding above weekly open and value, suggesting continued bullish intent
Despite aggressive swings, price has respected higher-timeframe levels and is now trading above key weekly references. As long as price continues to hold above the weekly open and does not re-enter Monday’s low structure, I favor continuation higher through the remainder of the week.
I’m not chasing momentum here — I’m watching for pullbacks into value during active sessions to confirm continuation.
Volatility is still elevated. Patience and location remain critical.

GC UpdateLooks to me like this bounce will go a bit higher. It may even double top, gold and silver has a tendency to do that at the top.
Not playing it. Too unpredictable overnight, Asia and EUrope don't always seem to be on the same page with gold, silver, and cryptos. Then again I suppose they weren't on the same page with index futures last night, lol. At least index futures will bounce back up unlike cryptos.
Gold Update 16FEB2026: Wave 4 Visualization of Triangle Wave 4 is in progress and it will take long time to unfold after very large impulse
There is a visualization of potential Triangle pattern that frequently appears in fourth waves
Let's live and see what model would actually play out in the chart

BUYS ONLY!The weekly and daily show strong bullish momentum. Moving down to the 1hr, we also see a trend to the upside. Therefore, waiting for price the enter the support zone and then looking for an indication to buy to the upside with a 1:1 RR.


GC | FEB 13 | 15min ChartLets see what Gold does with this price action.
price is currently at the previous day median range. there is a 15min FS support level below price and a 1hr & 15min resistance level (inv.FS) above price

Gold is still trading within its uptrend channel.Even though gold is still holding within its bullish channel, yesterday’s EQL sweep gives me the idea that, after a clear CISD on lower timeframes, we could see a move toward the bottom of the channel.
This doesn’t mean gold is about to reverse completely, but there’s a strong probability of price targeting the lower boundary and sweeping liquidity there.
We have many swing lows resting below current price, which means plenty of liquidity. If gold intends to continue higher in the short term, it may first need to clear out those positions.
In these market conditions, it’s important to trade with caution and only take A+ setups. With key fundamentals such as USD weakness and rising geopolitical tensions between the US and Iran, volatility can increase quickly. Either scenario could lead to a bullish gap and a potential move back toward the $5,500 area.
Economic Calendar:
London Session:
GBP (GDP)
Pre-New York:
USD (Unemployment Claims)
Good morning, and wishing you all a great trading day.