Comex Gold As prices seen in a consolidation phase from past 7 sessions. Current Support intact $3900 coincide 50DEMA along 50% fib retracement level, if prices fail sustain above support level, can see towards next support zone $3800--$3600 alien with 61.8% Feb. retracement level.
In other scenario, if prices sustain above support level, above 20DEMA-$4000 prices can will see gaining the strength towards $4200.
Whereas if US-China Trade deal tensions, Fed's unchanged rate, US shutdown can continued to see gold stuck into a long time consolidation phase .
Trade ideas

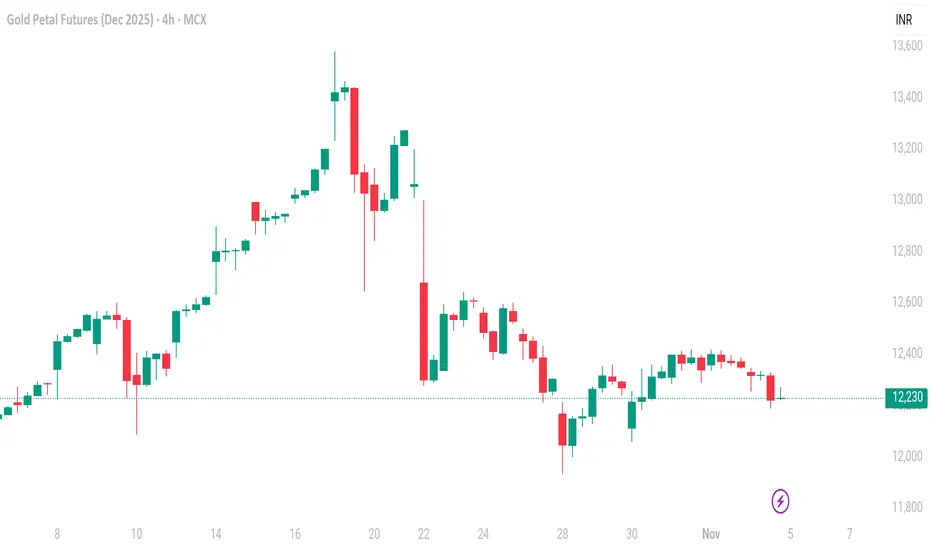
Gold futures max in 4hGold futures max in 4h and trying to identify the trendlines to find entry stop-loss and targets based on 4h time frame.
GOLD: Look For Bullish Breakout From The +FVGIn this Weekly Market Forecast, we will analyze the Gold (XAUUSD) for the week of Nov. 10-14th.
Gold has been consolidating in a +FVG since last week... and it is still holding! Wait for price to break the high of the consolidation and then look for long setups.
Be mindful that price may sweep the sell side LQ before it moves higher.
Enjoy!
May profits be upon you.
Leave any questions or comments in the comment section.
I appreciate any feedback from my viewers!
Like and/or subscribe if you want more accurate analysis.
Thank you so much!
Disclaimer:
I do not provide personal investment advice and I am not a qualified licensed investment advisor.
All information found here, including any ideas, opinions, views, predictions, forecasts, commentaries, suggestions, expressed or implied herein, are for informational, entertainment or educational purposes only and should not be construed as personal investment advice. While the information provided is believed to be accurate, it may include errors or inaccuracies.
I will not and cannot be held liable for any actions you take as a result of anything you read here.
Conduct your own due diligence, or consult a licensed financial advisor or broker before making any and all investment decisions. Any investments, trades, speculations, or decisions made on the basis of any information found on this channel, expressed or implied herein, are committed at your own risk, financial or otherwise.

Gold sellsWe have a strong resistance we’ve been holding at. Price failed two attempts up on the daily and two attempts on the 12-hour chart, with multiple 312 setups to the downside also ready to trigger. looking to target the 4hr unmitigated OB. this move will happen over next week hopefully the beginning of the week as I feel we are ready for a drop

Gold Bush dont rush put a flush but stay hush
Do you really see what's happening here? I
was Not able to use my indictors and New
Algos Bc they are private or unpublished
Wouldn’t you join then if that was The
Case?? previews thsnkd TV , getting into sharing ideas here and youll love them

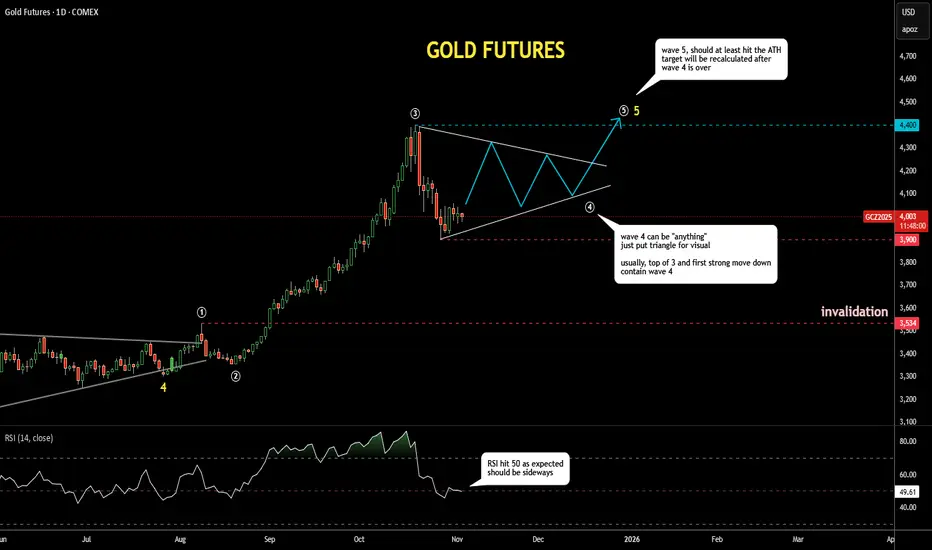
Gold Update 04NOV2025: Wave 4 Dropped Into Target AreaGold futures dropped into the pink-box target area based on the Fibonacci retracement between $3,750 and $4,000.
As expected, the RSI has reached the 50 “waterline”, where it could find some support and start moving around that level.
Many traders lose money in fourth waves, as they can be “anything” and often last longer than one’s pocket. I’ve outlined a triangle shape in wave 4 just for visual context.
The range built through the peak of wave 3 around $4,400 and the bottom of recent panic selling near $3,900 will likely contain most of the volatility in wave 4.
It can take time… testing one’s patience.
Gold Awaits Breakout or BreakdownFenzoFx—Gold's upside momentum has been capped by the $4,050.00 resistance, backed by the anchored VWAP from October 23. The immediate support rests at the recent lower high, the $3,971.00 mark.
From a technical perspective, a close below the immediate support could trigger the downtrend, retesting the lows at $3,901.00. On the flip side, if the price closes above $4,050.00, the current uptick in momentum could extend to the upper line of the bearish channel, followed by $4,175.00.

Part two emphasis on goldI was supposed to do some work on Trading View to set up my tools but I failed to do that and this turned into an analysis of price action as it pertained to gold...
Probably tomorrow there will be another video but it will be focused on fixing the tools to make my life a lot easier and as I said if I get that result from my friend we will make it available to other people at no cost.

GC UpdateRemember earlier this year, I said the target for gold was $4k? Well, I guess a lot of other people had the same idea, lol. It's settled in at $4k, and I don't think it'll move for a while.
No more updates until it does something. Maybe we need to poke it with a stick.
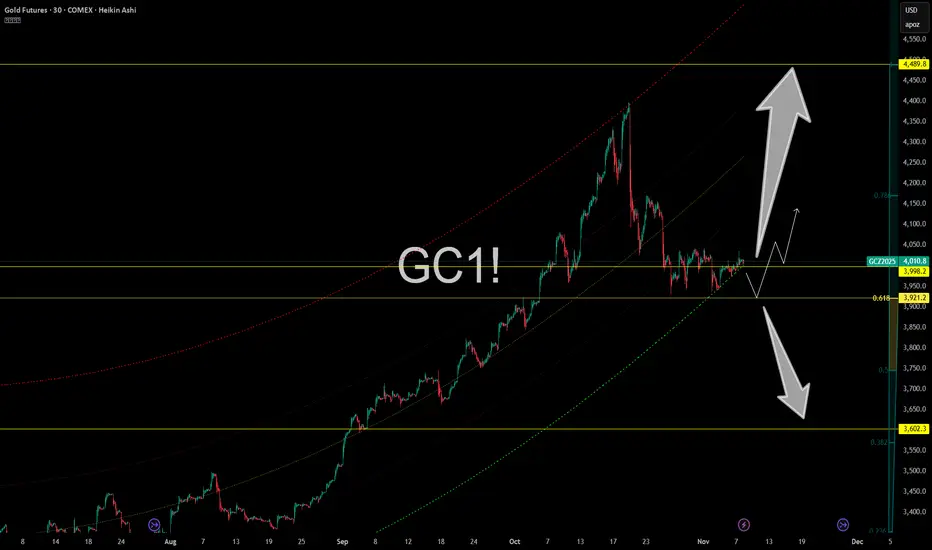
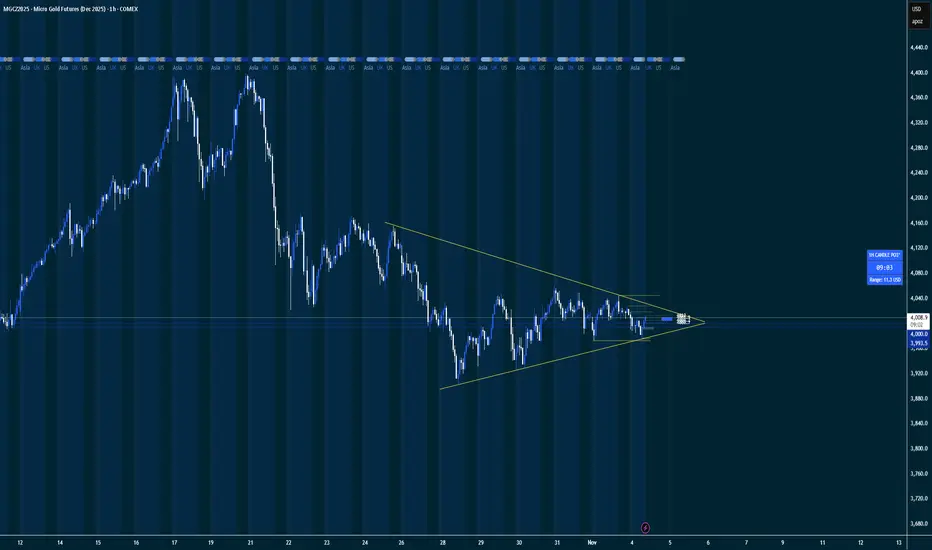
Gold Futures – Compression Before Explosion?Gold (GC1!) is coiling tightly just above the $3,998 level, teasing a big move as it hugs the 0.618 fib zone at $3,921. It’s the definition of compression — and when gold coils like this, something always gives.
📍 Key levels on the radar:
$3,998 – Current pressure zone
$3,921 – Fib support + breakout base
$3,602 – Worst-case flush if demand fails
$4,489 – Fibonacci extension target if this rips
We’ve got an ascending pitchfork, clean market structure, and a massive range breakout setup. These kinds of patterns don’t sit idle for long.
Gold remains a beast in uncertain macro conditions — don’t underestimate what happens when fear, rates, and inflation mix.
Trading Wisdom 📜
The bigger the coil, the nastier the move. Don’t focus on direction — focus on readiness. Gold pays those who stay patient and deadly.
Disclaimer: What you read here is not financial advice — it’s high-level market philosophy from the FXPROFESSOR himself. Risk is real, and your capital is your responsibility. Learn, adapt, evolve.
One Love,
The FXPROFESSOR 💙
Choosing Your Path in Futures TradingThere’s more than one way to participate in the futures markets. Whether you're hands-on or prefer a more passive approach, selecting the right method depends on your trading goals, risk tolerance, and available time. Here’s a breakdown of the most common approaches used by active and aspiring futures traders.
1. Self-Directed Trading
If you like full control over your trades, this approach is for you. It requires staying up to date on market news, analyzing charts, and executing your own trades according to a plan and framework which can be referred to as your “strategy.” Experienced traders may prefer this model for its flexibility and transparency.
Past performance is not indicative of future results.
2. Automated Trading Systems
These systems use predefined rules to analyze data and execute trades without manual intervention. They can be ideal for traders who want to capitalize on algorithmic speed and logic while minimizing emotional decision-making, or for traders who might not have the time to dedicate to self-directed trading.
EdgeClear offers connectivity to a handful of automated programs, if you are interested in learning more please contact us.
3. Managed Futures
For a more passive route, managed futures allow you to invest in futures contracts through a Commodity Trading Advisor (CTA) or Commodity Pool Operator (CPO). The advisor handles the trading, using their expertise to manage risk and seek opportunity.
4. Broker-Assisted Trading
Prefer to have a trusted guide by your side? With broker-assisted trading, a professional helps execute trades, manage risk, and offer support—all tailored to your preferences.
Key Takeaway
Every trader’s journey in the futures markets looks different. Whether you thrive on taking full control of your trades, prefer automated systems, or rely on professional guidance, the key is to find the approach that aligns with your goals, risk tolerance, and lifestyle.
Understanding the options available self-directed, automated, managed, or broker-assisted empowers you to trade more confidently and effectively.
Call to Action
At EdgeClear, we’re dedicated to helping traders at every level find the tools, guidance, and support they need to succeed. Explore our platforms, connect with our expert brokers, or follow us on TradingView to discover more Trade Ideas and educational content to refine your edge.

US Employment Data Positive for GOLD Prices. Can GOLD reverse?GOLD is declining in falling channel pattern however seems to be taking support at the marked trendline.
US Employment data came just in where number of jobs added was better than expectations which would mean a stronger labour market and inflation might stay elevated which is good for GOLD/SILVER due to safe haven demand in the long term.
Keep an eye on GOLD prices.

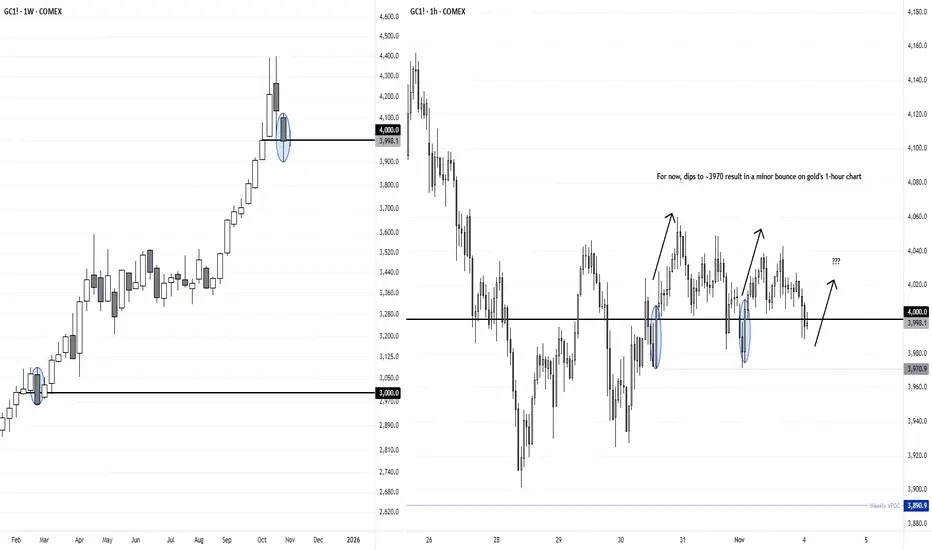
Gold Bulls Defend the $4000 Level as Bears Struggle for ControlGold closed lower for a second week, and prices are now meandering around the 4000 handle. We can see that the last time it tried to break back below such a milestone level, gold bear sonly managed a single weekly close below 3000 before the rally continued.
I doubt we’ll see another 1000 directly from current levels, and my bias is actually for the retracement to eventually dip lower before its bullish trend resumes. But for now, traders could seek false breaks below 4000 in anticipation of at least a minor move higher.
My video from Friday provides a bullish bias on the daily timeframe over the near term which still stands. But for those on intraday timeframes, notice that bullish engulfing candles have appeared on the 1-hour chart on the prior two occasions that gold tried (but failed) to break beneath 4000. It’s as if gold bears are trying to force the golden beach ball below its 4000 waterline.
Matt Simpson, Market Analyst at City Index
Commodity Market Analysis: The Core of Global Trade1. Understanding the Commodity Market
Commodities are divided mainly into two categories:
Hard Commodities: Natural resources that are mined or extracted, such as gold, crude oil, copper, and natural gas.
Soft Commodities: Agricultural products and livestock, such as wheat, coffee, sugar, cotton, and cattle.
The commodity market allows producers, traders, and investors to trade these items through spot markets (for immediate delivery) and futures markets (contracts for future delivery at predetermined prices). Futures contracts are the most popular instruments in commodity trading because they allow participants to hedge risk and speculate on price movements.
2. Importance of Commodity Market Analysis
Commodity market analysis helps determine where prices are heading and why. Because commodities are essential for every economy—from manufacturing to energy to agriculture—their prices influence inflation, exchange rates, and corporate profits. Investors and traders analyze this market to:
Identify investment opportunities
Hedge against inflation and currency fluctuations
Forecast economic growth or slowdown
Manage risk and portfolio diversification
For example, rising crude oil prices often signal economic strain, while increasing metal prices might suggest industrial growth.
3. Types of Commodity Market Analysis
Commodity analysis can be broadly categorized into fundamental analysis and technical analysis. Each approach provides different insights into price movements.
A. Fundamental Analysis
Fundamental analysis focuses on understanding the underlying factors that affect supply and demand. For commodities, these factors include:
Supply Factors:
Weather conditions (affecting crops like wheat or coffee)
Mining output and energy production levels
Government policies, export restrictions, or trade tariffs
Geopolitical tensions or wars disrupting supply chains
Demand Factors:
Industrial and manufacturing growth
Population growth and changing consumption habits
Technological advancements (like electric vehicles increasing demand for lithium and copper)
Seasonal demand variations (e.g., more oil consumption in winter)
Fundamental analysts often look at inventory levels, production reports, and global trade data to estimate price directions. For example, if OPEC announces production cuts, it often leads to a rise in crude oil prices due to reduced supply.
B. Technical Analysis
Technical analysis studies price patterns, volume data, and historical trends to forecast future movements. It assumes that all market information is reflected in prices and that human behavior often repeats in patterns.
Key tools include:
Candlestick charts: Show price movement patterns like “Doji,” “Hammer,” or “Engulfing,” which can signal reversals or continuations.
Support and Resistance levels: Help identify price zones where buying or selling pressure increases.
Indicators: Such as Moving Averages (MA), Relative Strength Index (RSI), MACD, and Volume Profile, which help identify trends and momentum.
Volume analysis: Confirms whether price moves are supported by strong participation.
For instance, if gold breaks above a major resistance with high volume, it signals strong bullish sentiment.
4. Major Global Commodity Exchanges
Commodities are traded across various international exchanges that set global benchmarks:
New York Mercantile Exchange (NYMEX) – for crude oil, natural gas, and metals
Chicago Board of Trade (CBOT) – for agricultural commodities
London Metal Exchange (LME) – for industrial metals like copper, aluminum, and zinc
Multi Commodity Exchange (MCX), India – for gold, silver, crude oil, and base metals
National Commodity and Derivatives Exchange (NCDEX), India – for agricultural products
These exchanges operate under strict regulations, ensuring transparent price discovery and risk management.
5. Key Commodities and Their Drivers
Let’s look at some key commodities and what drives their prices:
Crude Oil:
Driven by OPEC decisions, geopolitical conflicts, global demand, and inventory data. Oil is sensitive to global growth expectations and energy transitions toward renewables.
Gold:
Considered a safe-haven asset. Its price moves inversely with the U.S. dollar and interest rates. During economic uncertainty, inflation, or political instability, investors flock to gold.
Silver and Copper:
Silver acts both as a precious and industrial metal, while copper is an industrial growth indicator. Their prices rise with manufacturing demand and fall with economic slowdowns.
Agricultural Commodities:
Prices of wheat, soybeans, and coffee depend heavily on weather, global harvest reports, and export-import policies.
Natural Gas:
Influenced by seasonal demand, storage levels, and geopolitical factors (e.g., disruptions in gas supply from Russia or the Middle East).
6. Global Economic and Political Impact
The commodity market is deeply tied to global macroeconomic and political conditions. For example:
Inflation: Rising commodity prices often lead to inflation, as they increase costs for manufacturers and consumers.
Currency movements: A stronger U.S. dollar typically lowers commodity prices (as they are priced in dollars), while a weaker dollar lifts them.
Geopolitical tensions: Conflicts in oil-producing regions, like the Middle East, can cause supply disruptions and sudden price spikes.
Interest rates: Higher interest rates strengthen the dollar and reduce demand for non-yielding assets like gold.
Thus, traders must keep track of global news, central bank policies, and trade agreements to anticipate market reactions.
7. Risk Management in Commodity Trading
Commodity markets are highly volatile, making risk management essential. Traders use strategies like:
Hedging: Producers and consumers lock in prices through futures contracts to protect against price fluctuations.
Diversification: Investing in multiple commodities to reduce exposure to one sector.
Stop-loss orders: Limiting losses when trades go against expectations.
Position sizing: Managing capital allocation to avoid overexposure.
For instance, an airline company may hedge against rising fuel prices by purchasing crude oil futures.
8. The Role of Technology and Algorithms
Modern commodity trading is increasingly driven by AI algorithms, data analytics, and automated systems. Traders use real-time data to analyze weather patterns, satellite imagery (for crop forecasting), and global supply chain movements. This digital transformation enhances precision and speed in decision-making.
Platforms now integrate Volume Profile Analysis and Market Structure Analysis to study institutional order flow and liquidity zones, giving traders a professional edge in spotting reversals and breakouts.
9. India’s Commodity Market Scenario
India is emerging as a major player in global commodity trading, particularly in gold, silver, and agricultural goods. Exchanges like MCX and NCDEX provide transparent, electronic platforms for traders. The introduction of commodity options, delivery-based contracts, and SEBI regulation has made the market more robust and investor-friendly.
With India’s growing energy and industrial demand, its role in setting regional commodity trends is increasing. Government policies on renewable energy and agriculture will further shape the market outlook.
10. Conclusion
Commodity market analysis is an essential skill for anyone involved in global trade, investing, or risk management. Understanding the interplay between supply-demand factors, geopolitical shifts, and technical indicators helps predict market direction more accurately. While volatility remains high, informed analysis enables traders and investors to turn uncertainty into opportunity.
In the modern era, commodities are not just physical goods—they’re strategic financial assets that influence inflation, economic policy, and portfolio performance. Whether you’re trading gold, oil, or agricultural futures, a strong grasp of market fundamentals and technical tools can unlock significant growth potential in this dynamic sector.
GOLD: Bullish! Continue To Buy! The +FVG Is Holding!In this Weekly Market Forecast, we will analyze the Gold (XAUUSD) for the week of Nov. 3 - 7th.
Gold has completed the pullback into the Weekly +FVG. It has moved sideways since, but inching higher.
Buys are valid. They have the highest probability.
Sells become valid only after a bearish break of market structure!
Enjoy!
May profits be upon you.
Leave any questions or comments in the comment section.
I appreciate any feedback from my viewers!
Like and/or subscribe if you want more accurate analysis.
Thank you so much!
Disclaimer:
I do not provide personal investment advice and I am not a qualified licensed investment advisor.
All information found here, including any ideas, opinions, views, predictions, forecasts, commentaries, suggestions, expressed or implied herein, are for informational, entertainment or educational purposes only and should not be construed as personal investment advice. While the information provided is believed to be accurate, it may include errors or inaccuracies.
I will not and cannot be held liable for any actions you take as a result of anything you read here.
Conduct your own due diligence, or consult a licensed financial advisor or broker before making any and all investment decisions. Any investments, trades, speculations, or decisions made on the basis of any information found on this channel, expressed or implied herein, are committed at your own risk, financial or otherwise.

Waiting on the Sweep – ADP Should Provide the CatalystChoppy week so far with price distributing and grinding lower. Last week’s low still hasn’t been taken, so my macro target remains the same. I’m looking for ADP tomorrow during NY session to provide the volatility needed to run liquidity and complete that sweep.
Not predicting direction on the release itself — I’ll be waiting for a liquidity grab and displacement before considering an entry. If price runs stops above today’s Asia high or drives directly into last week’s low, I’ll be watching for the post-news retrace to an FVG/structural level to participate.
Patience here — the move is close, but confirmation > anticipation.

Bearish Scenario (primary)Bearish Scenario (primary)
Bias: Still bearish until price can reclaim 4020+ on 4H.
Setup idea:
Entry: 4008–4012 (retest of imbalance / EMA cluster).
Stop-loss: 4022–4025 (above 4H minor swing and trendline).
Targets:
TP1 → 3980 (1H structure low / EMA200 zone)
TP2 → 3960 (liquidity sweep below wedge support)
TP3 → 3920 (major 4H demand zone)
Confirmation: Wait for 15m rejection wick or lower-timeframe MSS/CHOCH within that zone.
Bullish Alternative (reversal breakout)
If price closes a 4H candle above 4020 with strength:
Entry: Retest of 4010–4012 as support.
Stop-loss: Below 3995.
Targets:
TP1 → 4040 (previous supply zone).
TP2 → 4080 (liquidity above equal highs).
Summary
Structure compression signals potential breakout soon.
Since momentum is still bearish and price is failing to reclaim 4H EMAs, short from resistance is higher-probability.
Watch reaction to 3980 — if it holds firmly with bullish divergence, the wedge breakout north could begin.
1H DIRECTION SHIFT SELLING OPPORTUNITY1. If Direction Shift happens in internal structure, it's a signal of selling oppo.
2. On Base wait for one Hour selling engulf candle enter on retest and sell.
3. TP1 is 3990 and TP2 is bigger till 3790

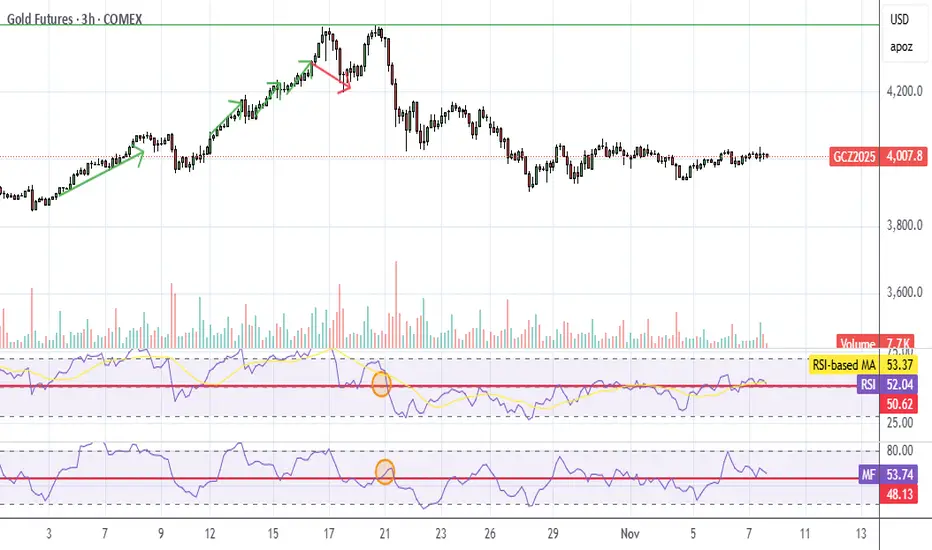
Gold Technical Outlook: Breakout or Breakdown Ahead?Market Context
Gold recently hit fresh all-time highs near $4,400 in mid-October after dovish comments from the Federal Reserve, but has since paused as traders digest the news. The price is consolidating around the $4,000 area, with bulls and bears locked in a tug-of-war, creating a crucial juncture for gold’s short-term trend.
Technical Breakdown
• Trend:
Gold had been climbing steadily along a rising support trendline , but that line has now been broken . This signals that the recent uptrend may be on hold or reversing in the near term.
• Resistances:
The chart shows a classic double-top pattern , with peaks around 4,210–4,225 . After retesting this zone and failing, sellers took control. There’s also a minor resistance zone near 4,040 , which capped a recent bounce.
In short, bulls must reclaim 4,040 first, a breakout above this would open the path toward 4,210–4,225 .
• Support:
Key support lies near 3,914 . This level held strong during earlier pullbacks even after the trendline broke.
If gold retests 3,914 and holds, it could provide a solid base for buyers, but a decisive break below it would confirm downside continuation.
• RSI (Momentum):
The 14-period RSI is hovering near 50 , showing a neutral stance. We can observe both bearish divergence (as price formed a double top while RSI made a lower high) and bullish divergence (as RSI formed higher lows while price dipped).
This mix of signals means momentum is indecisive , traders should wait for confirmation.
What to Watch Next
1. Price Reaction at Key Levels
Watch how price reacts around 4,040 and 3,914 .
A break and hold above 4,040 could shift short-term momentum bullish, targeting 4,210–4,225 .
A rejection or breakdown below 3,914 could trigger further selling pressure.
2. RSI Confirmation
A sustained move of RSI above 50 supports bullish momentum, especially if price also rises.
Conversely, a drop below 45–40 would reinforce bearish sentiment.
If price breaks above the double top and RSI makes a higher high , bearish divergence is invalidated, confirming strength.
But if price breaks below support and RSI follows with new lows , the bullish divergence fails, favoring sellers.
Summary
Gold’s short-term trend depends on how it reacts at these key levels (4,040 and 3,914) .
The market is at a decision point, either breakout or breakdown.
Combining price structure with RSI confirmation can help traders stay aligned with the next impulsive move.
Analysis by @TraderRahulPal | More analysis & educational content on my profile.
Disclaimer: This analysis is for educational purposes only and should not be considered financial advice. Trade responsibly with proper risk management.

Gold Could Finally Be Set for a BounceGold is on track for its second week lower, its first such bearish sequence since June. But clues on price action and options positioning suggests upside risks for gold could prevail.
Matt Simpson, Market Analyst at City Index.

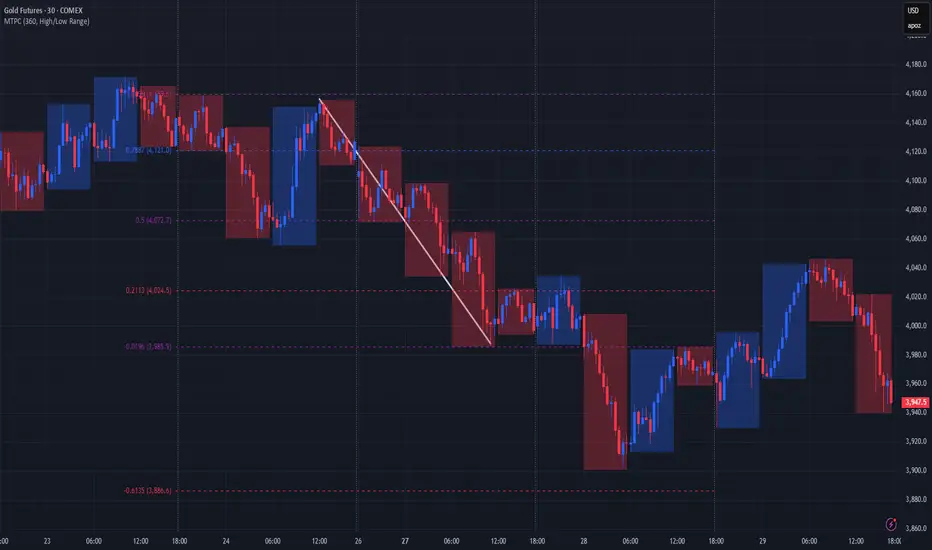
A better alternative to Fibonacci grid🙏🏻 Fibonacci based grid is a great inspiration from the Universe, but imo ain’t the final product, and here it is:
For traders
Use these values above and put em into grid tool here, and you’ll end up with uniform distribution based grid:
1.6134612334371357
1.0196152422706632
0.7886751345948129
0.5
0.21132486540518708
-0.019615242270663247
-0.6134612334371357
Then about how to apply it, you can divide trading activity by analytical units, these are in turn are based on:
^^ by price
^^ by time
^^ by signed volume waves/volume delta
Explanation
If you’ve followed my latest work you know I’ve identified a way to combine higher order moments to construct natural data driven estimates of data’s extremums and “ever possible” values (I still got no idea how no1 Ever posted it anywhere over the last centuries).
Now imagine you got only 2 input values: actual max and min (just like in Fibo grid, it ain’t knows nothing else). Given only these 2 values we can model stuff with uniform distribution that has precisely known values of standardized moments, so we end up with (and remember that uniform distro is symmetric around its mid, so all odd moments are zero):
dev = 1 / math.sqrt(12) //standard deviation
kurt = 1.8 //kurtosis (not excess ofc, the raw one)
hkurt = 27 / 7 //hyperkurtosis, 6th moment, raw af as well
0.5 + dev * hkurt
0.5 + dev * kurt
0.5 + dev
0.5
0.5 - dev
0.5 - dev * kurt
0.5 - dev * hkurt
And the resulting output of it u seen at the beginning of the post, notice how the edges *almost* match your lovely golden ratio.
For wanderers:
Now for the wanderers, creators etc etc etc
We might have a new math constant in our hands.
This can’t be a coincidence that limit levels (the ones at the edges) almost match the golden ratio . What if we find some kind of ‘almost’ uniform distro, where the limit levels would ‘exactly’ match the golden ratio? No problem - Beta distribution with parameters alpha = beta = (smth just a bit greater than 1).
I solved it numerically in python with mpmath library (necessary for high precision stuff, default packages are gonna truncate too much and we work with gamma functions there, high powers, huge numbers).
The following constant used as both parameters for Beta distribution provides us an almost uniform beautiful distro, with a minimal necessary deviation from uniform distro if u pls, just with a lil bit gently smoothed corners, and all connected to fibonacci sequence and golden ratio:
1.013156499304251804283836146883597463164059088989506487984660881392552993230097518061037104047261922219476043198153474114525730243848097530913517155085537693517359999905511951459927003624291626547046737804828112785002512650…
… and it goes on and on. I called it Sagitta constant, because visually it creates that beautiful almost flat shape, the minimal natural curvature. And now if we put this as c in Beta(c, c) following the same levels construction method from before we get these levels:
std = 0.28741741
K = 1.80628205
Hk = 3.88993123
0.5 + std * hk = 1.61803398
0.5 + std * k = 1.01915692
0.5 + std = 0.78741741
0.5 = 0.5
0.5 - std = 0.21258258
0.5 - std * k = -0.01915692
0.5 - std * hk = -0.61803398
Visuals, plots, graphics
^^ here you can see how our resulting distro & derivatives look like, kinda cute aye?
Beta(c, c), where c is our constant Sagitta, actually might be a natural prior for Bayesian stuff, almost a boxcar windowing function for DSP so u gonna tame that famous spectral leakage, or a kernel for KDE, like u name it, every case when u need a uniform shape yet with slightly relaxed endpoints, you can use it in design and architecture.
Go for it bros, test it in your R&D. Maybe some1 gonna use it to prove Riemann assumption conjecture , if u get dat milli send me 25% ima find a good use for it.
∞
GOLD: Bullish, But Retracing! Short Term Sell Opportunity!In this Weekly Market Forecast, we will analyze the Gold (XAUUSD) for the week of Oct. 27 - 31st.
Gold is still bullish, the current pullback it's in notwithstanding. Waiting patiently for valid buy setups is the sure way to go.
That being said, there is sell setup that could present an short-term opportunity. The Daily -FVG is currently holding price in check. Should price return to it and it continues to hold, a valid sell opportunity could present itself.
Be careful, as it is counter-trend. They can be lower-probability.
Enjoy!
May profits be upon you.
Leave any questions or comments in the comment section.
I appreciate any feedback from my viewers!
Like and/or subscribe if you want more accurate analysis.
Thank you so much!
Disclaimer:
I do not provide personal investment advice and I am not a qualified licensed investment advisor.
All information found here, including any ideas, opinions, views, predictions, forecasts, commentaries, suggestions, expressed or implied herein, are for informational, entertainment or educational purposes only and should not be construed as personal investment advice. While the information provided is believed to be accurate, it may include errors or inaccuracies.
I will not and cannot be held liable for any actions you take as a result of anything you read here.
Conduct your own due diligence, or consult a licensed financial advisor or broker before making any and all investment decisions. Any investments, trades, speculations, or decisions made on the basis of any information found on this channel, expressed or implied herein, are committed at your own risk, financial or otherwise.
