Silver to 21.650$Silver is going to test 21.650$ level by the end of the week.
Follow To Get More Signals
SIU2019 trade ideas

#Silverm making bat pattern#silverm is making harmonics bat pattern
The pattern will be confirmed perfectly only after touching 69525
If the prices breaks 70000 , pattern will be failed and cannot make any position
Also the silverm breakdown the trend as shown in the chart
If its makes perfect
The entry will be @ 69525
Sl @ 69370
Target @ 69790
# educational purposes only

Silver: Converting resistance to supportSilver's next hurdle is the 24-25$ area.
But after that, a run on the famed 28$ "wall" should be expected.
Now, that will be a breakout for the ages!
#silver #gold #inflation #recession #recovery

5 Steps:The Silver Contract All COMEX Is Talking About#1-The Silver Way To Profit
Silver price has shown a spike today on Monday as i woke up to check out the chart in the morning.
#2-There's Big Money In Silver
Silver is a good opportunity for you especially if you are trying to learn about trading without taking much risk.
#3-Turn Your Silver Into A Money Making Machine
The good thing about buying physical silver is that you don't need margin to hold your position in it.
#4-Want To Be A Silver Bug?
Again being a silver bug is very simple - right now the bear market is very terrible and the panic that is in the markets is evidence as to why many investors are seeking a safe heaven asset.
#5-Hidden Silver In Your Portfolio
This is the most secure investment you can hold for yourself and your loved ones, a future inheritance
Disclaimer:This is not financial advice do your own research before you trade

DeGRAM | SILVER longSilver price went down and tested a major support zone.
Price action is likely to consolidate at that level.
The market reached the demand zone, where the price made a sharp bullish move.
Price action created an engulfing candle at the support level, an indication of potential upward momentum.
-------------------
Share your opinion in the comments and support the idea with like. Thanks for your support!

Silver ready for upside move On Our Harmonic pattern indicator based trade setup take trade as explained below :-
Early trades Buy or sell below/ above 23.6 %, safe trades buy or sell above / below 41% , after taking trade next upside or downside levels will be target ,
When reverse buy or sell signal appear then book profit on Target or trail SL to 23.6 % If trailing SL hit then early trade can be taken above or below 23.6 and safe trade can b taken above/ below 41% ..
Please note:-
It's working on news based and volitile market very well so exit if SL hit

Sell silverNote the levels #silver
Sell silver at the level
According to my analysis silver to be sell as per my chatings

SILVER Silver clearly showing downtrend further support may be looked at 69700 @ 200EMA:<If it contiounsly fall down , we could expect retreat at 67700 @ 0.61 FIB.
BEST BUYING LEVELS FOR SILVER IS 64000 TO 65000. TARGET - 79000 TO 82000
Monthly Silver chart might bounce off of trend lineSilver has sold off aggressively the last few days. You can see that the price is now right near an ascending trend line. If this trend line holds, then we can expect a bouce upward soon.
The trend line is not quite touched. Maybe price will drop a further 50 cents or dollar to touch it?

Silver Monthly Candle Forms a Pinbar (Hammer)August's silver monthly candle completed as a pinbar. This "hammer" gets triggered as a buy signal only if the price moves ABOVE the top of the pinbar by a few cents, or around 25.50 for the December contract. Some traders may buy early by going to the lower time frames of daily or 4 hours and looking for a buy entry midpoint between the close and the bottom which would be around 23.60. (Still, the trade is only considered a buy if the price hits around 25.50!)
Please see my previous idea about what I think is an inverted head and shoulders on the silver weekly chart. A weekly close above around $26 could send silver to $34 or higher.
Sometimes silver does lead gold, so if this trade is triggered expect gold to head higher also even if it is lagging at the time.

Silver bottom, Gold too most likelySilver seems to be bottoming on daily chart. You have a pinbar candle, a way oversold RSI. A reasonable up day/green candle close should be a buy signal in my book.

Silver Daily "Demand" LONGVery incomplete analysis here, but looking for confirmation of reversal on low timeframe charts. Additional zone lower, so keep that in mind, but these levels haven't been seen in quite some time and there was an imbalance favoring buyers last time we were here, so consider a buy despite very negative headlines, recent USD strength, etc. Stepping in front of momentum, though, so use good judgement re: sizing. Also may want to consider mechanical profit scaling @ 1:1 + holding runners. Will revisit/update later.
JHart @ LionHart Trading

Silver near to bearish zone if breaks 0.50 Fib level & TrendlineSilver has touched trendline of 1 day TF and broke trendline of 1hr TF. If it breaks further we can expect a big fall in Silver. Reason is break of trendline and 0.50 Fib level which are important levels.
Be cautious in trading silver and lets wait for the next move of Silver to decide the trend.
Follow me to get further updates on what should be the next step. Your thoughts are welcome.

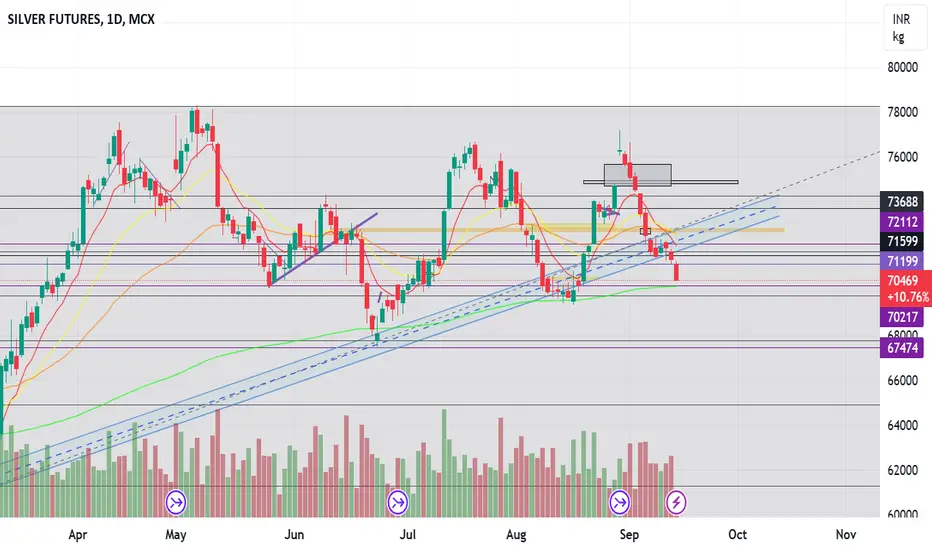
Silver: Breaking six Weeks lowSilver breaking its last 6 weeks low.
commodity broke down from its symmetrical triangle.
A pull back can be expected from 67441 levels but not to an extent to reach to triangle trendline levels
Key levels to watch :
Supports: 67441, 65222, 63453. Resistance: 72109, 74741.

Nowhere we went in Quarter-2 in SilverSilver almost exactly reached the beginning of this quarter. Brokerage firms provided significant estimates for this Diwali aim for silver in the INR 75000–80000 price band. Are these goals intended to improve Diwali for retailers? It appears that silver won't be able to close over INR 74,800 for this quarter (Q3-2023/24). There will be an increasing number of buying chances for a new entry. Please don't be concerned if Silver temporarily displays a level of INR 59000 before fulfilling your ambitions of reaching INR 80000 and above.
Stay invested. Stay Cool.

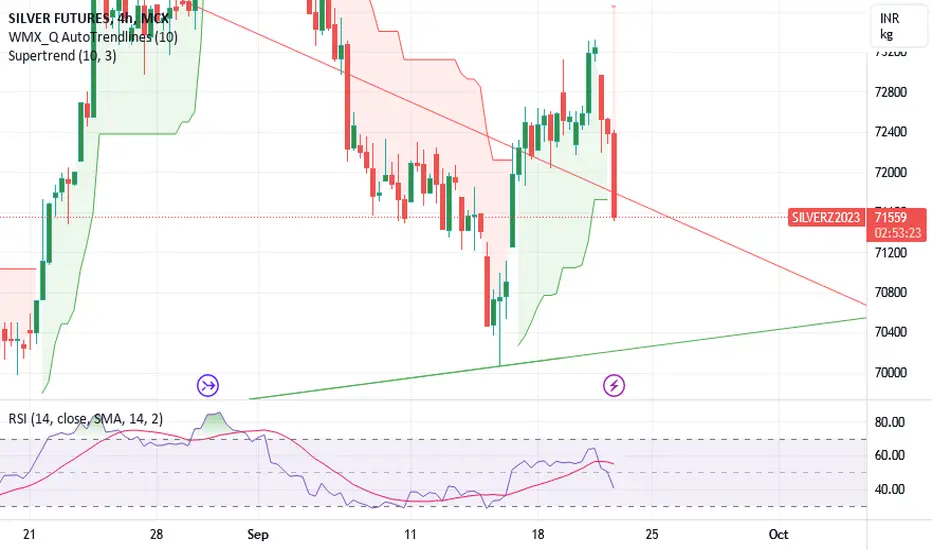
Assessing the Silver Market: Opportunitie and Risk as Q4 BeginsThe Silver market is a mixed bag, and there are several ways traders are looking at this market. The precious metals complex has been under recent pressure with the rising dollar and rising treasury yields, and Silver is nearing the make it or break it point with some of the weakness we have seen this week.
Good News:
With the negative price action the market has seen, there is still some good news for the bulls. For one, Silver is an industrial metal, unlike Gold. This offers more opportunity for the market outside of what is happening with the dollar and yields. Along with that, even when we have seen the market break below the 23.06 retracement level, the trendline support going back to the lows from August of 2022 have held strong.
Bad News:
Even if you are bullish, it is essential to assess the downside risk before entering a market. The trendline support is going to be the key support level that needs to hold for the market to have any chance of a sustained rally. A break and a close below this level could spark additional selling pressure, and there is a lot of room to the downside for the market to try and find support.
As we are looing to head into Q4 and have end of month and end of quarter today, there should be expected volatility in Silver and the other macro markets as well, but keep an eye on this trendline support as we head into what hopes to be a strong Q4!
Check out CME Group real-time data plans available on TradingView here: www.tradingview.com
Disclaimers:
CME Real-time Market Data help identify trading set-ups and express my market views. If you have futures in your trading portfolio, you can check out on CME Group data plans available that suit your trading needs www.tradingview.com
*Trade ideas cited above are for illustration only, as an integral part of a case study to demonstrate the fundamental concepts in risk management under the market scenarios being discussed. They shall not be construed as investment recommendations or advice. Nor are they used to promote any specific products, or services.
Futures trading involves substantial risk of loss and may not be suitable for all investors. Trading advice is based on information taken from trade and statistical services and other sources Blue Line Futures, LLC believes are reliable. We do not guarantee that such information is accurate or complete and it should not be relied upon as such. Trading advice reflects our good faith judgment at a specific time and is subject to change without notice. There is no guarantee that the advice we give will result in profitable trades. All trading decisions will be made by the account holder. Past performance is not necessarily indicative of future results.

Silver upside move started On Our Harmonic pattern indicator based trade setup take trade as explained below :-
Early trades Buy or sell below/ above 23.6 %, safe trades buy or sell above / below 41% , after taking trade next upside or downside levels will be target ,
When reverse buy or sell signal appear then book profit on Target or trail SL to 23.6 % If trailing SL hit then early trade can be taken above or below 23.6 and safe trade can b taken above/ below 41% ..
Please note:-
It's working on news based and volitile market very well so exit if SL hit
Silver is Primed for a Big MoveSilver has been caught in a technical wedge since the all-time highs of April 2011 and the lows of March 2020. Price action in the year of 2023 has started to coil up tightly as prices battle the bottom and topside of the wedge ranges. Moving forward, real interest rate yields, and a slowing Chinese economy will remain major headwinds to silver and the precious metals complex as a whole. Interest rate yields have been breaking out to the upside which have sent prices lower as of late.
With that being said, the 50 Day EMA will provide near term support, and if this level were to fail, the next level to watch would be the 22.55 – 22.75 level on the December 23’ futures contract. The bottom end of the wedge range “Major Trend Line Support” will be the final area of defense for the silver market.
Conversely, if silver can hold the 50 day EMA as support. This shows near term consolidation/strength. We would need to get above 24.00 before we can retest the top end of the wedge range “Major Trend Line Resistance” and this top end will act as a brick wall for the silver market. To understand momentum, as the silver market is approaching major support and resistance levels, a trader can use the Golden Cross, or Death Cross Strategy. The Golden Cross occurs when the 50 day EMA crosses above the 200 day EMA, while the Death Cross occurs when the 50 day EMA crosses below the 200 day EMA.
Check out CME Group real-time data plans available on TradingView here: www.tradingview.com Disclaimers: CME Real-time Market Data help identify trading set-ups and express my market views. If you have futures in your trading portfolio, you can check out on CME Group data plans available that suit your trading needs www.tradingview.com
*Trade ideas cited above are for illustration only, as an integral part of a case study to demonstrate the fundamental concepts in risk management under the market scenarios being discussed. They shall not be construed as investment recommendations or advice. Nor are they used to promote any specific products, or services.
Futures trading involves substantial risk of loss and may not be suitable for all investors. Trading advice is based on information taken from trade and statistical services and other sources Blue Line Futures, LLC believes are reliable. We do not guarantee that such information is accurate or complete and it should not be relied upon as such. Trading advice reflects our good faith judgment at a specific time and is subject to change without notice. There is no guarantee that the advice we give will result in profitable trades. All trading decisions will be made by the account holder. Past performance is not necessarily indicative of future results.

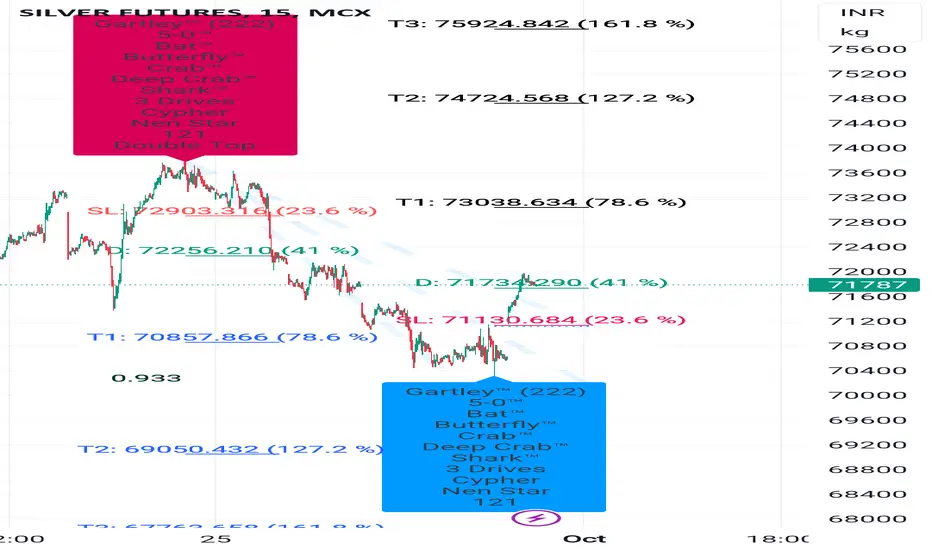
After good upside move silver ready for 75600For all trade on my Auto Harmonic patterns indicator trade setup -
Risky trades can take trade after crossing 23.6% on either side and safe traders can take trade after 41% We can start buying when our Trailing SL hit at 23.6% with SL of recent low our Target will be 41%, 78.6% , 127.2% 161.8% and 223.6 % , when reversal pattern appears on chart we have to trail our SL if trailing SL hit exit from long trade and initiate sell trade ,

silver spot updta eblwsilver spot blw 22.92 expect dwn 22.74--60$ in mcx 71700 blw expect 71400-230 near-- yes already on lower side
silver spot or mcx update blwsilver spot 23.45 stya abv nxt up side 23.79-24$+++++++ in mcx buy silver dipsss on tgt expect 74300-74700++++++++ keep tight sl 23.20$ let seeeee wht nxt in 2-33 session

report updated which sold gvn blw nifty bank nifty or curde axisnifty sold gvn 20100 hit 19930 low bank nifty blw 45900 to 45440 axis bank 1038 to 1028--or crude 7500 to 7404 low made hope minted all money or not!!!! who stuck wrong side tell here will se as per technical or rules-- nxt move lvl keep eyes here

dont miss the opportunity in the silver longCertainly, here's your text rewritten as if it were an analysis brief on TradingView:
---
**Technical Analysis Brief: Silver**
*Date: *
**Analysis Overview:**
Greetings, traders! I've conducted a concise technical analysis on the Silver market, and I'd like to share my findings with you. In recent observations, Silver has exhibited some promising signs, which could potentially lead to a favorable trading opportunity.
**Key Findings:**
1. **Hammer Formation:** At the conclusion of a downtrend, Silver has formed a notable hammer candlestick pattern. This suggests a potential reversal in the market sentiment, as the bulls are showing signs of strength.
2. **Morning Star Pattern:** Additionally, there is a clear morning star pattern emerging on the charts. This is a bullish three-candlestick pattern, further supporting the notion of a trend reversal.
**Price Projection:**
If my technical analysis holds true, we may anticipate a positive price movement in the Silver market over the next 20 days. The projected target price is approximately 77,800. This presents an attractive trading opportunity for those looking to capitalize on potential gains.
**Closing Remarks:**
If you found value in my analysis, please consider showing your support by liking this post and following me for more updates. Remember to conduct your own research and risk management before entering any trade. Happy trading!
